MEMBERS ONLY
What to Watch If the Crypto Space Rallies Higher
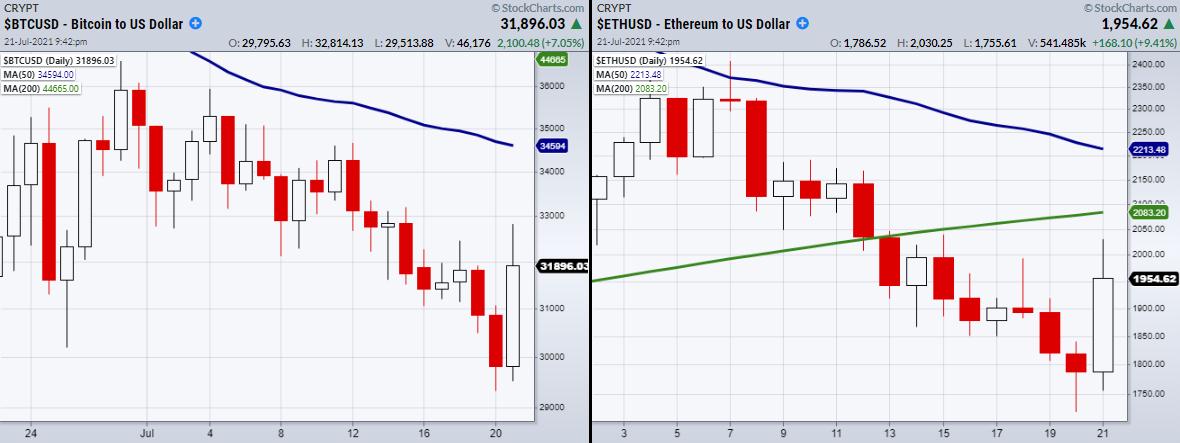
Two of the biggest-by-market cap cryptocurrencies, Bitcoin and Ethereum, have perked up near the lows. Both have been trending down for the past month and looked as if they would test their recent lows created on 6/22: $28.8k for Bitcoin and $1700 for Ethereum.
However, while Wednesday'...
READ MORE
MEMBERS ONLY

STOCK REBOUND CONTINUES -- CYCLICAL SECTORS ARE LEADING -- 10-YEAR TREASURY YIELD REGAINS 200-DAY AVERAGE

by John Murphy,
Chief Technical Analyst, StockCharts.com
MARKET REBOUND CONTINUES... Stocks had another strong day today and have more than made back their sharp losses from Monday. Chart 1 shows the Dow Industrials closing above their 50-day average for the second day in row. Chart 2 shows the S&P 500 gaining more ground following Monday&...
READ MORE
MEMBERS ONLY
How to Profit Off the Market's New Reversal Pattern
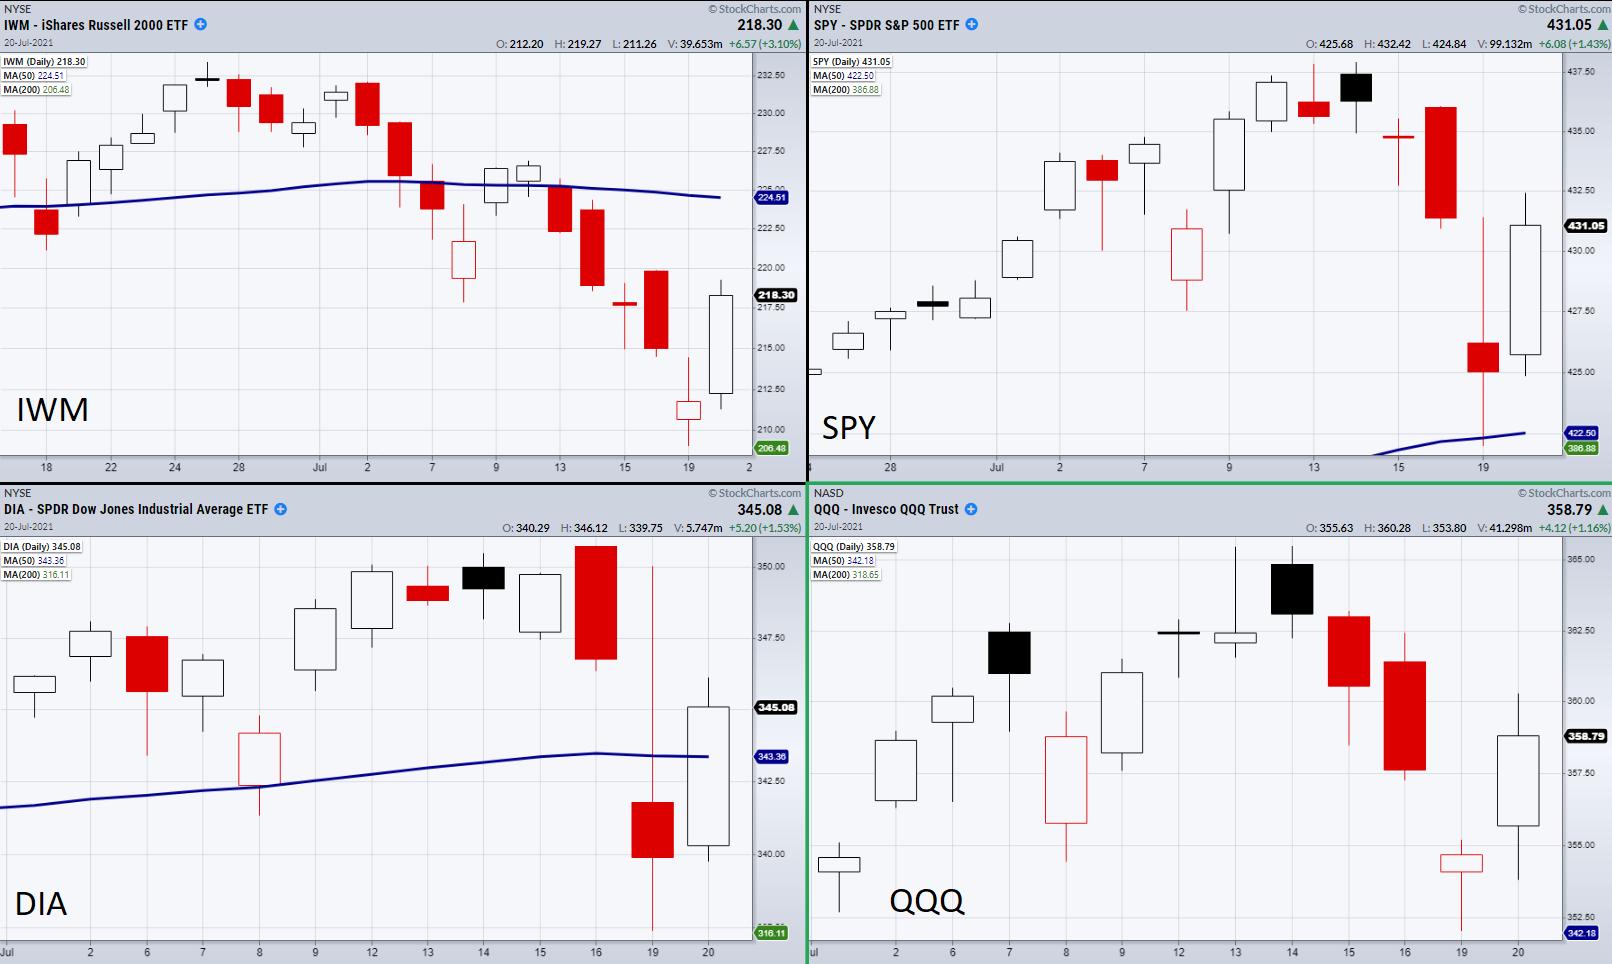
On Tuesday, the 4 major indices confirmed a reversal pattern with a close over the prior day's high. In the above chart, you can see all four indices created a new support level that needs to hold based on Monday's low. Having said that, we can...
READ MORE
MEMBERS ONLY

Long Overdue RRG Basket Update

by Julius de Kempenaer,
Senior Technical Analyst, StockCharts.com
First of all, I'm sorry I had to cancel today's episode of Sector Spotlight. I've been battling a nasty cough/cold and a sore throat with not much voice left for a week now, and things did not improve enough to do a decent...
READ MORE
MEMBERS ONLY

The Correction May Not Be as Bad as You Think

by Martin Pring,
President, Pring Research
The bad news is that a correction is underway and that many indicators and market averages have started to break through key support. The good news is that, internally, corrective activity has been underway for several months. Provided the bull market is still in existence (and there are few grounds...
READ MORE
MEMBERS ONLY

DP TV: Under the Hood - Sector Strength and Weakness

by Erin Swenlin,
Vice President, DecisionPoint.com

by Carl Swenlin,
President and Founder, DecisionPoint.com
In this episode of DecisionPoint, Carl gives us his analysis of today's sell-off and discussed today's Downside Exhaustion Climax, showing us what to expect from this important signal and how to identify market climaxes. Erin takes a look "under the hood" at sectors that...
READ MORE
MEMBERS ONLY
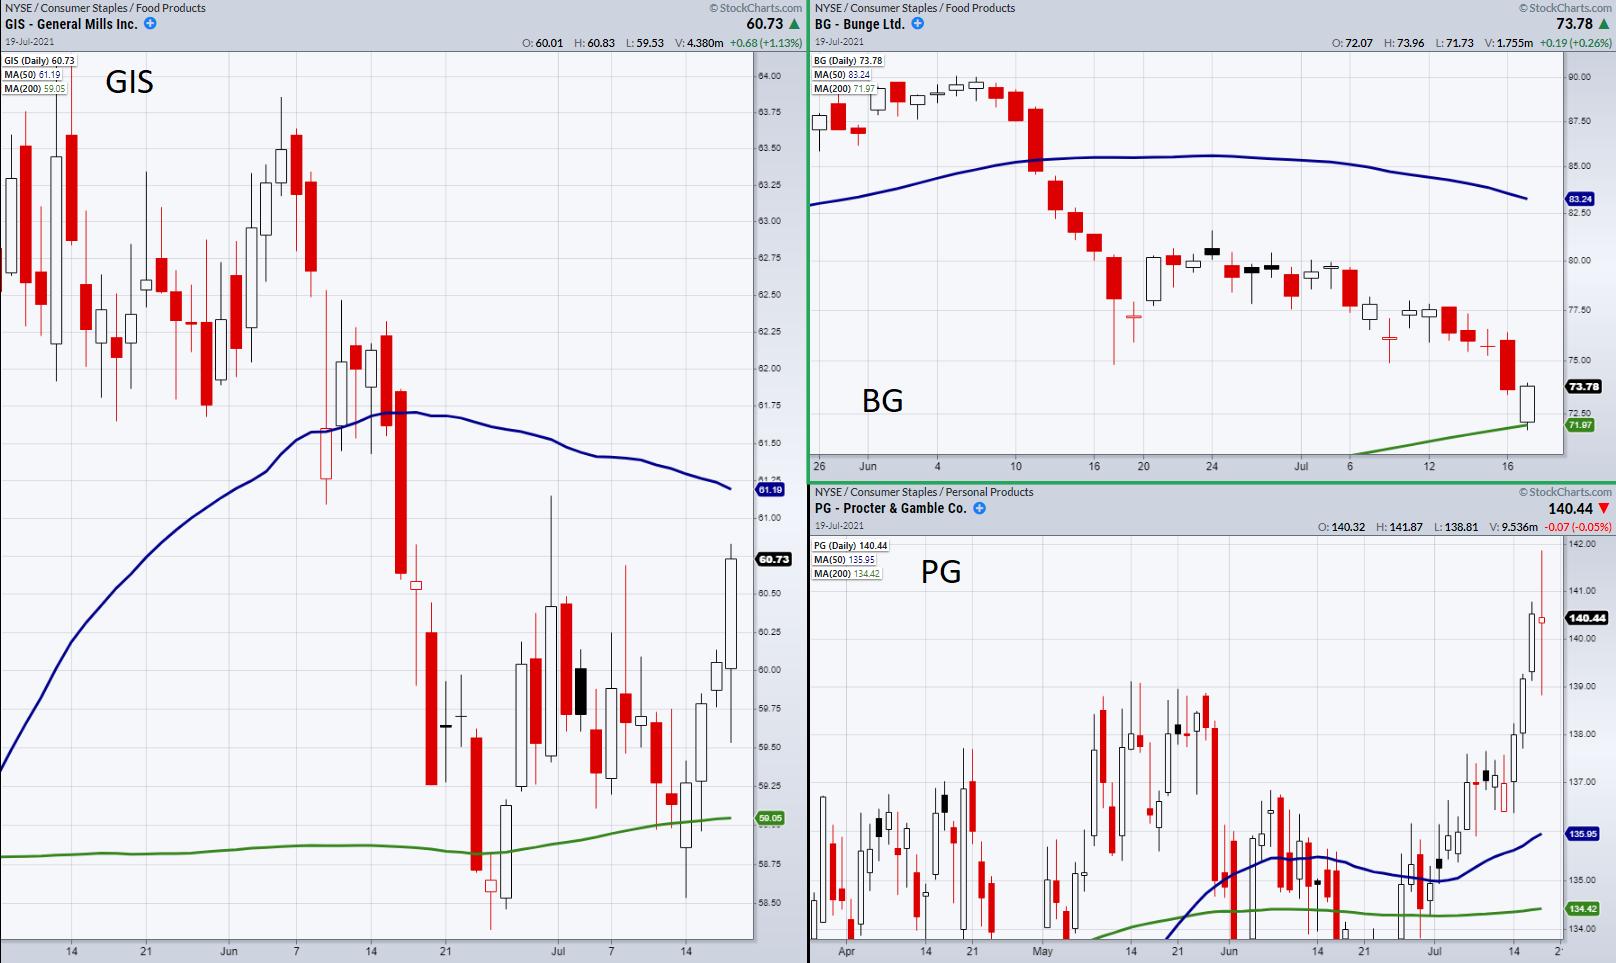
Why It Might Be Time to Start Looking at Consumer Staples
With the markets' recent decline, investors' mindsets could be shifting into protecting gains made throughout the year. The recent blowoff from highs has also brought in more volatility with a potentially choppier environment. Additionally, pandemic worries have increased as the COVID delta variant threatens progress towards reopening countries...
READ MORE
MEMBERS ONLY
How the Impending Correction May Actually Play Out

by David Keller,
President and Chief Strategist, Sierra Alpha Research
As the S&P 500 and Nasdaq 100 indexes have pounded away at new all-time highs basically every month in 2021, investors are left to wonder when a correction may actually be coming. We were taught that markets don't just go straight up, but instead they move...
READ MORE
MEMBERS ONLY

DOW LEADS MARKET SELLOFF -- SMALL CAPS BREAK CHART SUPPORT -- 10-YEAR YIELD BREAKS 200-DAY LINE -- ENERGY AND FINANCIALS LEAD DECLINES
by John Murphy,
Chief Technical Analyst, StockCharts.com
DOW SHATTERS 50-DAY LINE... Stocks are opening the week sharply lower and on the pace for one of the year's biggest losses. Although all market averages are under pressure, the Dow is leading the decline. Chart 1 shows the Dow Industrials plunging below their 50-day average. The next...
READ MORE
MEMBERS ONLY

Week Ahead: Stay Alert as NIFTY Awaits a Breakout Amid Weak Technical Setup

by Milan Vaishnav,
Founder and Technical Analyst, EquityResearch.asia and ChartWizard.ae
The Indian equities showed a lot of resilience throughout the past five trading days and managed to close on a fresh weekly near its fresh all-time high point. The markets stayed resilient to the downsides, but, at the same time, showed fierce consolidation at higher levels and did not make...
READ MORE
MEMBERS ONLY
Broader Markets are Looking Weary. Here's How to Build Your Watch List

by Mary Ellen McGonagle,
President, MEM Investment Research
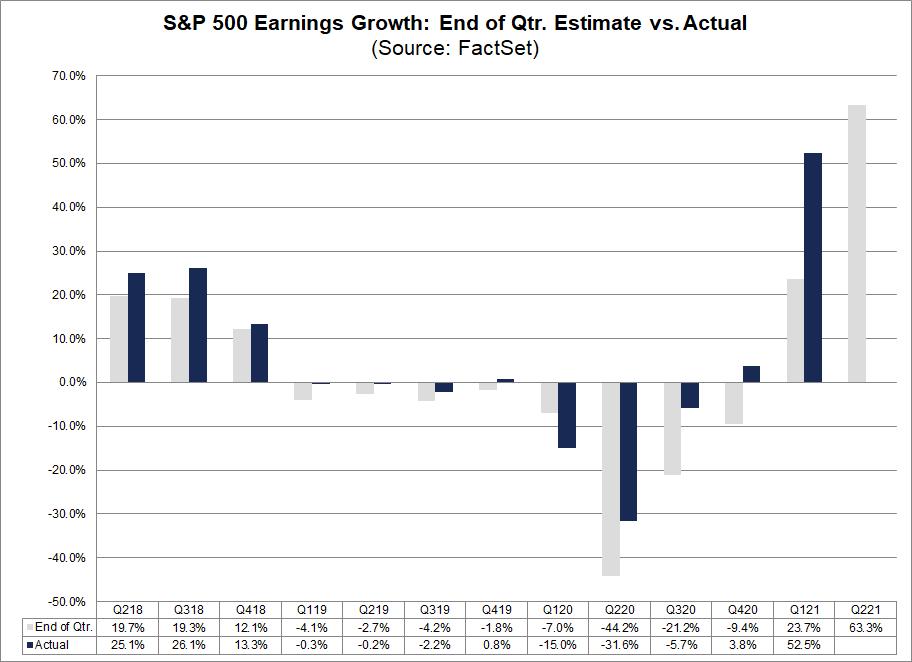
If you want to uncover the next big winning stock, now is the ideal time to be screening the markets. Why? Because proven studies have shown that the #1 driver of a stock that goes on to far outpace the markets is big, accelerating earning-per-share (EPS) growth.* This growth in...
READ MORE
MEMBERS ONLY
What the Impending Correction May Look Like
by David Keller,
President and Chief Strategist, Sierra Alpha Research
As the S&P 500 and Nasdaq 100 indexes have pounded away at new all-time highs basically every month in 2021, investors are left to wonder when a correction may actually be coming. We were taught that markets don't just go straight up, but instead they move...
READ MORE
MEMBERS ONLY
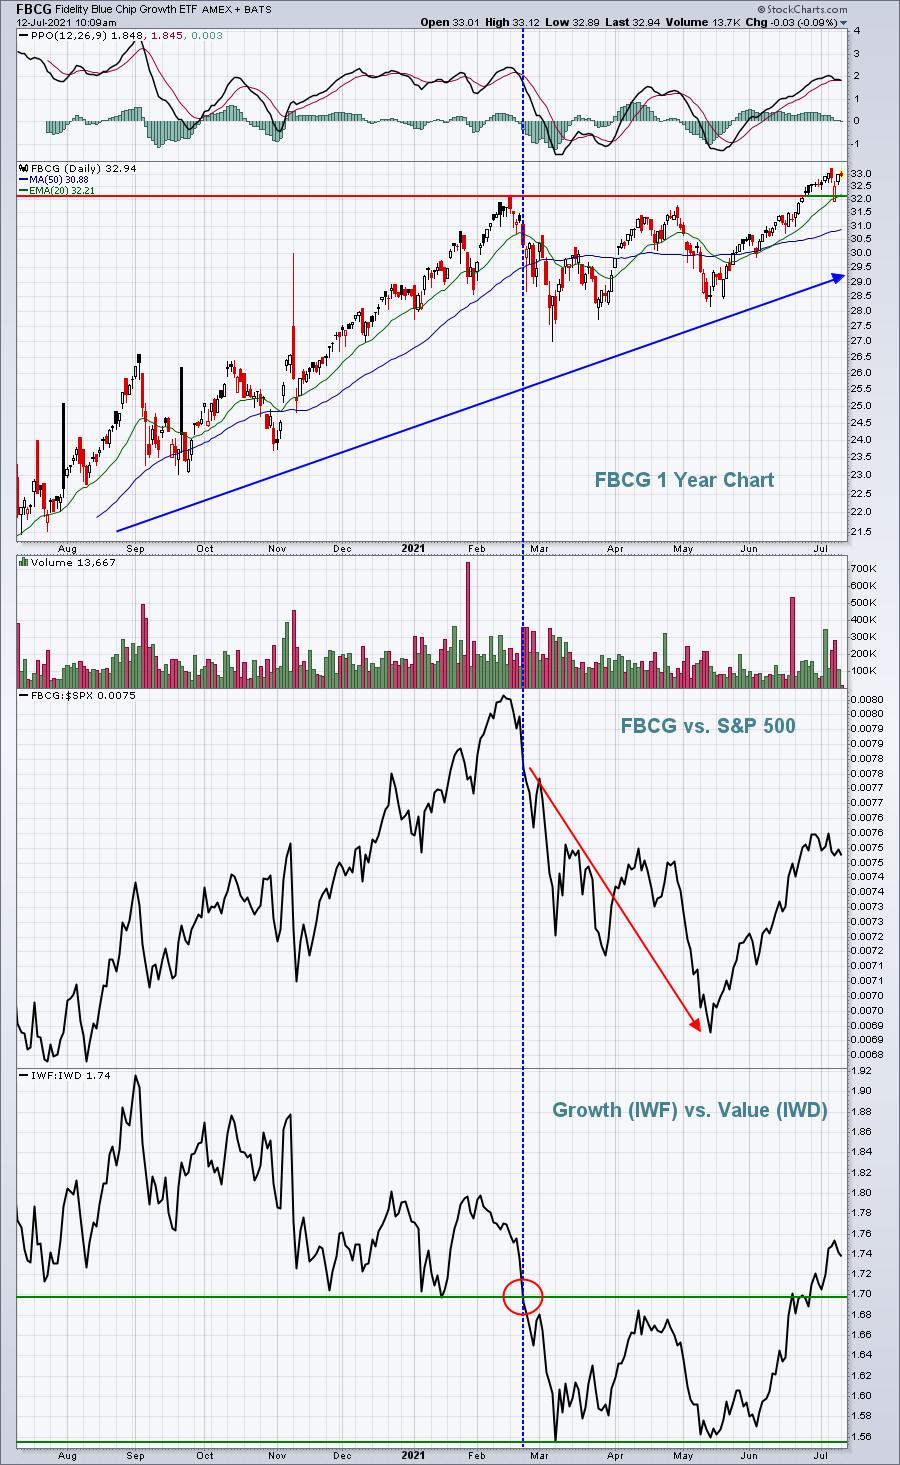
The IYW Shines -- See Why

by John Hopkins,
President and Co-founder, EarningsBeats.com
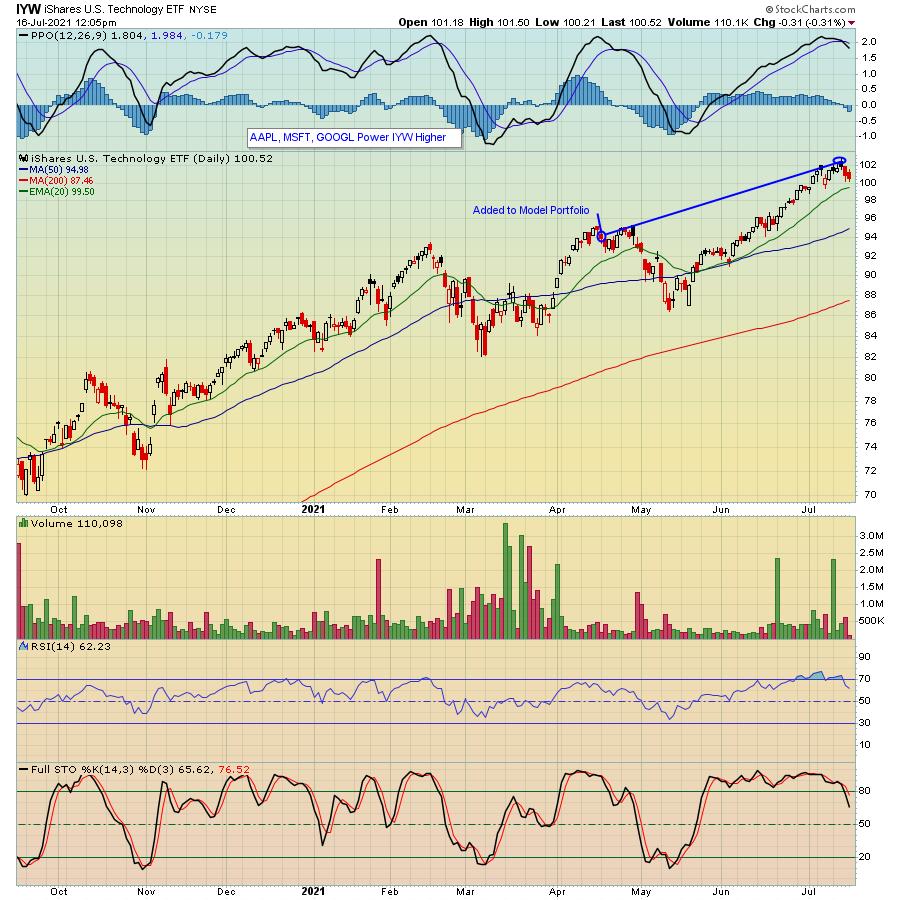
The IYW is a US Technology ETF. Its three largest holdings are AAPL, MSFT and GOOGL. At its peak this past Wednesday, it was higher by 9.4% from the date it was added to our ETF Model portfolio on April 19, compared to the S&P of 5....
READ MORE
MEMBERS ONLY

Downside Ahead for These Areas!
by Mary Ellen McGonagle,
President, MEM Investment Research
This week on StockCharts TV'sThe MEM Edge, Mary Ellen reviews weak areas of the market that appear poised to head lower. She also discusses important takeaways from companies that have reported 2nd quarter results, as well as stocks trending upward on Delta variant news.
This video was originally...
READ MORE
MEMBERS ONLY
Market Reckoning -- Will Support Levels Hold?
Over the last week, we heard the chair of the Federal Reserve, Jerome Powell, address worries over the recent 5.4% year over year inflation increase. While the Fed continues to hold an accommodative stance with its bond-buying program, some are doubting whether the Fed is taking inflation seriously.
So...
READ MORE
MEMBERS ONLY
Thinking Outside the US Box
by Julius de Kempenaer,
Senior Technical Analyst, StockCharts.com
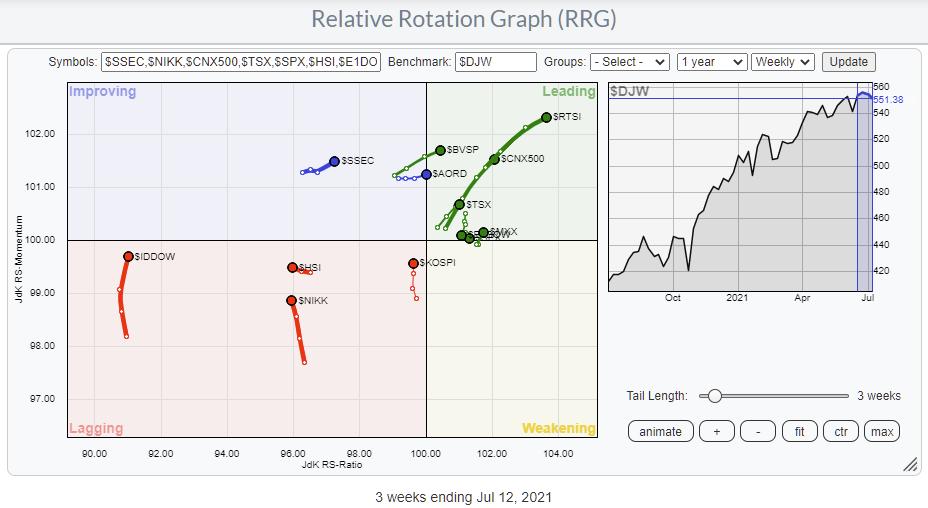
The Relative Rotation Graph above shows the rotation for major stock market indexes against the Dow Jones Global Index.
First of all, this is a so-called "open universe" which means that not all constituents of the benchmark are plotted on the graph. As a result, the universe is...
READ MORE
MEMBERS ONLY
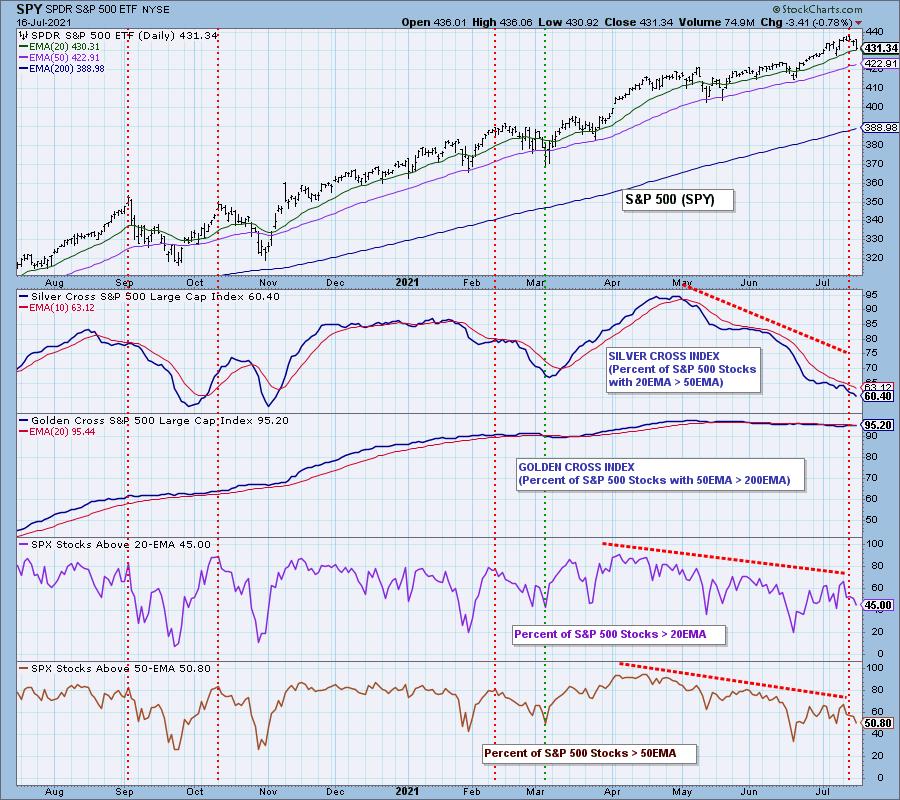
Participation Keeps Getting Worse
by Carl Swenlin,
President and Founder, DecisionPoint.com
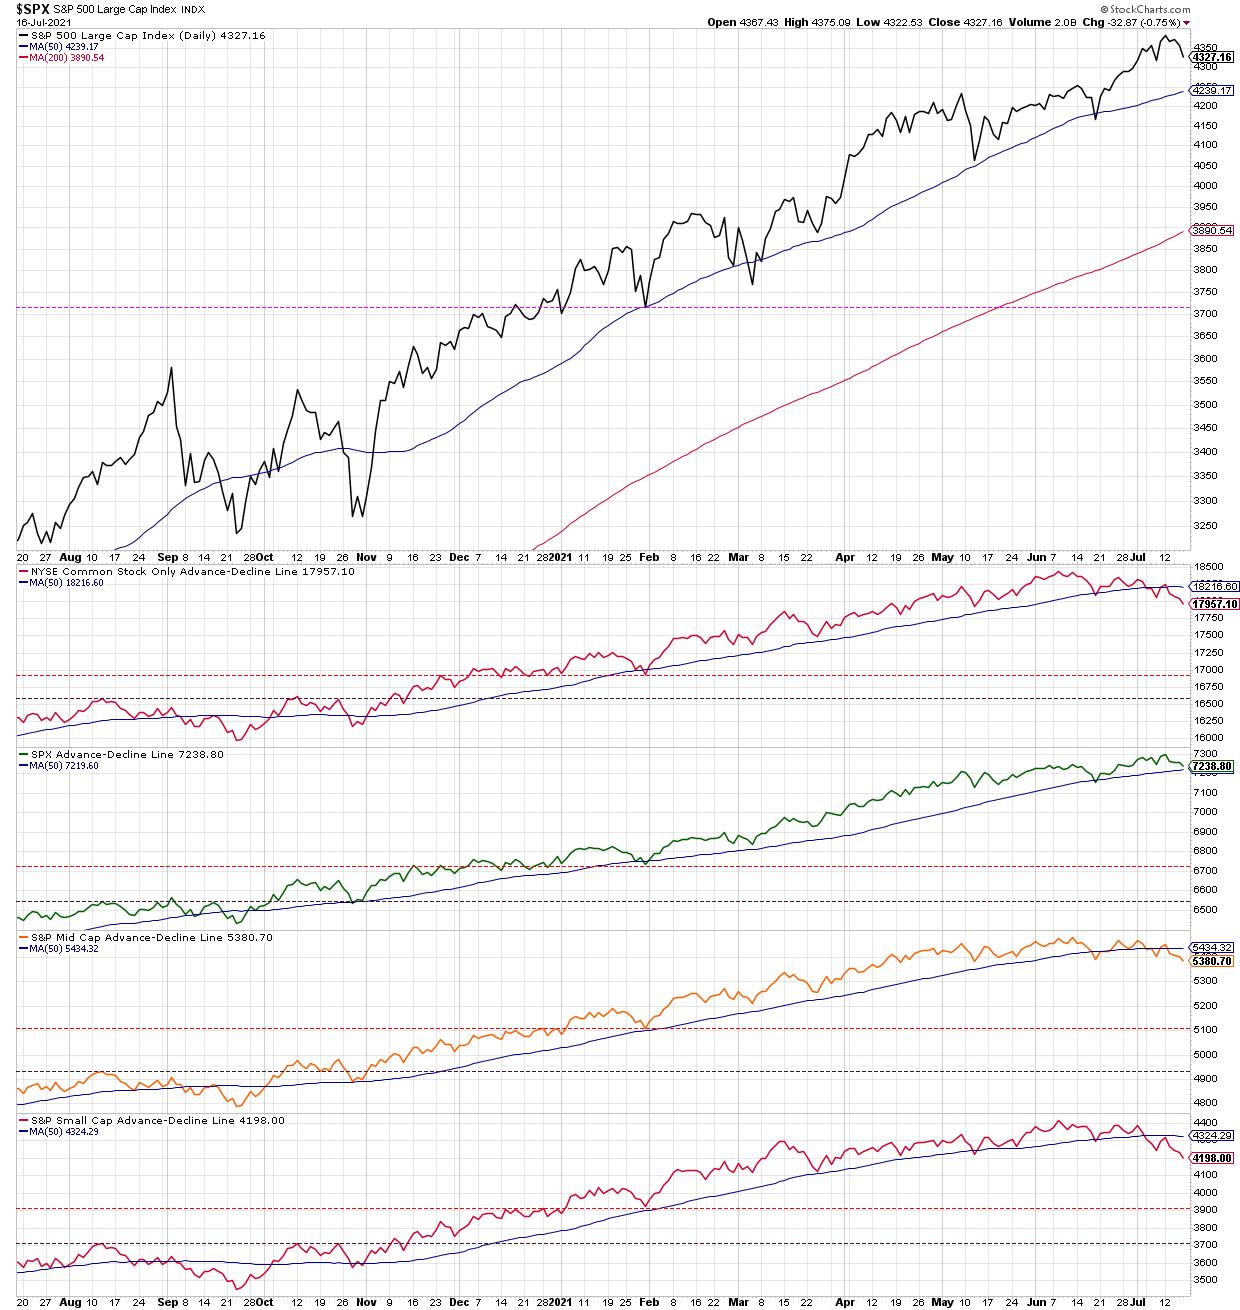
In spite of the market making new, all-time highs this week, participation continued to deteriorate. Our focus is usually on the S&P 500 Large-Cap Index, so we'll begin with that, but mid- and small-cap stocks are really looking bad as well. The Silver Cross Index for...
READ MORE
MEMBERS ONLY

Chartwise Women: New Pockets of Strength!
by Mary Ellen McGonagle,
President, MEM Investment Research
by Erin Swenlin,
Vice President, DecisionPoint.com
In this week's edition of Chartwise Women, Erin and Mary Ellen show us exactly how they find "pockets of strength" within the market. Regardless of market direction, there are almost always groups that are outperforming. Erin and Mary Ellen uncover industry groups that are showing new...
READ MORE
MEMBERS ONLY

How to Handle Breakouts

by Joe Rabil,
President, Rabil Stock Research
In this week's edition of Stock Talk with Joe Rabil, Joe shows how he evaluates breakout patterns, using ADX/DI to help find the stocks that are developing with the best characteristics. In addition, he describes what tells us that we need to be more careful about buying...
READ MORE
MEMBERS ONLY

Bank Earnings are Here, But Which Companies Show the Most Profit Potential?
Earnings season is upon us and with, the rising market, earnings expectations have followed. This is especially true for the banking sector, which is supposed to have well outperformed the first quarter. The reason for such predictions can be attributed to banks' increased profits from low-interest rates enticing a...
READ MORE
MEMBERS ONLY

The Only Question That You Need to Ask

by Dave Landry,
Founder, Sentive Trading, LLC
In this edition of Trading Simplified, Dave covers the topic not all textbook writers actually trade. He continues his discussion "Thinking Like A Trader", showing the open setup and open portfolio.
This video was originally broadcast on July 14, 2021. Click anywhere on the Trading Simplified logo above...
READ MORE
MEMBERS ONLY

US Breaks Out Against the World as Bonds Fail at 200-day Moving Average
by Martin Pring,
President, Pring Research
The US Breakout
The S&P has been in a secular or very long-term uptrend against the Dow Jones World Stock Index since the financial crisis. That trend is still intact, as the ratio remains above its 2011-2021 up trendline. The primary trend picture is a bit mixed as...
READ MORE
MEMBERS ONLY
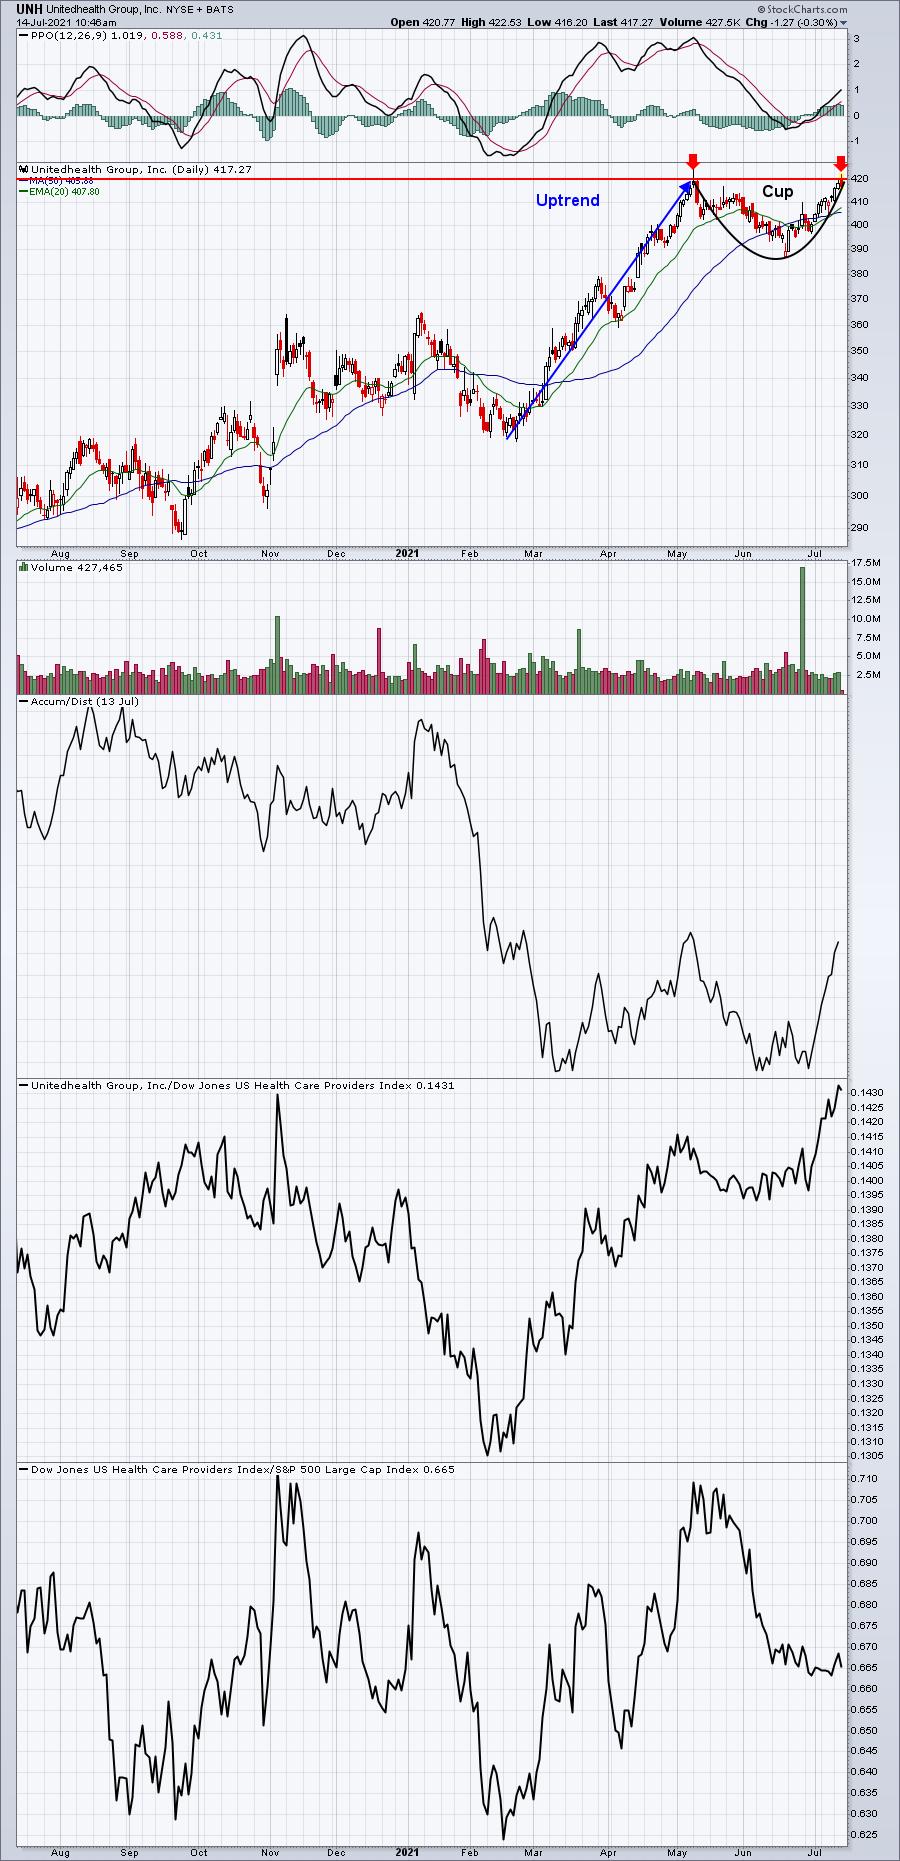
Will Earnings Be The Catalyst To Drive Breakouts In These 3 Dow Jones Stocks?

by Tom Bowley,
Chief Market Strategist, EarningsBeats.com
As the stock market pushes further and further into record high territory, many companies have been slower to participate. For instance, the Dow Jones keeps trying to close above 35000 for the first time in history, yet many of its component stocks are still on the verge of breaking out....
READ MORE
MEMBERS ONLY

Sector Spotlight: Answering Viewer Questions (+ Charting the Second Half!)
by Julius de Kempenaer,
Senior Technical Analyst, StockCharts.com
On this edition of StockCharts TV's Sector Spotlight, I seize the opportunity to answer questions from the mailbag. Why is this stock showing a negative performance while it is inside the leading quadrant? Can you give some guidelines on where to buy or sell? These are the major...
READ MORE
MEMBERS ONLY
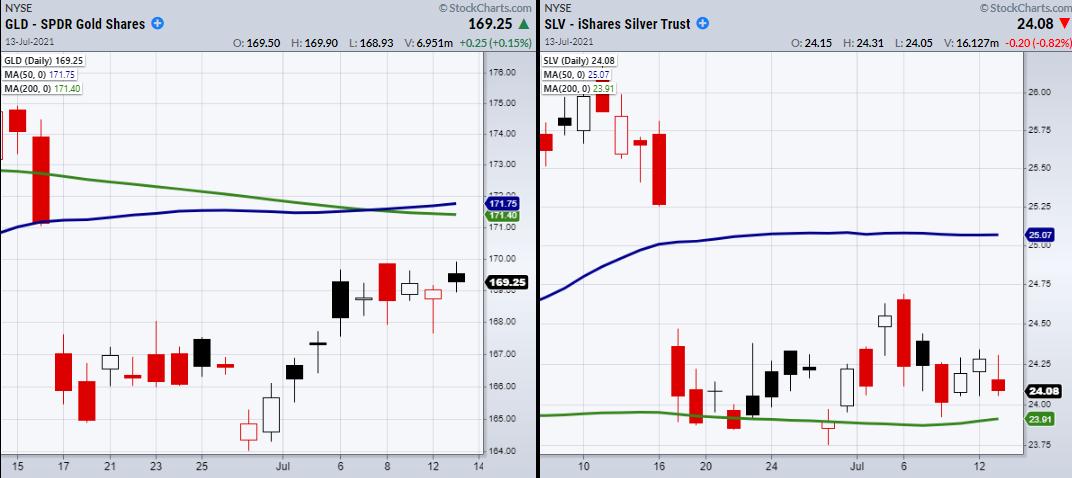
How to Time Your Next Trade in Precious Metals
With the release of the Consumer Price Index (CPI) report showing an inflation increase of 5.4% compared to the expected 3.8%, we should pay close attention to investments that keep inflation in mind. Though we have recently talked about food commodities and agricultural tech as potential hedges against...
READ MORE
MEMBERS ONLY
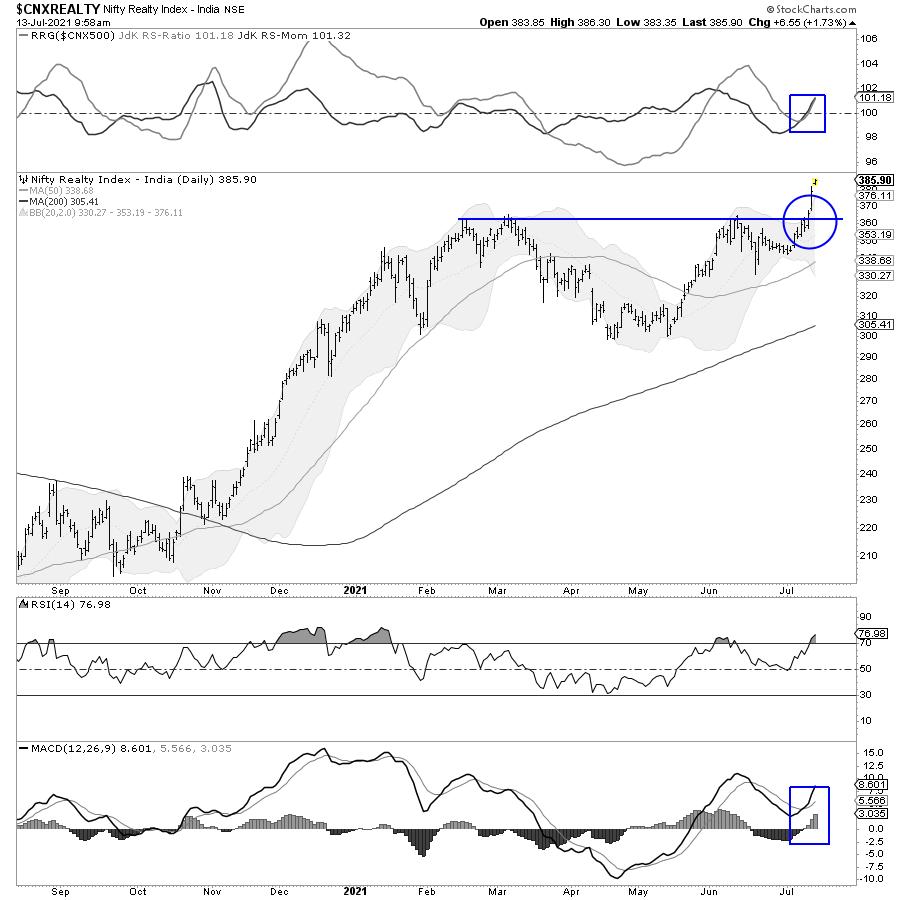
Realty Space: Look What These Six Charts Are Saying!
by Milan Vaishnav,
Founder and Technical Analyst, EquityResearch.asia and ChartWizard.ae
The NIFTY Realty Index is showing strong technical setup on both its Daily and Weekly charts. Some sector rotation is clearly evident and the sector is showing strong Relative Strength against the broader markets.
The Daily Chart of the NIFTY Realty Index show a strong breakout above 360. Even if...
READ MORE
MEMBERS ONLY
DP TV: DP Barometer of FAANG+ Stocks
by Erin Swenlin,
Vice President, DecisionPoint.com
by Carl Swenlin,
President and Founder, DecisionPoint.com
In this episode of DecisionPoint, Carl covers the SPY and its associated indicators, paying particular attention to participation within the broad markets, as well as some observations on Disney (DIS) and Communications Services (XLC). He also takes a look at the Big Four (Dollar, Gold, Crude & Bonds) and, of...
READ MORE
MEMBERS ONLY
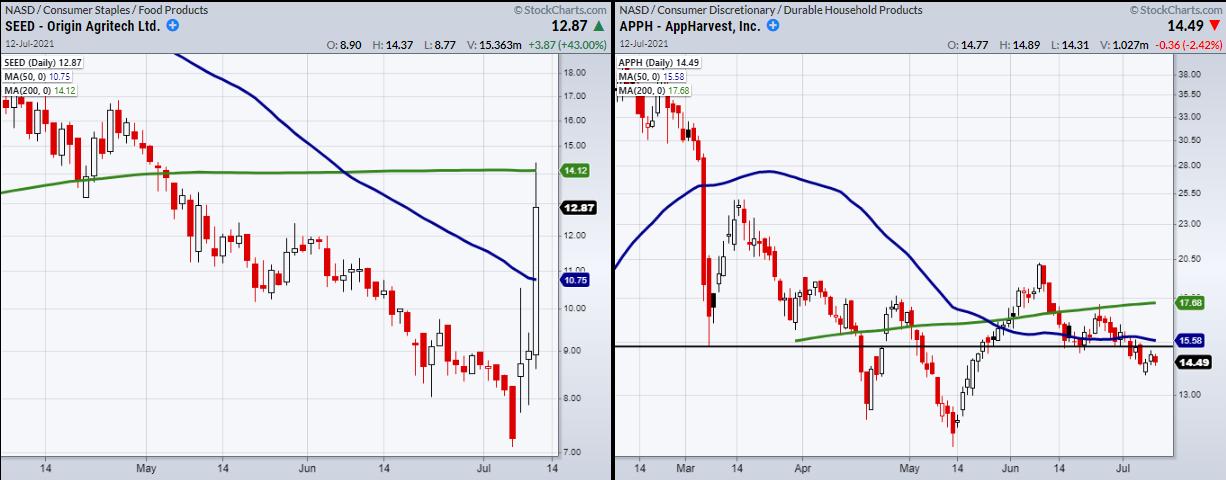
Is it Time to Watch the Agricultural Tech Trend?
Supply chain issues have become a common term heard throughout 2021 now that companies are struggling to bring back pre-pandemic supply levels. With that said, scaling supply is not so easy and takes time. This is especially tough within the agricultural space, which operates on cycles and can take multiple...
READ MORE
MEMBERS ONLY
Don't Blindly Buy ETFs, Use This Strategy Instead
by Tom Bowley,
Chief Market Strategist, EarningsBeats.com
It's great to hear about an awesome stock over the water cooler, but you should definitely do your own due diligence before committing capital. Exchange-traded funds, or ETFs, are a different animal altogether. ETFs are nothing more than a basket of stocks. They provide much more diversification, in...
READ MORE
MEMBERS ONLY

Week Ahead: NIFTY Mildly Violates This Pattern Support; RRG Chart Shows Mixed Sectoral Trends
by Milan Vaishnav,
Founder and Technical Analyst, EquityResearch.asia and ChartWizard.ae
Over the past five days, the Indian equity markets consolidated and traded in the limited range, ending the week with a modest loss. The NIFTY oscillated in the same range as the week before this one; though it ended on a negative note, it has also formed a parallel bar...
READ MORE
MEMBERS ONLY
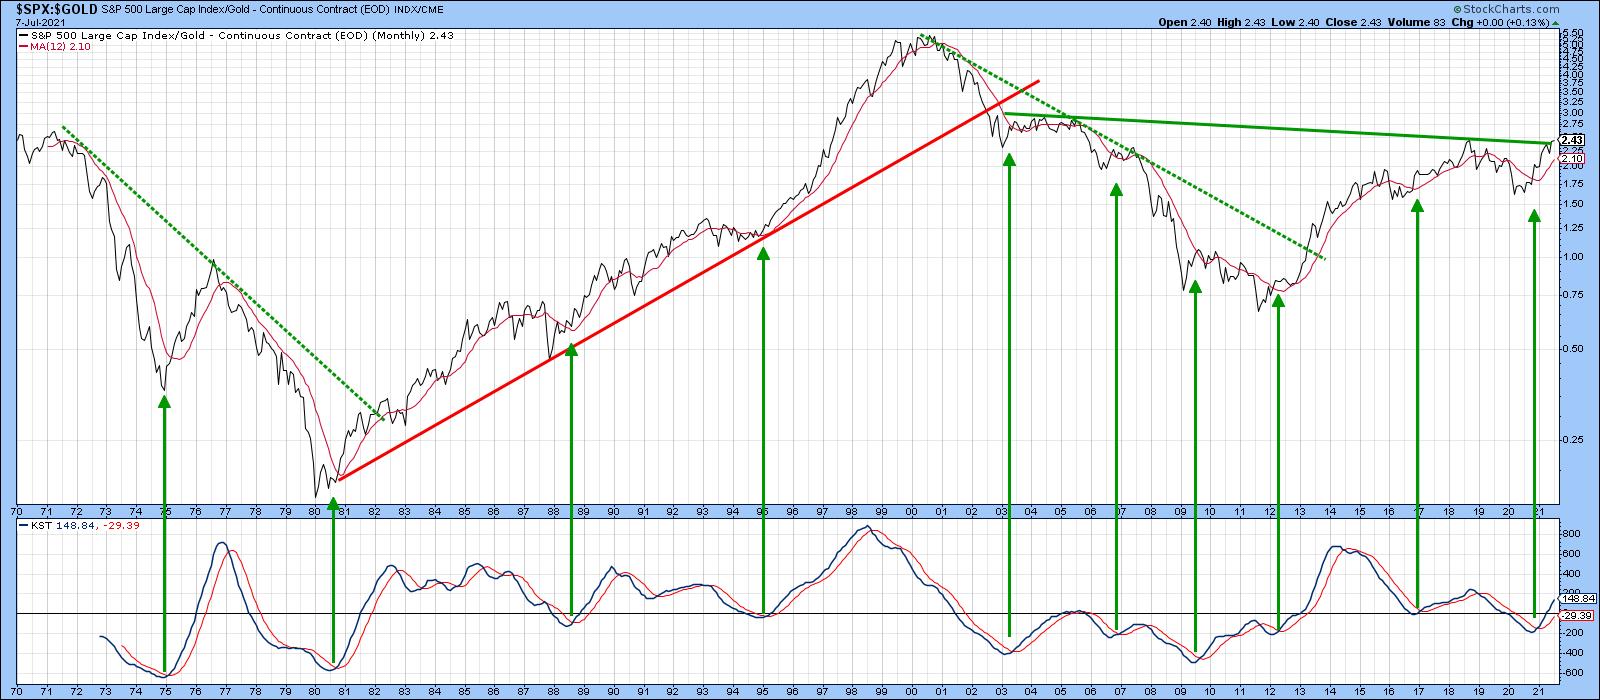
Three Intermarket Relationships That are at a Critical Point
by Martin Pring,
President, Pring Research
When reviewing my charts last weekend, several jumped out as being at a pretty critical juncture, and therefore worthy of monitoring going forward. A couple of them involved the stock market, so I'll start there.
Two Stock Market Relationships
I have always been fascinated by the relationship between...
READ MORE
MEMBERS ONLY
Base Breakouts and Turnarounds!
by Mary Ellen McGonagle,
President, MEM Investment Research
This week on StockCharts TV'sThe MEM Edge, Mary Ellen shares stocks that have broken out of bases this week, as well as names that have reversed their recent downtrends. She also highlights top candidates from this week's strongest sector.
This video was originally broadcast on July...
READ MORE
MEMBERS ONLY
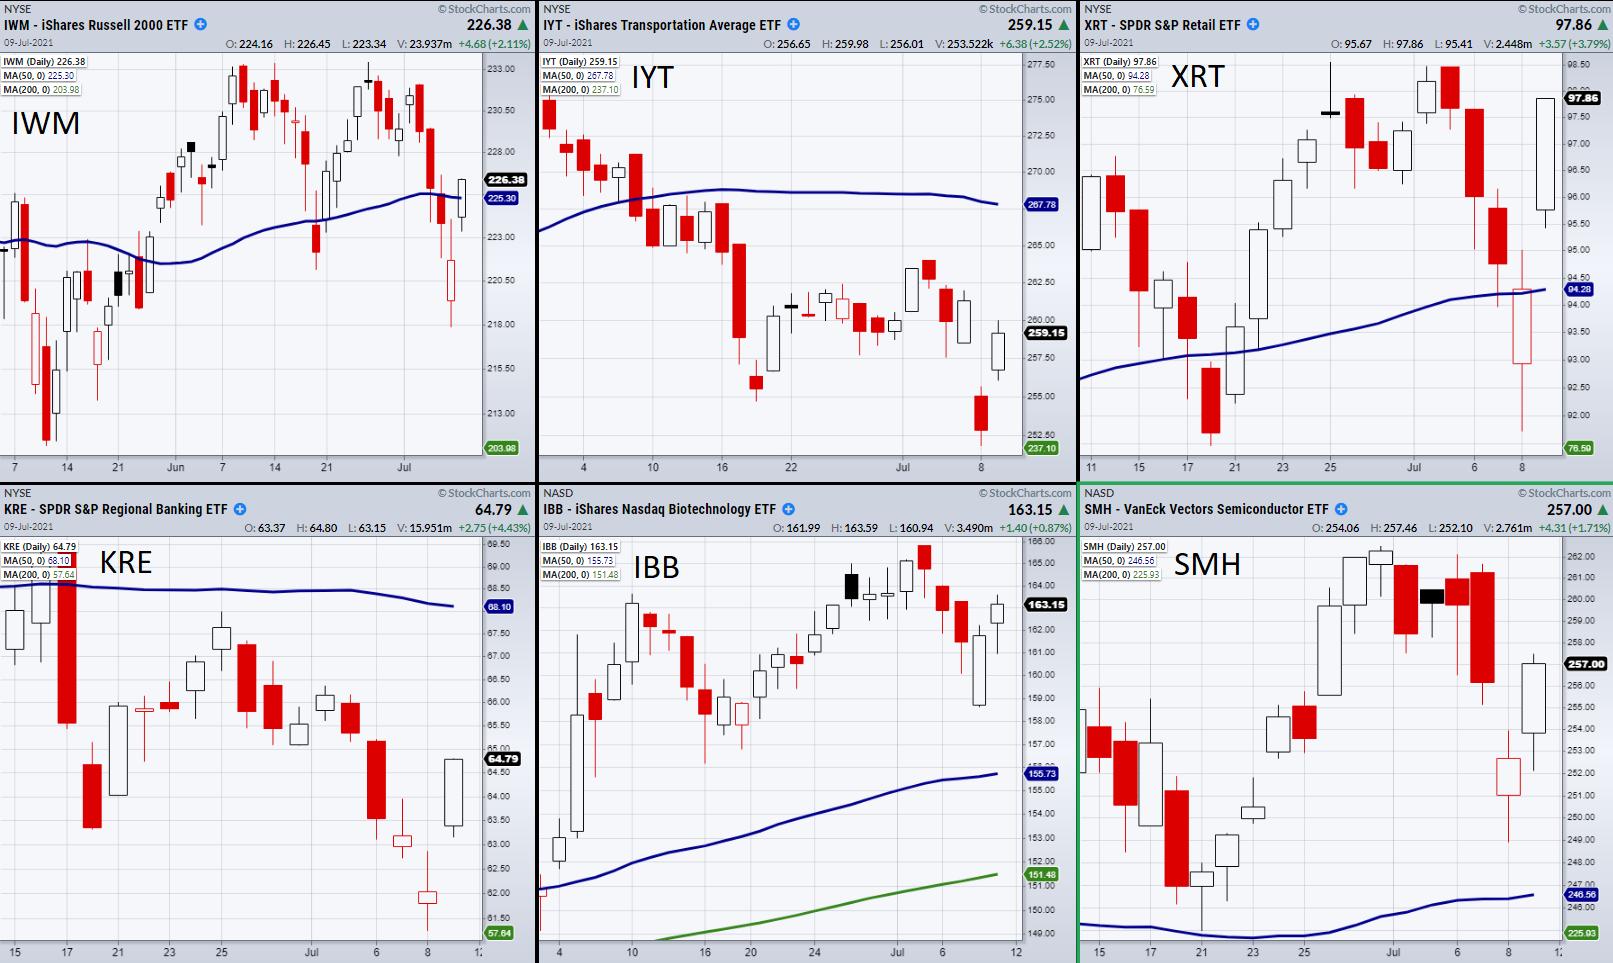
Has the Market Jumped from Cautious to Bullish Sentiment?
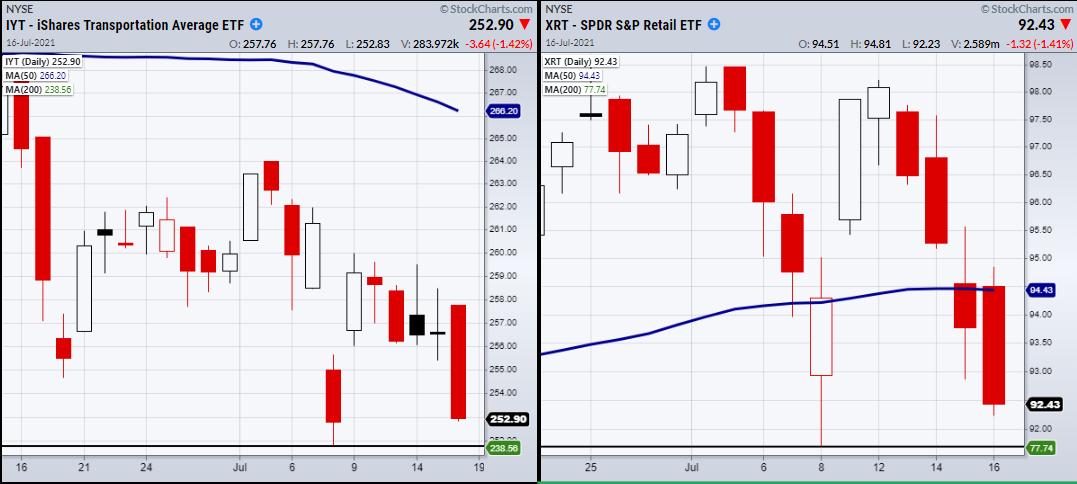
On Friday, the Economic Modern Family, which consists of 5 sectors and 1 major index, made a quick turnaround in the small-cap index (IWM) and the retail space (XRT). Both closed over their 50-day major moving averages and are now in unconfirmed bullish phases, as seen in the above chart....
READ MORE
MEMBERS ONLY
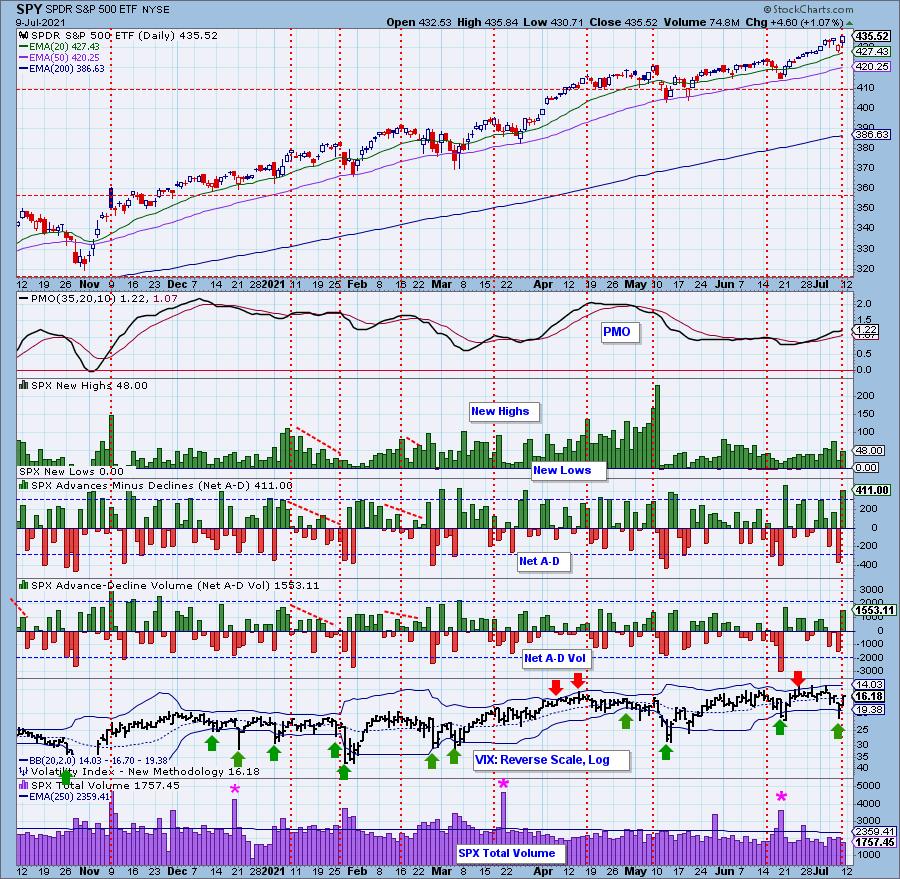
DecisionPoint Climax Analysis - Upside Initiation Today
by Erin Swenlin,
Vice President, DecisionPoint.com
DecisionPoint employs "Climax Analysis" -- and only DecisionPoint.com has it. Determination of "climax days" is invaluable for the short-term trader. We've found that, by analyzing Net Advances-Declines, the VIX, Total Volume and Volume Ratios, we get excellent signals on what to expect over...
READ MORE
MEMBERS ONLY

Steel ETF Makes a Bid to End Correction

by Arthur Hill,
Chief Technical Strategist, TrendInvestorPro.com
The Steel ETF (SLX) led the market from late October to early May by more than doubling in price. The ETF then fell back with a break of the 50-day SMA in June, but this decline is viewed as a correction within a bigger uptrend. As such, it represents an...
READ MORE
MEMBERS ONLY

The Essential Foundation Of Stock Market Mastery Is Straightforward

by Gatis Roze,
Author, "Tensile Trading"
The investment press seems to be writing a good deal these days about mindfulness and living in the present. Similarly, a number of sports analysts are preaching the need of a "back to basics" philosophy for certain struggling athletic franchises.
My own take on all this is less...
READ MORE
MEMBERS ONLY
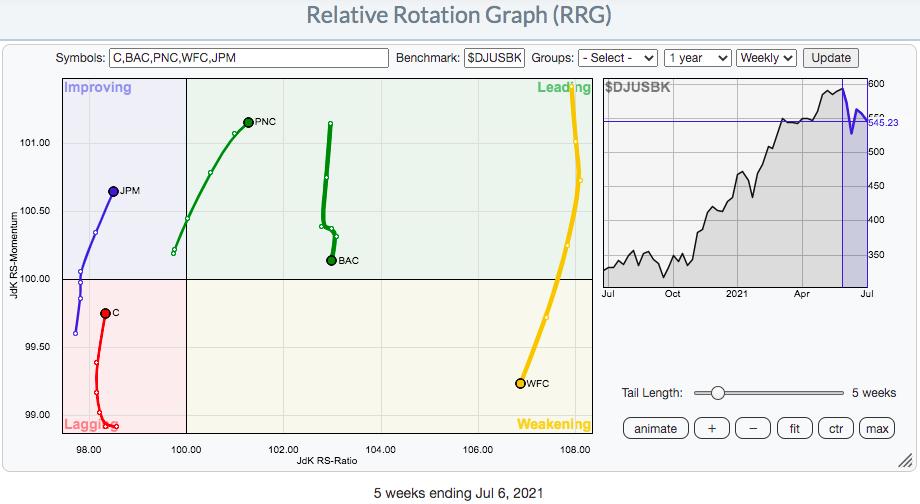
Are Strong AD Lines Suggesting Big Earnings Ahead for These 3 Companies?
by Tom Bowley,
Chief Market Strategist, EarningsBeats.com
Earnings season kicks off next week, with the big banks getting things started. After a rough stretch with falling treasury yields, the banks index ($DJUSBK) rallied on Friday as yields rebounded. Recently, I provided a relative strength look at key banks reporting next week. Here's a quick recap...
READ MORE
MEMBERS ONLY

TEN-YEAR TREASURY YIELD MAY BE BOTTOMING -- THAT WOULD HELP BANKS AND OTHER FINANCIALS
by John Murphy,
Chief Technical Analyst, StockCharts.com
TEN-YEAR TREASURY YIELD MAY BE BOTTOMING... A combination of technical factors suggests that the recent decline in bond yields may be at or near a bottom. Chart 1 shows the 10-Year Treasury yield starting to find support near its red 200-day moving average which usually acts as a support line...
READ MORE
MEMBERS ONLY
Chartwise Women: Buffer Volatility with High Dividend Stocks
by Mary Ellen McGonagle,
President, MEM Investment Research
In this week's edition of Chartwise Women, Mary Ellen reviews the slide in Treasury yields and shares high dividend stocks from sectors that are in bullish uptrends. These dividend-paying stocks can also buffer market volatility.
This video was originally recorded on July 8th, 2021. Click on the image...
READ MORE
MEMBERS ONLY
Using ADX to Evaluate Trend Strength
by Joe Rabil,
President, Rabil Stock Research
In this week's edition of Stock Talk with Joe Rabil, Joe Rabil explains some key points about ADX. He starts with some basics, then shows how ADX can be used to confirm trend strength and then evaluate the counter trend pullback. He then analyzes your stock picks, including...
READ MORE
