MEMBERS ONLY

Using ADX to Evaluate Trend Strength

by Joe Rabil,
President, Rabil Stock Research
In this week's edition of Stock Talk with Joe Rabil, Joe Rabil explains some key points about ADX. He starts with some basics, then shows how ADX can be used to confirm trend strength and then evaluate the counter trend pullback. He then analyzes your stock picks, including...
READ MORE
MEMBERS ONLY
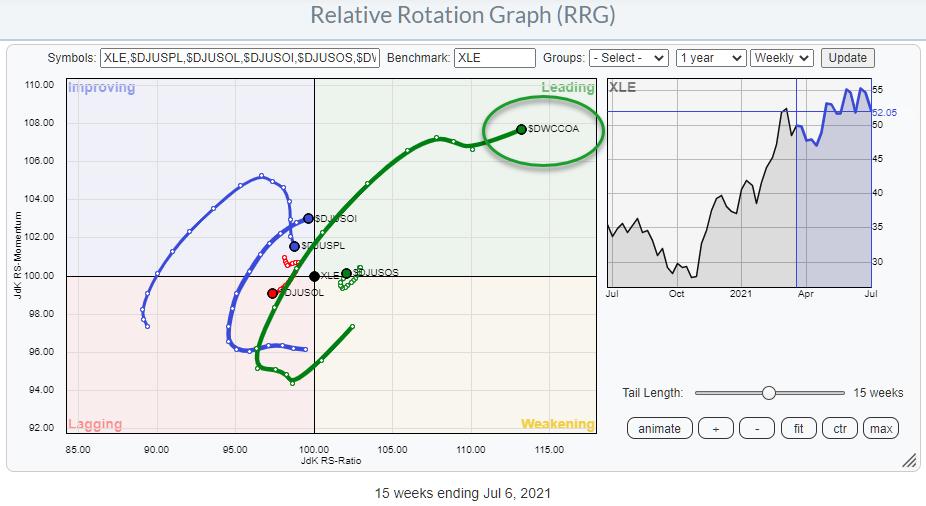
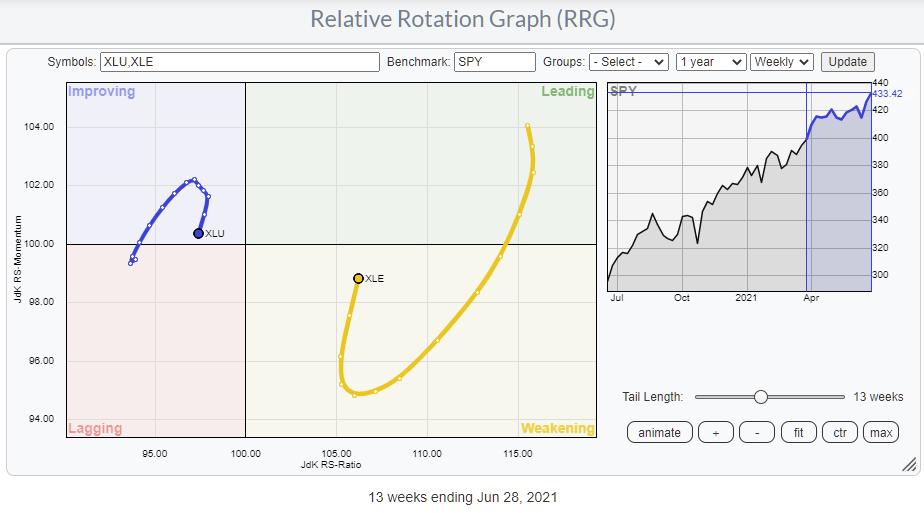
This Energy Group is Moving on the RRG

by Julius de Kempenaer,
Senior Technical Analyst, StockCharts.com
This Relative Rotation Graph shows the industries that make up the Energy sector. One tail that especially stands out is for $DWCCOA. I have looked at this RRG, and the sector before, but always excluded Coal as none of the stocks in that index are in the S&P....
READ MORE
MEMBERS ONLY
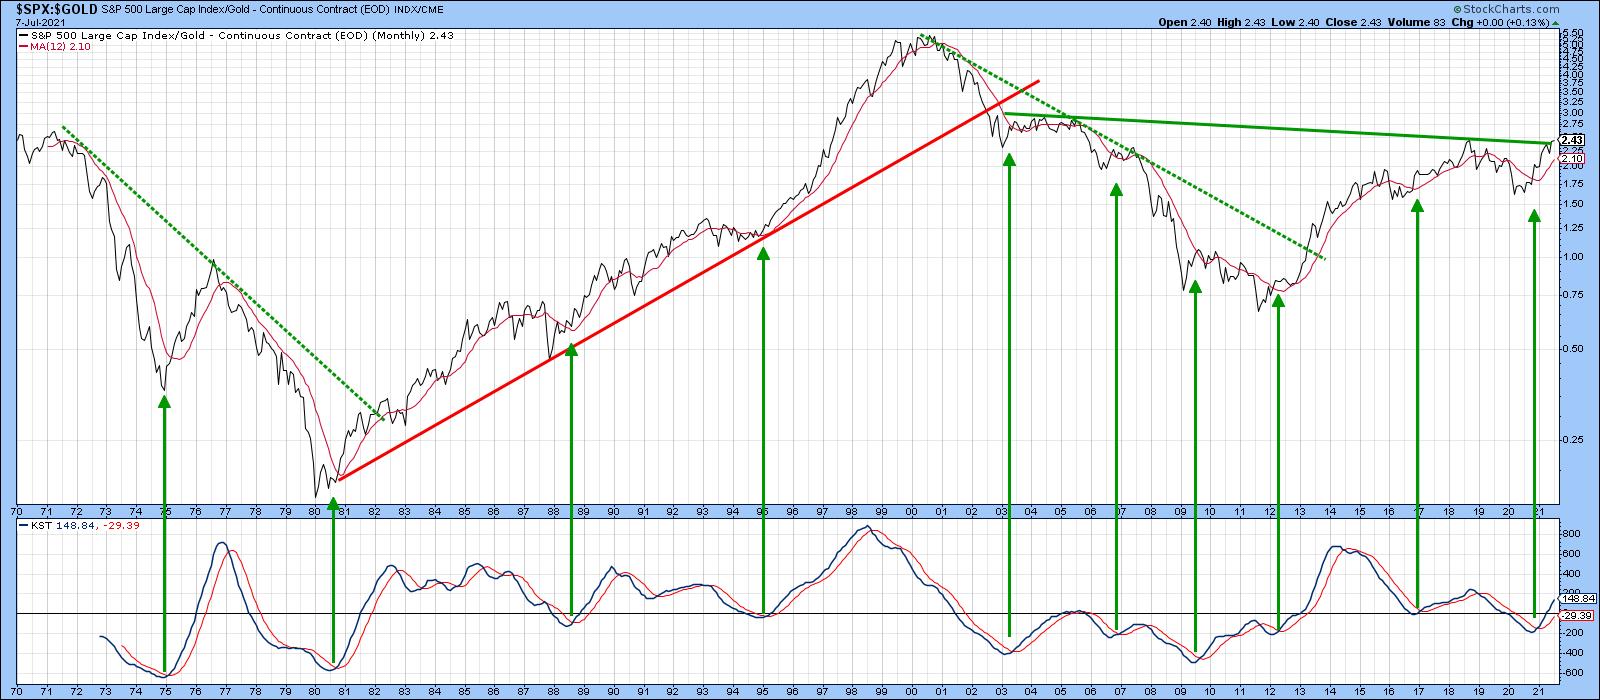
Three Intermarket Relationships That are at a Critical Point

by Martin Pring,
President, Pring Research
When reviewing my charts last weekend, several jumped out as being at a pretty critical juncture, and therefore worthy of monitoring going forward. A couple of them involved the stock market, so I'll start there.
Two Stock Market Relationships
I have always been fascinated by the relationship between...
READ MORE
MEMBERS ONLY

Practical Ways to Live Through Inflationary Times
Whether we head into hyperinflation, stagflation or recession, it is always good to be prepared for more of the same-rising commodity prices, low supply, high demand and a low labor force wreaking havoc on your wallet. Inflation especially hurts people on fixed incomes. Wage growth can partially offset inflation as...
READ MORE
MEMBERS ONLY
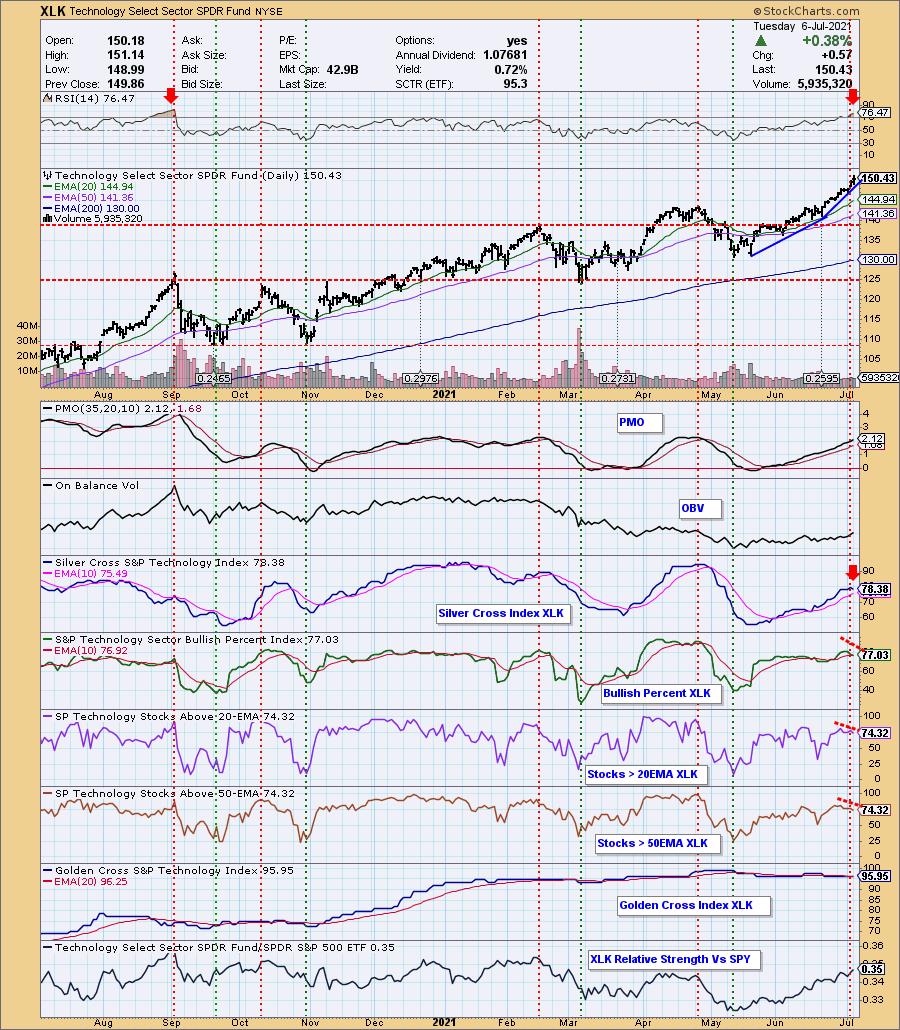
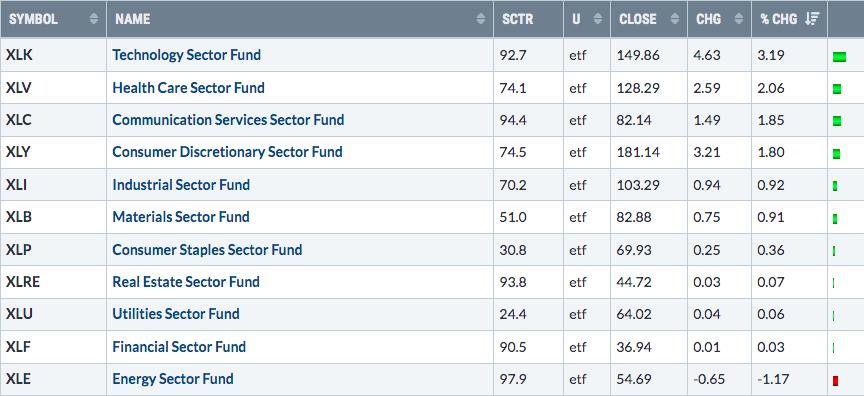
Technology Leads, But Showing Cracks in the Foundation

by Erin Swenlin,
Vice President, DecisionPoint.com
Technology (XLK) has clearly been leading the SPX higher, but it is now very overbought. The RSI has now entered shaded overbought territory. We haven't seen price this overbought since the crash at the beginning of September. In September, price was accelerating its ascent, just as it is...
READ MORE
MEMBERS ONLY

Sector Spotlight: Risk for SPX Increasing
by Julius de Kempenaer,
Senior Technical Analyst, StockCharts.com
On this edition of StockCharts TV's Sector Spotlight, I go over the completed monthly charts for June. Starting with Asset Classes, I note the stretched levels for the stock market and revives the concept of "Reversed Relative Strength" that I first introduced in a blog article...
READ MORE
MEMBERS ONLY
How to Read the Market's Mixed Signals with these 6 Key Symbols
The safest place in Tuesday's trading session was the tech sector.
The tech-heavy Nasdaq 100 (QQQ) closed a pinch up on the day, while the small-cap Russell 2000 (IWM) broke its 50-day moving average and closed -1.62% lower. Conflicting major indices does not make trading easy, as...
READ MORE
MEMBERS ONLY
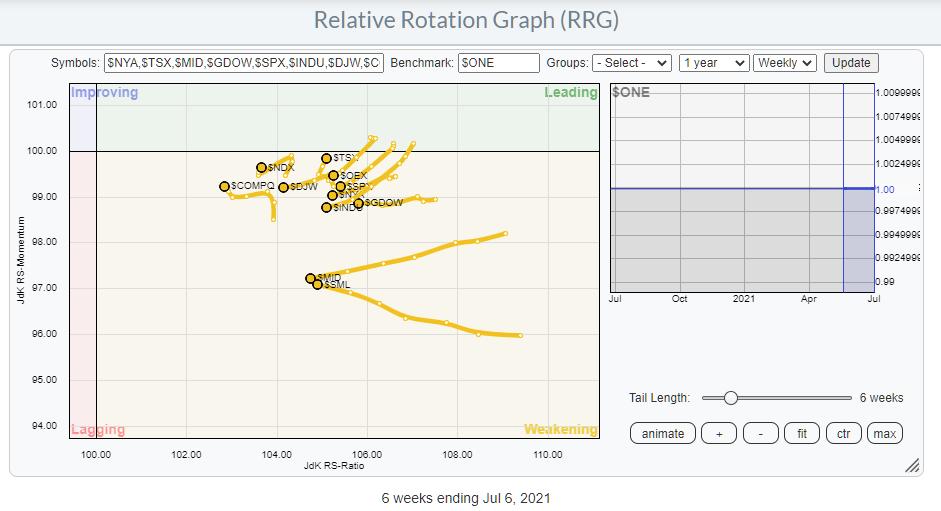
Elevated Risk for Stocks
by Julius de Kempenaer,
Senior Technical Analyst, StockCharts.com
The RRG above shows the ABSOLUTE rotations for a selection of major indexes. Instead of plotting them against a global or otherwise encompassing index, I have plotted them against $ONE to get a handle on their underlying absolute trends. What is noticeable is that they are all inside the weakening...
READ MORE
MEMBERS ONLY

Power Charting TV: Crypto Currency and the Wyckoff Method

by Bruce Fraser,
Industry-leading "Wyckoffian"
Join special guest Alessio Rutigliano for a discussion of Crypto Currencies and the Wyckoff Method. Alessio has become a foremost expert on trading Crypto. He has very effectively combined vertical bar chart analysis and horizontal Point & Figure (PnF) studies (link to the Power Charting episode is below). Alessio and...
READ MORE
MEMBERS ONLY
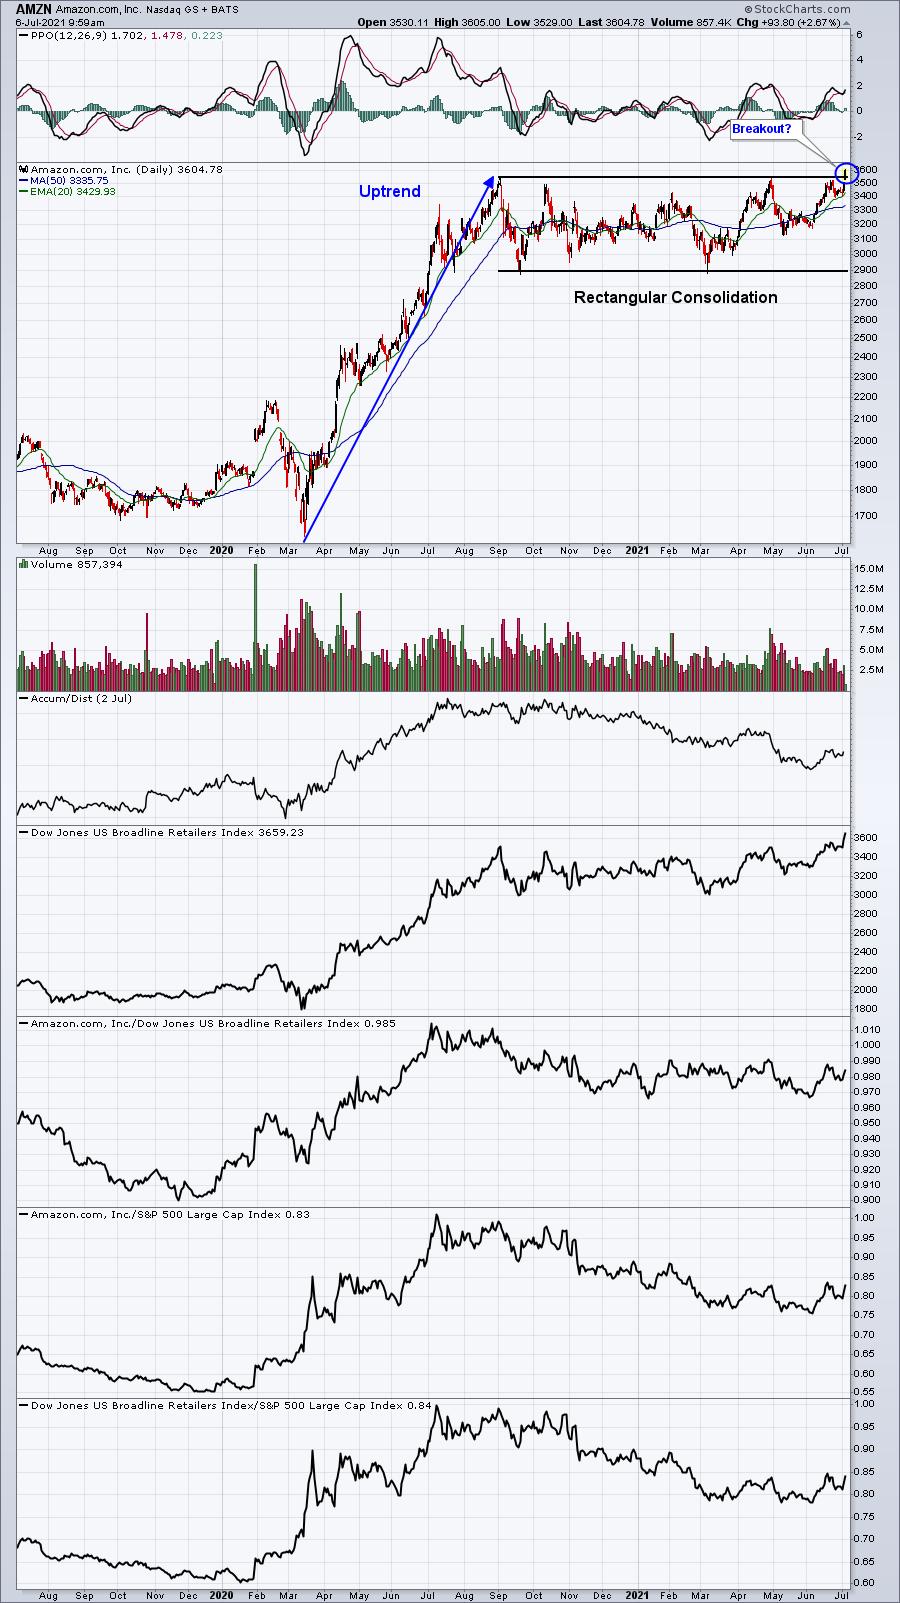
Amazon (AMZN) "Prime" for a Breakout?

by Tom Bowley,
Chief Market Strategist, EarningsBeats.com
We've been waiting a LONG time for Amazon (AMZN) to "deliver" a breakout. Well, our package may be arriving today. After setting an all-time high close in early September and testing that level in April, AMZN is soaring today to print an all-time intraday high in...
READ MORE
MEMBERS ONLY
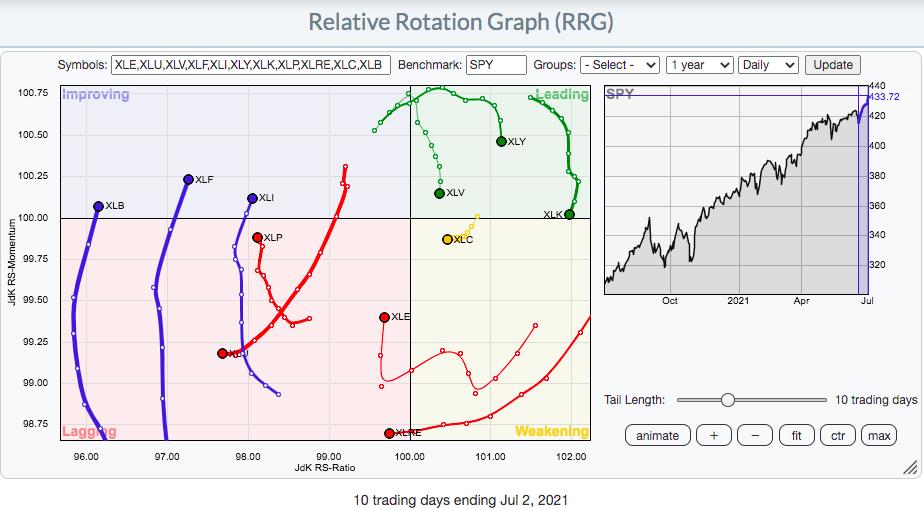
Using RRG To Zero In On Opportunities Quickly
by Tom Bowley,
Chief Market Strategist, EarningsBeats.com
RRG (Relative Rotation Graphs) can quickly point us in the direction of leadership. Let me show you how. First, let's look at a daily RRG to see which sectors are strengthening and which are weakening:
I used a "tail length" of 10 days so we can...
READ MORE
MEMBERS ONLY
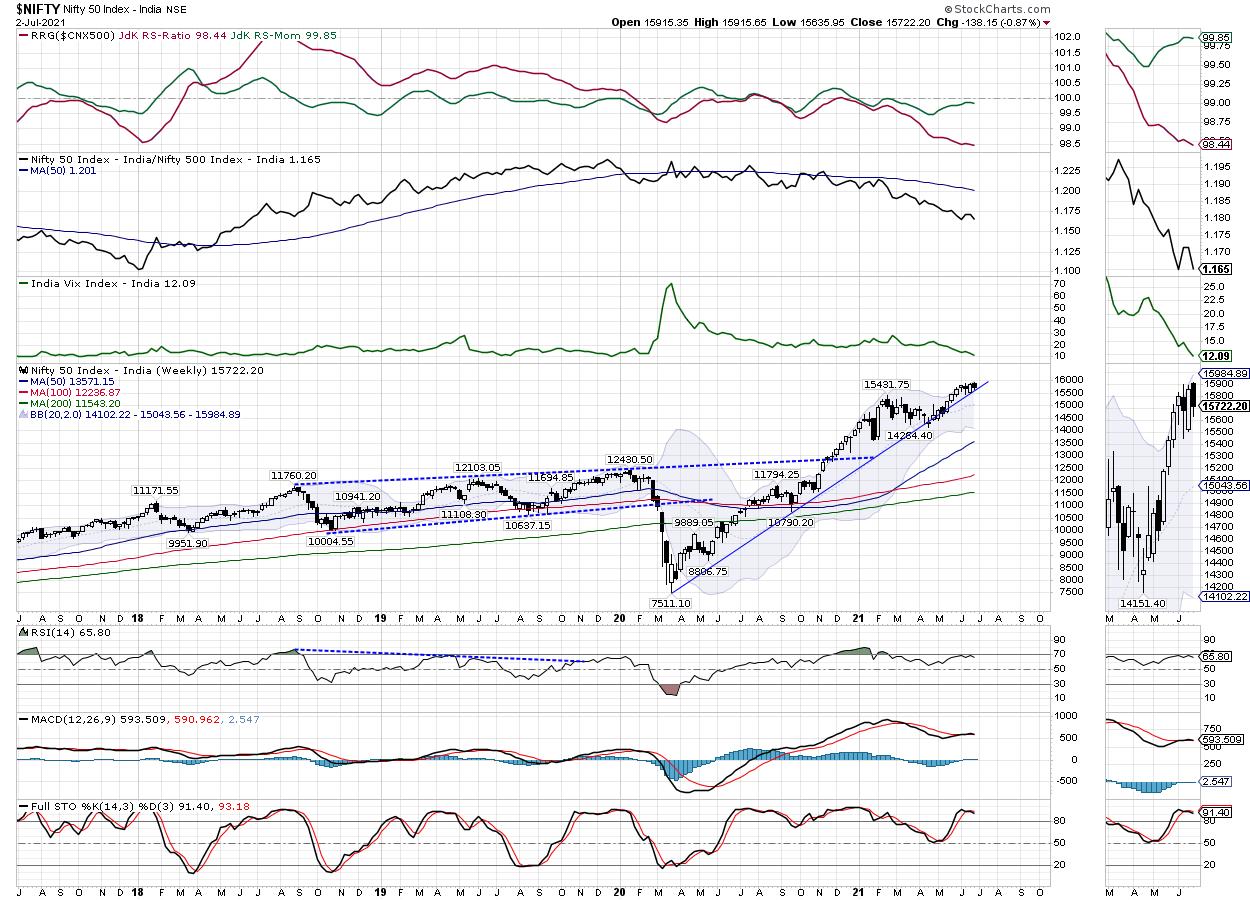
Week Ahead: NIFTY Stares at Crucial Support as it Rests on Major Pattern Support; RRG Chart Shows Mixed Sector Setup

by Milan Vaishnav,
Founder and Technical Analyst, EquityResearch.asia and ChartWizard.ae
Following a buoyant performance in the week before this one, the Indian equities had a quiet show over the past five days. The trading range throughout the previous week was narrower and rested itself on key support. The NIFTY approached its lifetime high point and retraced from that level to...
READ MORE
MEMBERS ONLY
Is This Pre-Earnings Advance Sustainable?
by Tom Bowley,
Chief Market Strategist, EarningsBeats.com
U.S. equities are doing what U.S equities normally do. They're rising as we approach earnings season. I wrote a ChartWatchers article recently, "Wall Street Doesn't Want You To See These S&P 500 Performance Numbers", summarizing the typical pre-earnings outperformance. Be...
READ MORE
MEMBERS ONLY
The Holiday Weekend Comes With Risks - Here's What You Need To Know

by Mary Ellen McGonagle,
President, MEM Investment Research
The S&P 500 and the Nasdaq Composite both closed the week in new high ground as inflation fears continue to recede. Outside of the markets however, there's an increasing concern going into this long weekend, as health experts are eyeing an increase in the spread of...
READ MORE
MEMBERS ONLY
How to Determine Which Companies Will Report Blowout Results
by Tom Bowley,
Chief Market Strategist, EarningsBeats.com
I view relative strength as one of the most important aspects of technical analysis. It helps me visualize where the money is going. When you review a price chart, it's very easy to see if a stock is going up or going down. As an example, let'...
READ MORE
MEMBERS ONLY
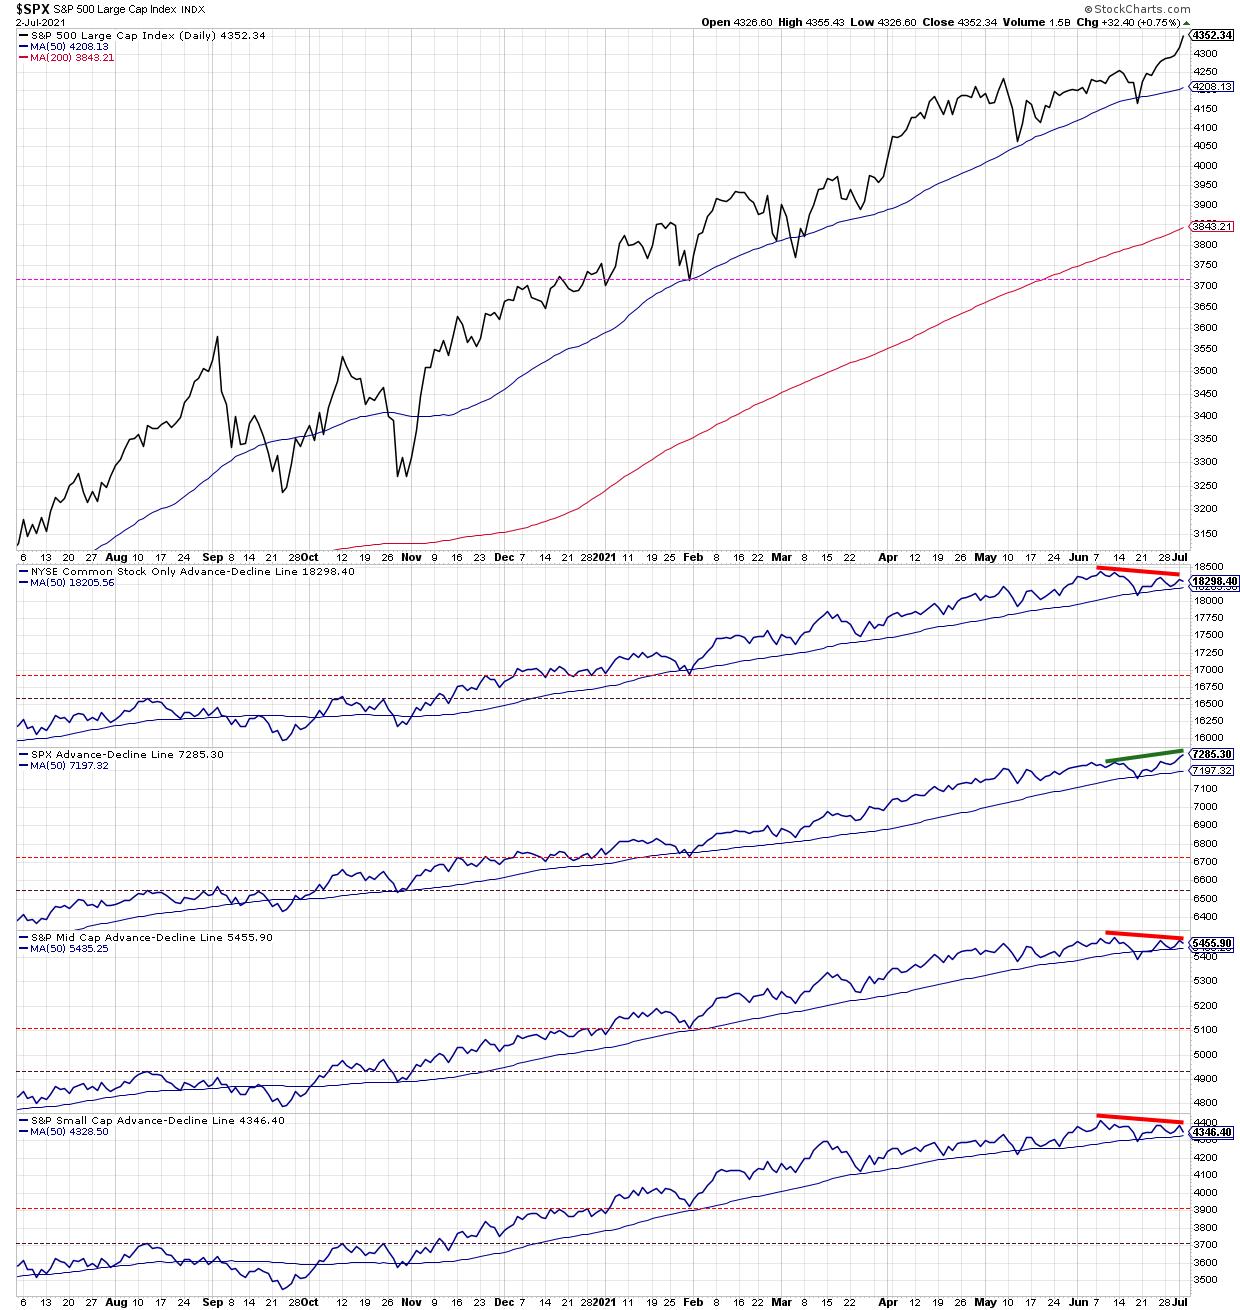
A Market with Bad Breadth is Still Going Up

by David Keller,
President and Chief Strategist, Sierra Alpha Research
The S&P 500 is going higher. If you knew nothing else about the current market environment, you would consider that to be a bullish indication. As Paul Montgomery once said, "The most bullish thing the market can do is go up."
But if you look underneath...
READ MORE
MEMBERS ONLY

Don't Miss the Move into These New Areas!
by Mary Ellen McGonagle,
President, MEM Investment Research
This week on StockCharts TV'sThe MEM Edge, recent developments have pushed several lagging areas back into leadership positions. Mary Ellen reviews this rotation while highlighting top stocks to take advantage. She also points out weaker areas to stay away from!
This video was originally broadcast on July 2nd,...
READ MORE
MEMBERS ONLY
Energy vs. Utilities: 2 Sectors, 8 Groups, 28 Stocks
by Julius de Kempenaer,
Senior Technical Analyst, StockCharts.com
On the Sector RRG, the tails for Energy and Utilities stand out. The Utilities sector is positioned inside the improving quadrant, but started rolling over a few weeks ago and is now heading towards the lagging quadrant again. On the opposite side, Energy is inside the weakening quadrant, but is...
READ MORE
MEMBERS ONLY
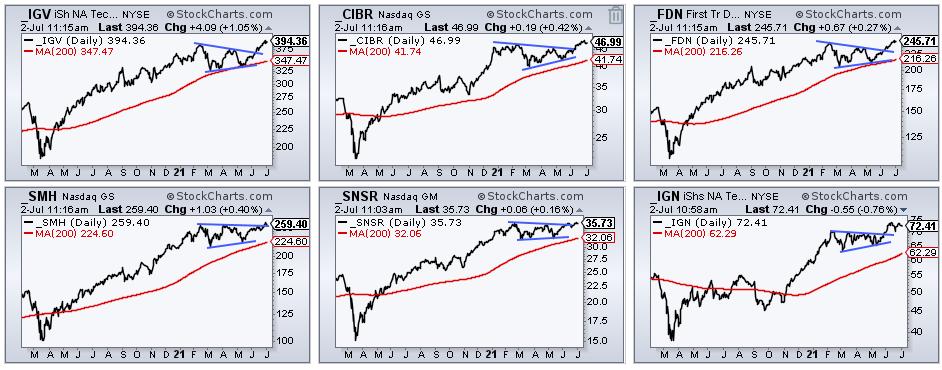
Big Triangle Breakouts in Key Tech ETFs - How to Trade a Pullback

by Arthur Hill,
Chief Technical Strategist, TrendInvestorPro.com
After leading the market into February 2020, tech-related ETFs were hit with strong selling pressure into March and extended their corrections into May. Large triangles formed in several and they broke out of these bullish continuation patterns with strong move the last seven weeks. A triangle within an uptrend represents...
READ MORE
MEMBERS ONLY

2021 Q1 Earnings Results: Still Massively Overvalued and Who Cares?

by Carl Swenlin,
President and Founder, DecisionPoint.com
The normal P/E range for the S&P 500 is 10 (undervalued) to 20 (overvalued), but the P/E spike in 2009 nearly pushed that range into oblivion. The current P/E of 33.85 is the third highest in history, but it is the highest ever reached...
READ MORE
MEMBERS ONLY

APPLE MAY BE BREAKING OUT -- TECH SECTOR CONTINUES TO LEAD

by John Murphy,
Chief Technical Analyst, StockCharts.com
TECH SECTOR SHOWS RELATIVE STRENGTH... Stocks are trading higher again today on the back of a stronger than expected jobs report. Eight of eleven market sectors are rising with technology in the lead. Relative strength by the tech sector is something we've been seeing a lot of lately....
READ MORE
MEMBERS ONLY
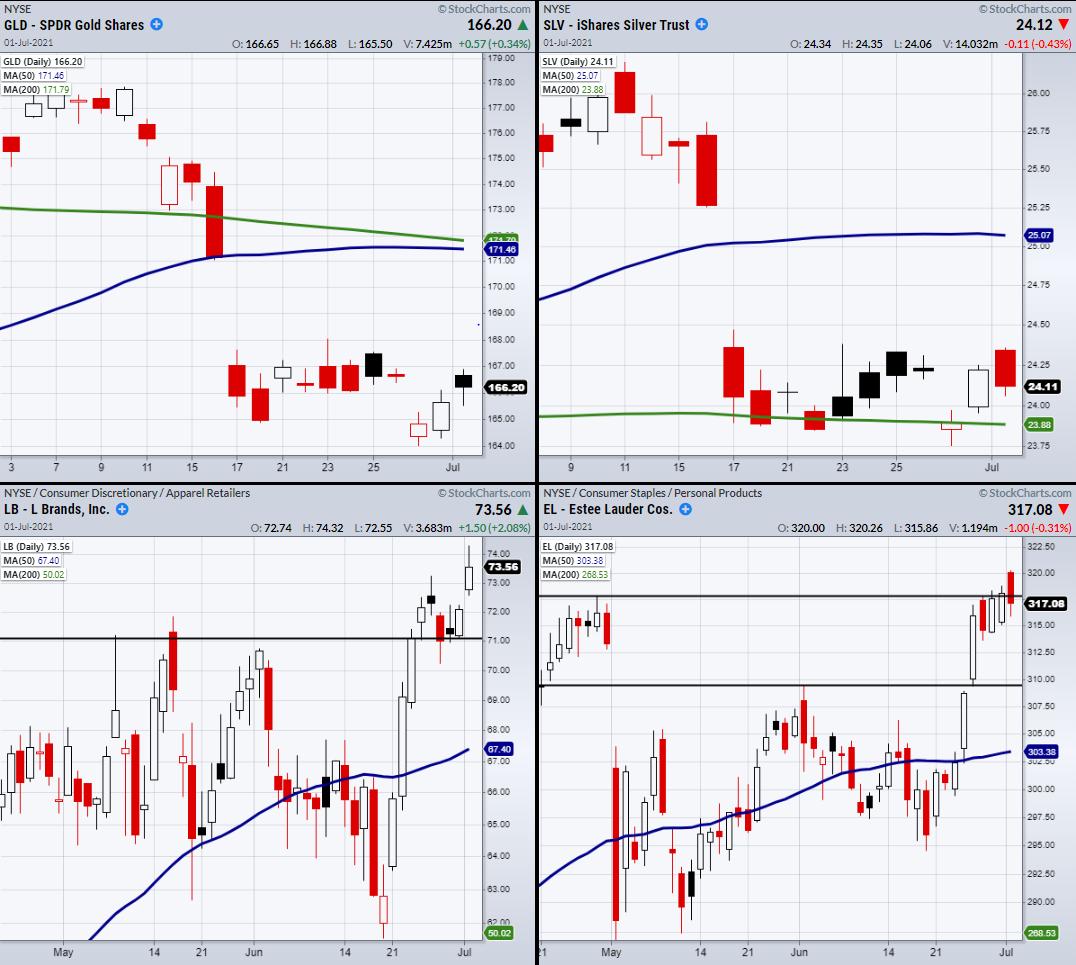
How to Profit in the Market Amidst Rising Consumer Prices
General Mills (GIS) recently stated they would have to increase prices on many staple products. This relates to recent price surges in fuel, packaging and shipping costs, which has put a strain on not only food supply companies, but many small and large companies throughout the pandemic.
With the markets&...
READ MORE
MEMBERS ONLY
How I Use Moving Averages
by Joe Rabil,
President, Rabil Stock Research
In this week's edition of Stock Talk with Joe Rabil, Joe discusses how moving averages can be a useful tool to help define price structure, longevity of the trend, and momentum. He then analyzes 16 stock picks sent in by viewers, including AMAT, NVDA, TGT and more.
This...
READ MORE
MEMBERS ONLY

What Does a Flattening Yield Curve Mean for Bonds, the Economy and Stocks
by Martin Pring,
President, Pring Research
In the last couple of weeks or so, US treasury yield curves have begun to flatten. That may sound unduly technical and boring, but it has implications for bonds stocks and the economy. I'll get to the investment implications later, but for now I'll quickly through...
READ MORE
MEMBERS ONLY
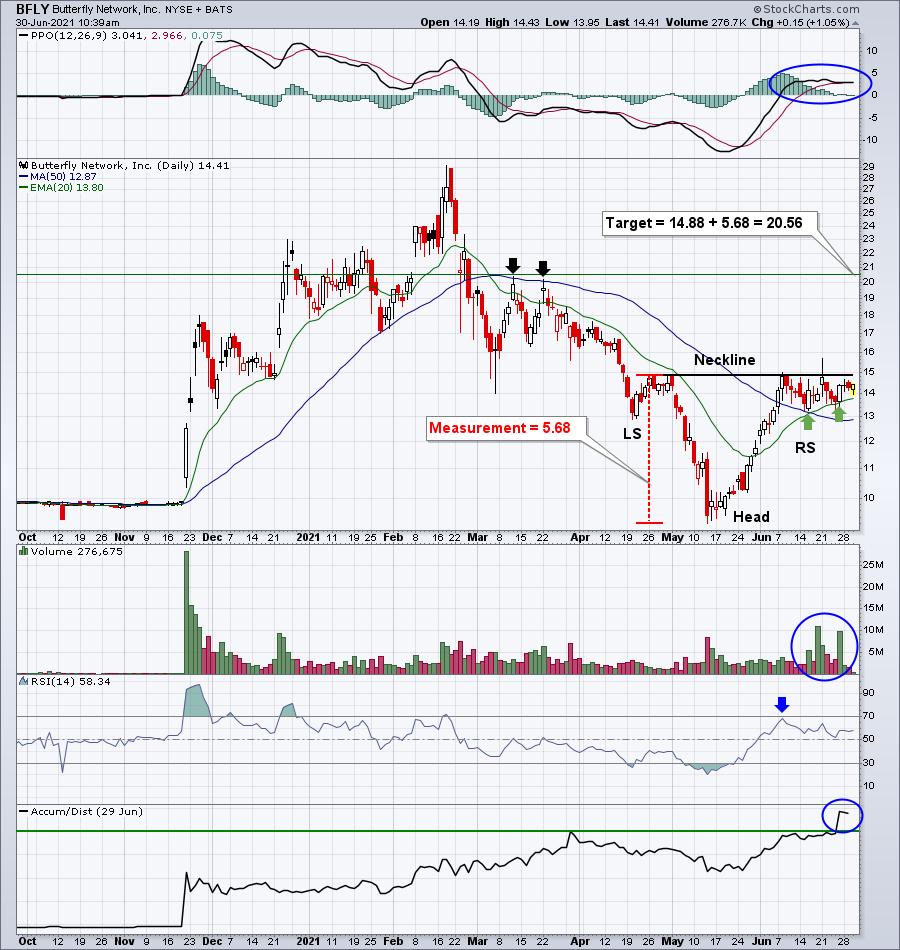
This Bottoming Head & Shoulders Pattern Is Set To Explode!
by Tom Bowley,
Chief Market Strategist, EarningsBeats.com
I'm a big believer in patterns. I follow continuation patterns primarily, because I'm a momentum trader. So as stocks consolidate, I try to identify the pattern that shapes in order to gain insight into a possible measurement. That's what technical patterns offer - measurements/...
READ MORE
MEMBERS ONLY
Sector Spotlight: Will Seasonality Save SPX?
by Julius de Kempenaer,
Senior Technical Analyst, StockCharts.com
On this edition of StockCharts TV's Sector Spotlight, as per usual on the last Tuesday of the month, I dive into seasonality for sectors. This time, I present a sneak preview of some work that expands on the 3D visualizations that I usually use for this segment. At...
READ MORE
MEMBERS ONLY

Is the Crypto Space Heating Up?
Tuesday's market action has been sluggish at best. Of the four major indices, the Nasdaq 100 (QQQ) made the largest gain, ending +0.45% on the day. Tuesday's average daily volume in the QQQs also took a hit, with 27,800,000 shares traded compared to...
READ MORE
MEMBERS ONLY

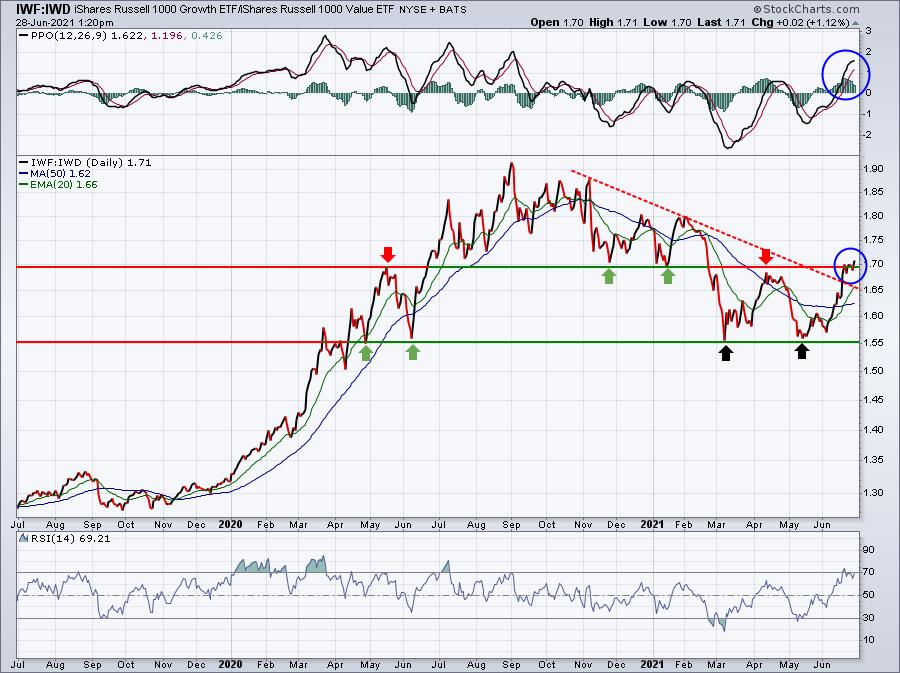
Growth / Value... A (Fake) Break?
by Julius de Kempenaer,
Senior Technical Analyst, StockCharts.com
The Relative Rotation Graph above shows growth vs. value stocks rotations over the last six months (two quarters). After the initial cross into the leading/lagging quadrant, the relationship almost immediately started to move back in favor of Growth. Until both tails hooked in the week of 22 Feb, from...
READ MORE
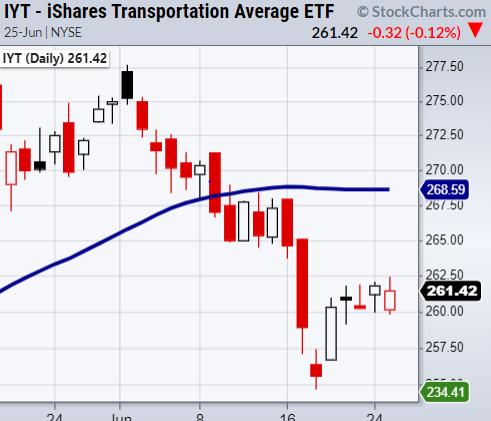
MEMBERS ONLY
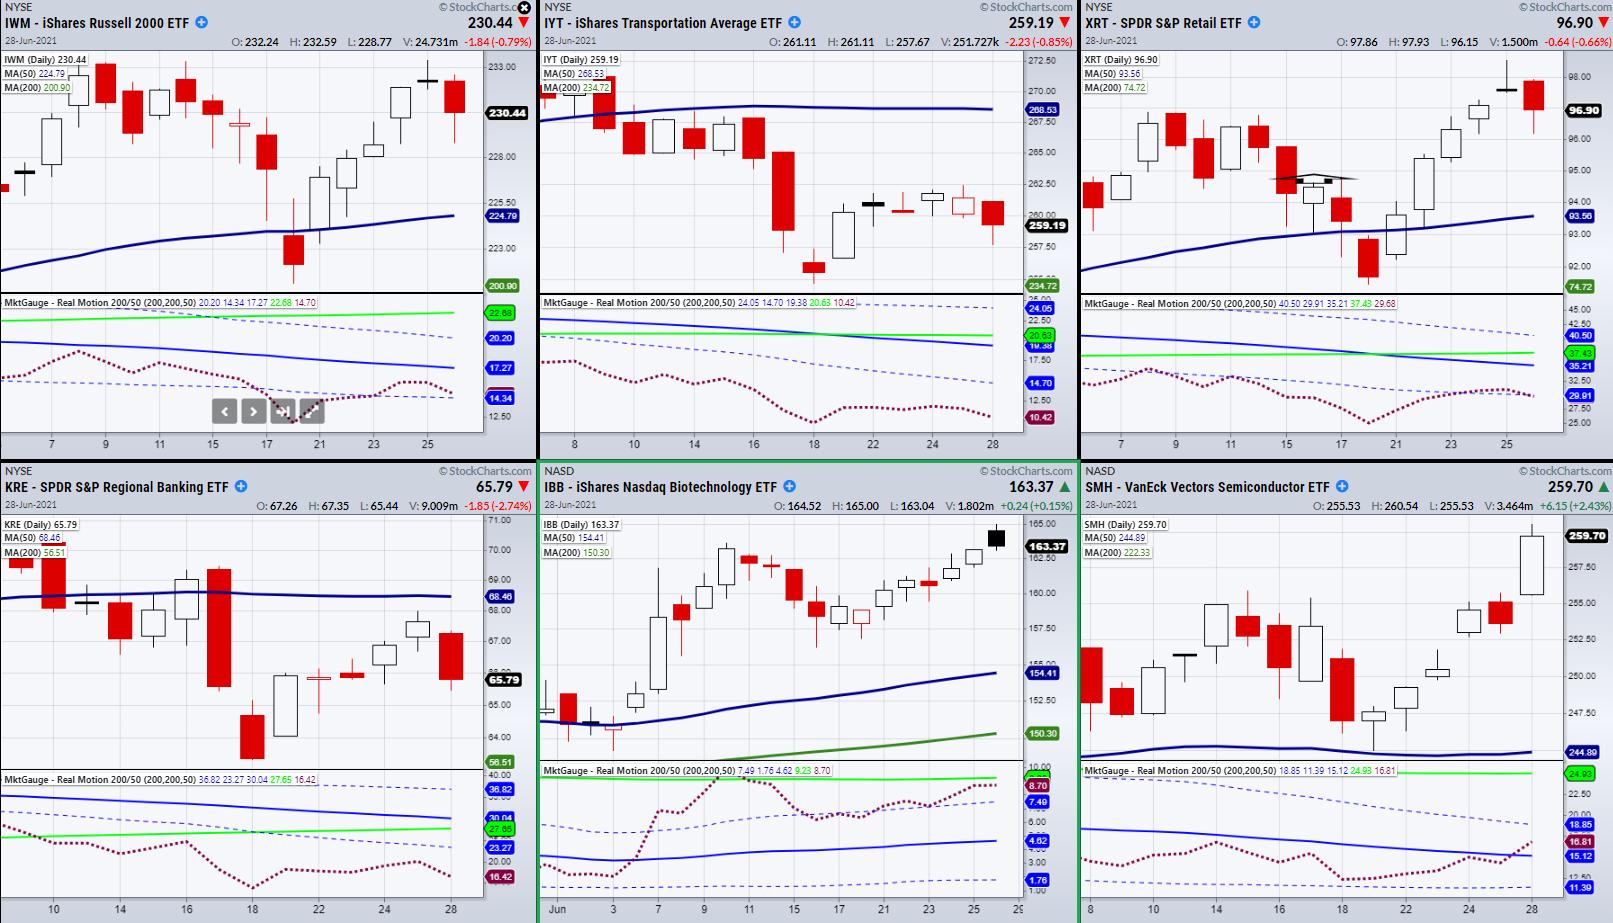
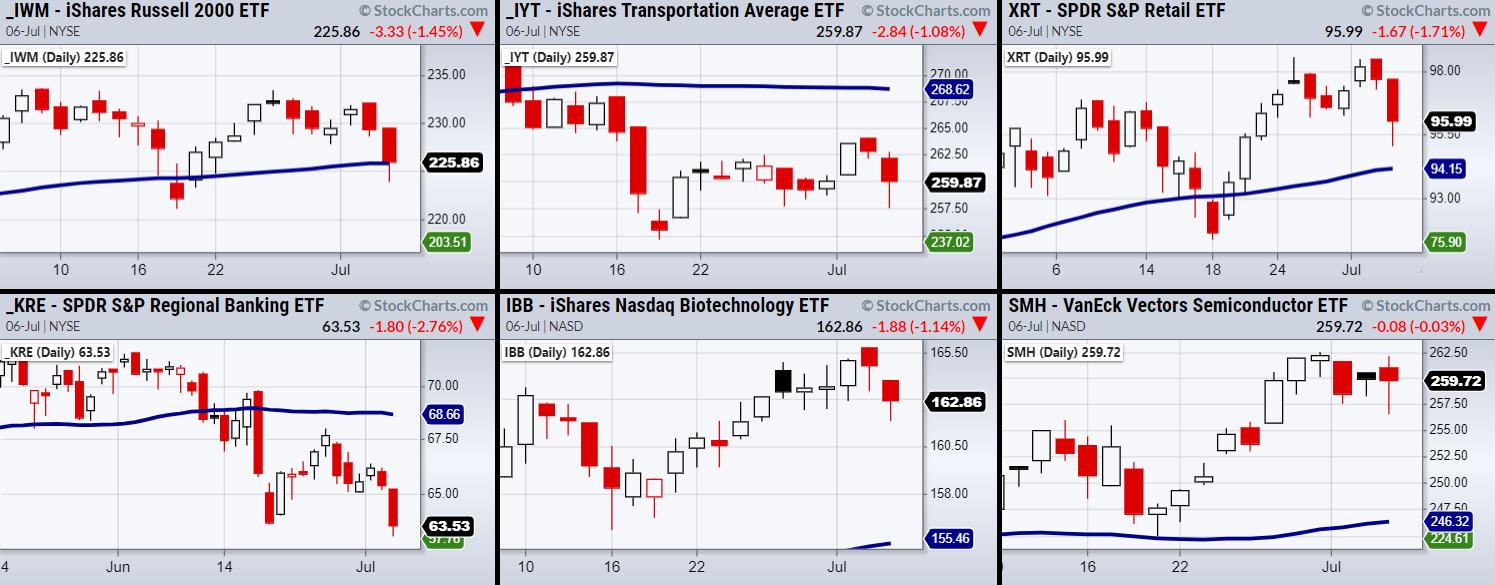
Can Big Tech Lead the Stock Market Higher?
According to Mish's Economic Modern Family, the market remains mostly bullish, with only the transportation sector (IYT) and regional banking (KRE) sitting in cautionary phases under their 50-day moving average. However, most of the Modern Family closed lower or flat on the day, while the semiconductors ETF (SMH)...
READ MORE
MEMBERS ONLY

Interesting Price Pattern Develops on This General Insurance Stock
by Milan Vaishnav,
Founder and Technical Analyst, EquityResearch.asia and ChartWizard.ae
ICICI Lombard General Insurance Company Ltd -- ICICIGI.IN
The most recent price action in ICICIGI shows that it is likely to move past its multi-point resistance zone, existing between 1540-1560 levels. The stock has seen a broad range consolidation and the formation of higher bottoms after it took support...
READ MORE
MEMBERS ONLY

Week Ahead: NIFTY at New High But Weak Internal Strength; RRG Chart Shows Risk-on Setup in Place
by Milan Vaishnav,
Founder and Technical Analyst, EquityResearch.asia and ChartWizard.ae
The stock markets once again had a buoyant week as the Indian Headline Index NIFTY50 closed at a fresh lifetime high. The Indian market had four consecutive weeks of gains, piling up over 1121 points and taking a breather after that. However, after pausing its up move for just one...
READ MORE
MEMBERS ONLY
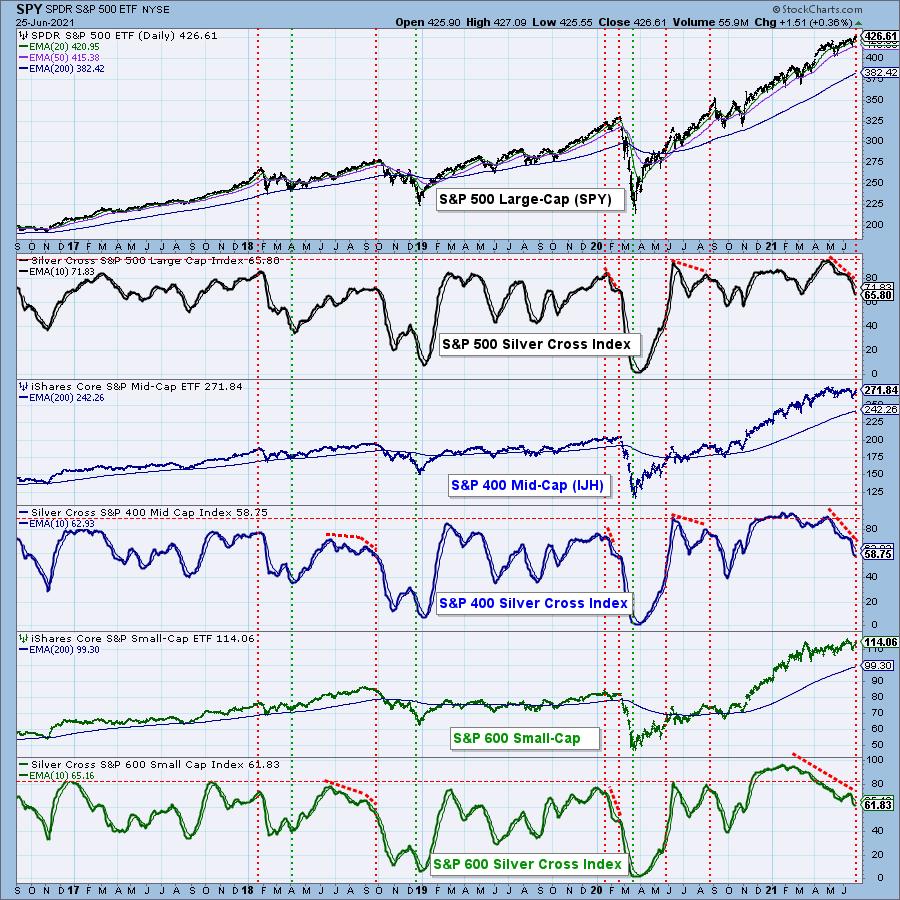
Fading Participation is Still a Huge Problem
by Erin Swenlin,
Vice President, DecisionPoint.com
by Carl Swenlin,
President and Founder, DecisionPoint.com
(This is an excerpt from today's DecisionPoint Weekly Wrap)
When the 20-EMA crosses up through the 50-EMA, we consider that to be an intermediate-term BUY signal (a "silver cross") and track the percentage of stocks with BUY signals in a given market index with the Silver...
READ MORE
MEMBERS ONLY
Has the Infrastructure Bill Stolen the Inflation Spotlight?
The stock market steadied itself, as the major indices clear or head to new highs. Additionally, the media has slowed its aggressive inflation stance and looks to be shifting into the next trend, as the new infrastructure bill that has recently emerged from bipartisan talks adds a chunk of areas...
READ MORE
MEMBERS ONLY
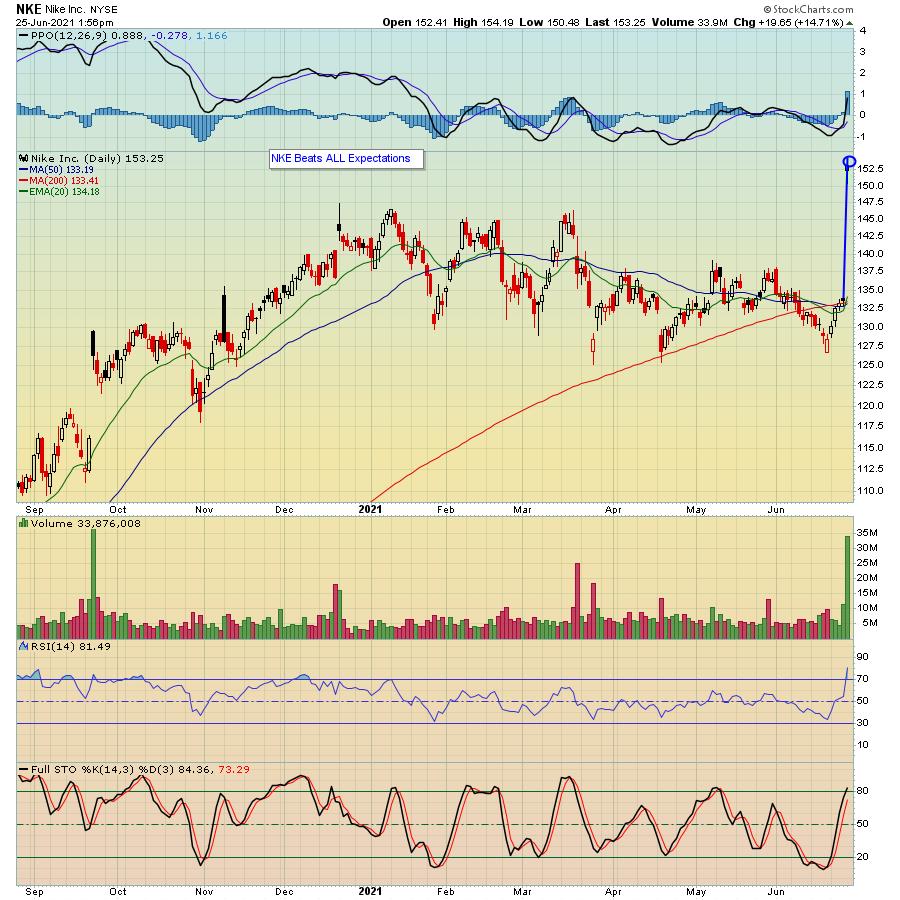
Are Nike's Earnings Results a Precursor of What is About to Come?

by John Hopkins,
President and Co-founder, EarningsBeats.com
Nike (NKE) reported blowout earnings Thursday after the bell and the market liked what it heard and saw, with the stock rising by 15% when it opened for trading on Friday. The company smashed all expectations and even guided higher, a combo that launched it to an all-time high.
Of...
READ MORE
MEMBERS ONLY

NASDAQ and S&P at a New High, But It's Very Lonely Up There
by Martin Pring,
President, Pring Research
This week saw the NASDAQ and S&P Composites rally to a new high, but not the DJIA, NYSE Composite, Unweighted S&P and Russell 2000. That's not necessarily the kiss of death, as these discrepancies can always be cleared up over time. In any case,...
READ MORE
MEMBERS ONLY

Mind the 10-year Yield Chart, Not the Fed
by Arthur Hill,
Chief Technical Strategist, TrendInvestorPro.com
Traders interested in Treasury bonds, Treasury bond ETFs and yields would be better off ignoring Fed-speak and focusing on the charts. The bond market leads the Fed, not the other way around.
There is a battle raging for the heart and soul of the bond market. In a rare divergence,...
READ MORE
MEMBERS ONLY
Jinko Solar (JKS) Soars After Beating Estimates
by Tom Bowley,
Chief Market Strategist, EarningsBeats.com
Non-StockCharts.com Members
EarningsBeats.com members that DO NOT also have a StockCharts.com membership have asked for Excel downloads for use on platforms other than StockCharts.com. Within 24 hours, we will have all of our ChartLists available for Excel download.
Executive Market Summary
* Futures were bifurcated overnight and...
READ MORE
MEMBERS ONLY

Chartwise Women: Anatomy of a Trade
by Erin Swenlin,
Vice President, DecisionPoint.com
In this week's edition of Chartwise Women, Erin (flying solo for the day) takes you step-by-step through how to select new momentum stocks in strong sectors and industry groups. Afterwards, she explains how you can time your entry to get the most profit.
This video was originally broadcast...
READ MORE
MEMBERS ONLY
Keys to Using Multiple Time Frames
by Joe Rabil,
President, Rabil Stock Research
In this week's edition of Stock Talk with Joe Rabil, Joe spends a few minutes showing some key guidelines to using multiple time frames to help improve our selection process, timing as well as defining support and resistance. Joe then spends the balance of the time providing analysis...
READ MORE
MEMBERS ONLY

NASDAQ BREAKOUT LEADS MARKET HIGHER
by John Murphy,
Chief Technical Analyst, StockCharts.com
NASDAQ BREAKS OUT TO NEW RECORD... Stocks are having another strong day with the S&P 500 and Nasdaq indexes hitting new records. The Nasdaq breakout is especially impressive. Chart 1 shows the Nasdaq Composite Index having broken through its February/April highs to reach new record territory. In...
READ MORE
