MEMBERS ONLY

Sector Spotlight: The Tale of the Tails

by Julius de Kempenaer,
Senior Technical Analyst, StockCharts.com
It's all about tails on this edition of StockCharts TV's Sector Spotlight. After a short look at last week's rotations for asset classes and sectors, I dive into the meaning of the tails on the Relative Rotation Graphs. What do they represent? How to...
READ MORE
MEMBERS ONLY
Key Support Levels That Need to Hold
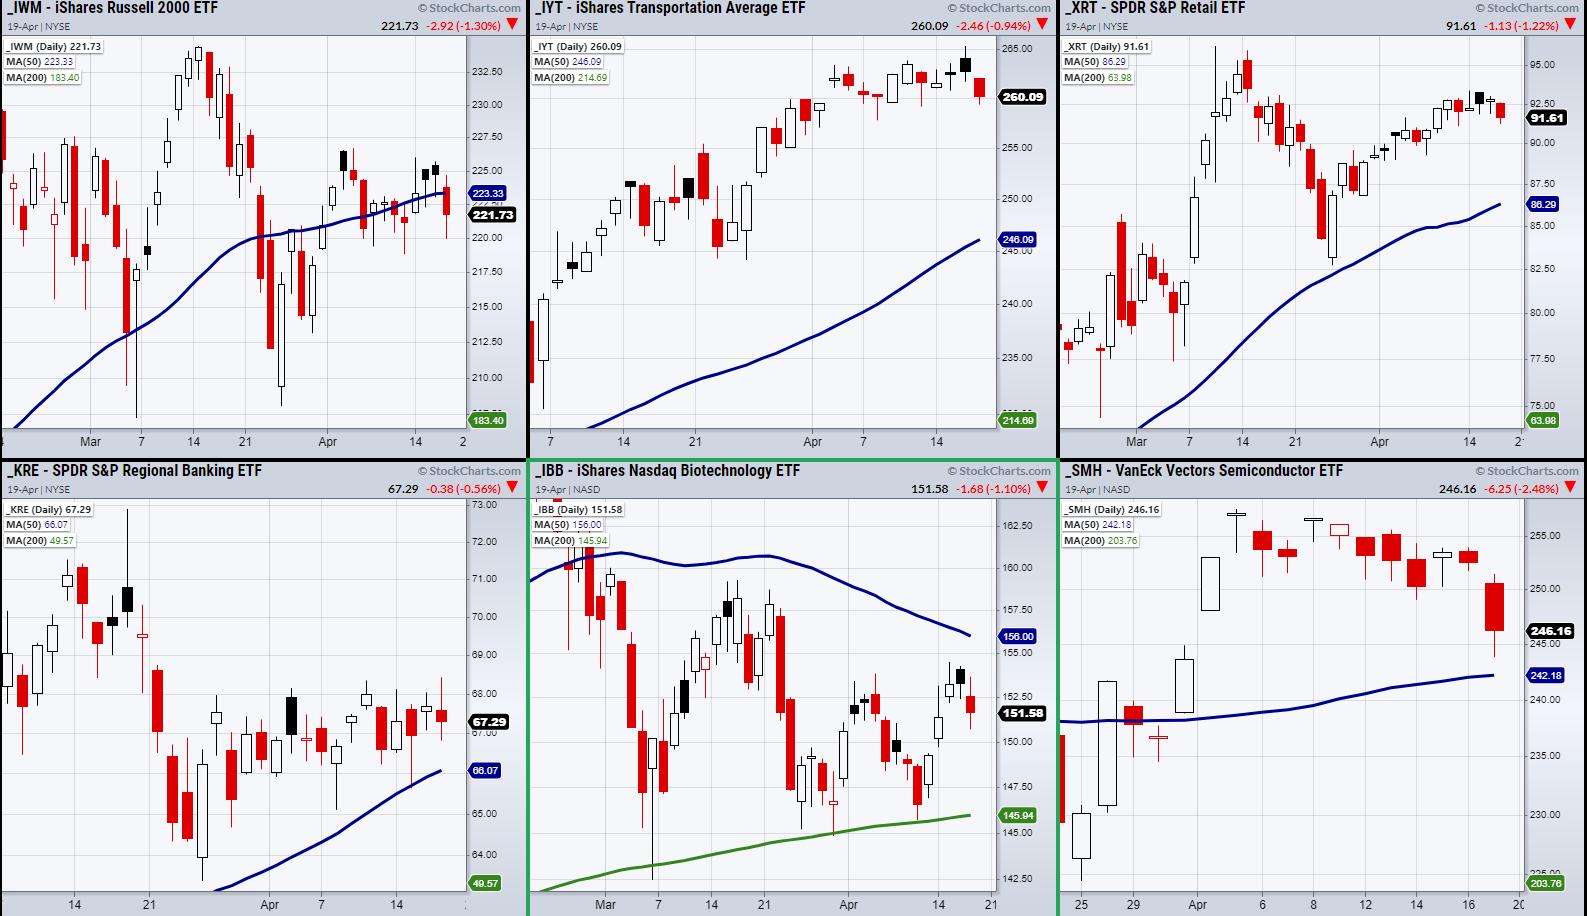
Although every member of the Economic Modern Family closed down on Monday, none broke their major support areas. Here is a quick rundown of where each member's closest support level is.
First, we have the Russell 2000 (IWM), with support from the low of its current range at...
READ MORE
MEMBERS ONLY

DP TV: Historic Money Inflows = Extreme Excesses

by Erin Swenlin,
Vice President, DecisionPoint.com

by Carl Swenlin,
President and Founder, DecisionPoint.com
In this episode of DecisionPoint, Carl opens today's show by making a sobering comparison between Stock Fund money inflows of last 5 months versus the last 12 years. Get Carl's take on current market conditions and an in-depth look at the Silver Cross Index for the...
READ MORE
MEMBERS ONLY

Choosing Frustration Over Devastation

by Greg Morris,
Veteran Technical Analyst, Investor, and Author
Trend following can offer benefits as an investing approach even when not generating positive returns. Sometimes the benefit comes from not losing, or not losing as much as other investment approaches; other times the benefit comes from allowing you to sleep more soundly at night, as selling out of equity...
READ MORE
MEMBERS ONLY
How Much Higher Can We Go? Earnings Will Provide The Answer

by Tom Bowley,
Chief Market Strategist, EarningsBeats.com
Earnings season is underway and if the first few days are any indication, we're going to see a LOT of blowout numbers. Just since Wednesday, we've seen a couple dozen companies trounce Wall Street consensus estimates. One of the best earnings reports that I've...
READ MORE
MEMBERS ONLY

Week Ahead: NIFTY Almost Violated This Major Trend Line Support; RRG Chart Shows This Sector Rolling Inside the Lagging Quadrant

by Milan Vaishnav,
Founder and Technical Analyst, EquityResearch.asia and ChartWizard.ae
Over the past four trading sessions, the Indian equities continued to relatively underperform their global peers and ended the week on a modestly negative note. The previous week was a truncated one, as Wednesday was a trading holiday. The NIFTY had a similarly wide trading range as it oscillated in...
READ MORE
MEMBERS ONLY
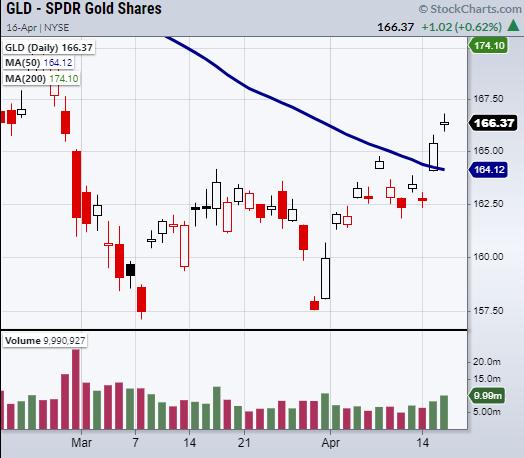
Why We Bought Gold (GLD) Before Thursday's Gap Up
Last Wednesday, Mish went live on Fox Business' Making Money with Charles Payne and gave out a very bold pick. Or, at least bold in the eyes of the general populace, as most of the media's coverage has focused on big tech and the Crypto space.
Having...
READ MORE
MEMBERS ONLY

Add-On Plays to This Hot Area!

by Mary Ellen McGonagle,
President, MEM Investment Research
In this episode of StockCharts TV'sThe MEM Edge, Mary Ellen highlights one of the biggest growth areas in the market. She also reveals other industries benefiting from this growth as well.
This video was originally recorded on April 16th, 2021. Click on the above image to watch on...
READ MORE
MEMBERS ONLY
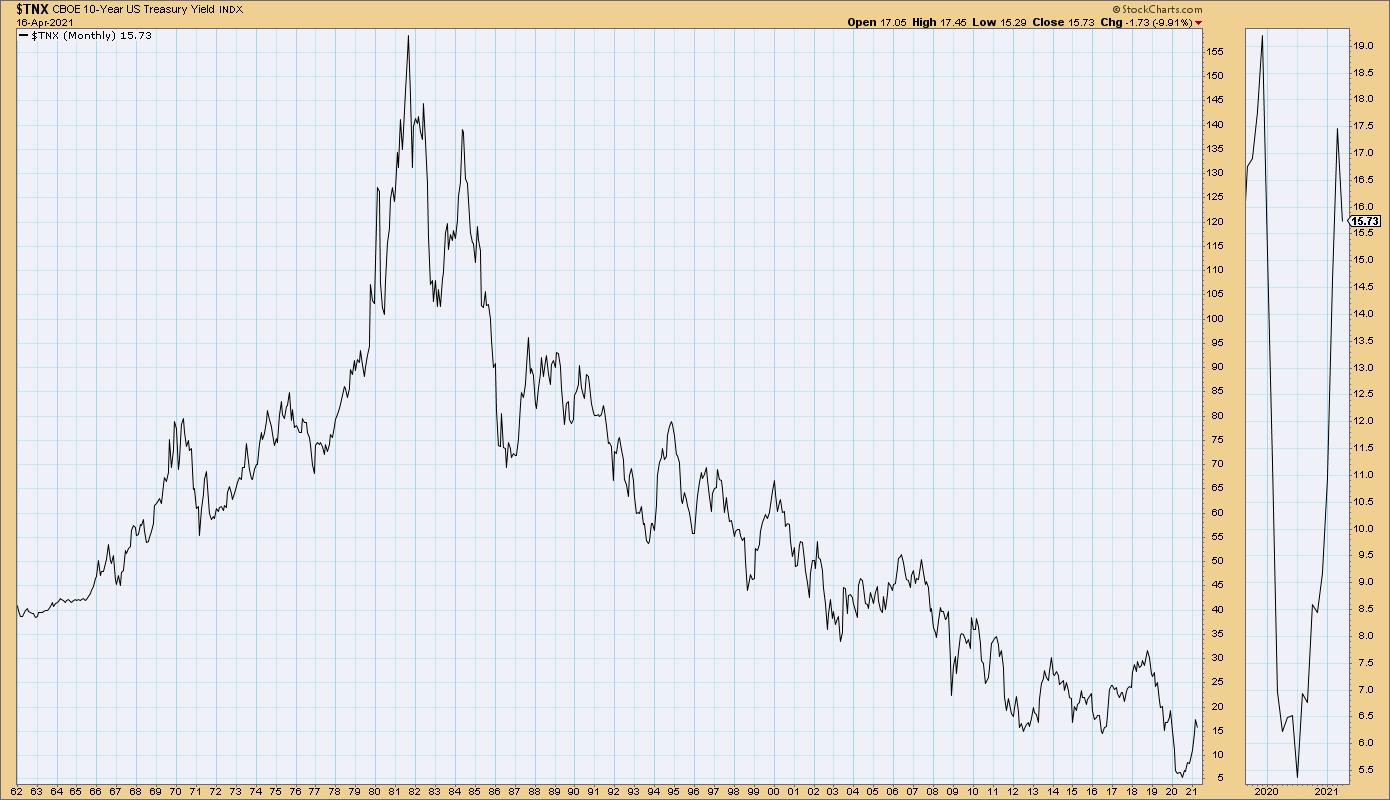
The Impact of Falling Interest Rates

by David Keller,
President and Chief Strategist, Sierra Alpha Research
Over the last six weeks, we've seen a dramatic reversal from a rising rate environment to a falling rate environment. While this rotation makes perfect sense from a technical perspective, the fact that the ten-year yield has come down in the face of strong economic data this week...
READ MORE
MEMBERS ONLY
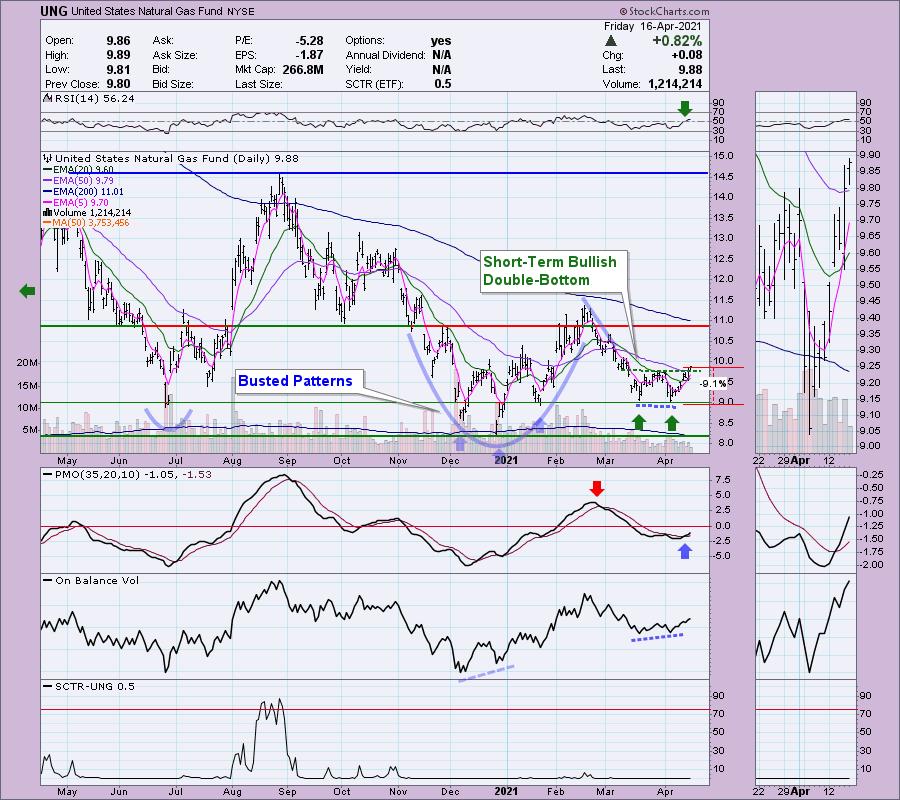
Natural Gas (UNG) Breaks Out of Bullish Double-Bottom!
by Erin Swenlin,
Vice President, DecisionPoint.com
I previously talked about Energy (XLE) being at a possible pivot point on Tuesday. It rallied strongly, leaving us with many potential choices for possible trades. Given the breakout in Crude Oil, one of the charts that I was drawn to on Wednesday was Natural Gas (UNG). Carl and I...
READ MORE
MEMBERS ONLY
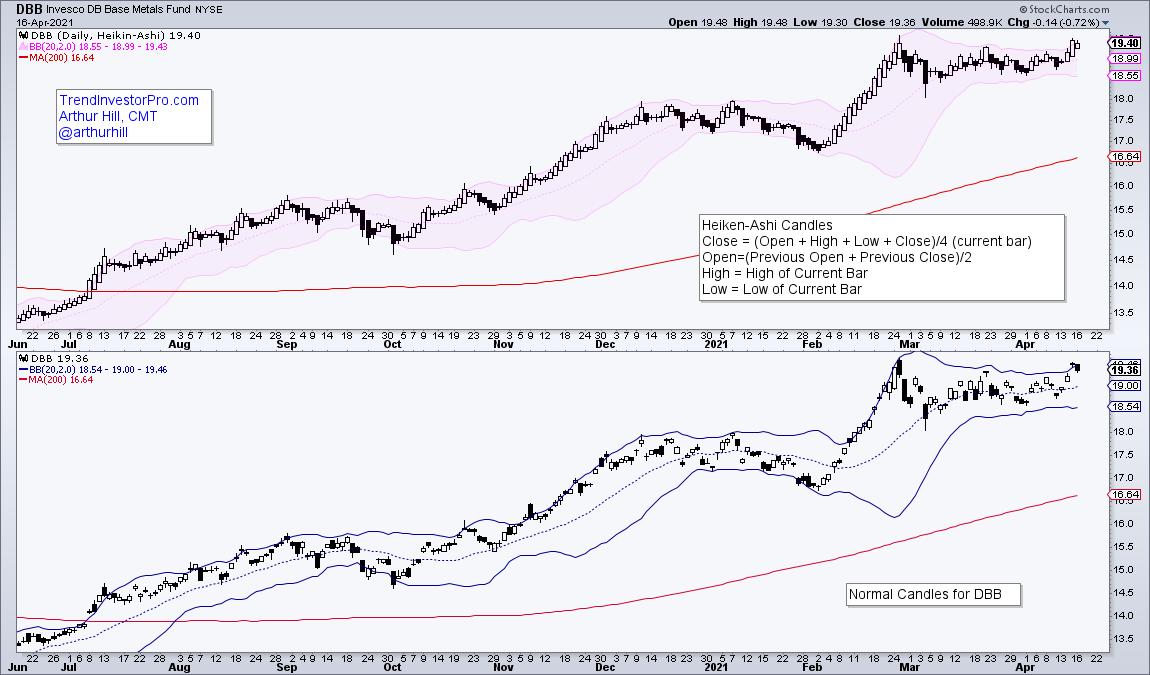
Base Metals ETF Gets the Squeeze

by Arthur Hill,
Chief Technical Strategist, TrendInvestorPro.com
The DB Base Metals ETF (DBB) is breaking out of a bullish continuation pattern after a Bollinger Band squeeze and this signals a continuation of the long-term uptrend.
The first chart shows the DB Base Metals ETF (DBB) with Heikin-Ashi candlesticks in the top window and normal candlesticks in the...
READ MORE
MEMBERS ONLY
Which ETFs Currently Provide the Best Opportunities?

by John Hopkins,
President and Co-founder, EarningsBeats.com
Some traders focus all of their time, capital and attention on individual stocks. This can be a double-edged sword. On the one hand, focusing on individual stocks can produce outsized gains. But, of course, the opposite is also true; a trade gone bad on an individual stock can be financially...
READ MORE
MEMBERS ONLY

A LOOK AT WEEKLY SECTOR RANKING SHOWS UTILITIES IN THE LEAD -- OTHER DEFENSIVE SECTORS ALSO DID WELL

by John Murphy,
Chief Technical Analyst, StockCharts.com
UTILITIES ARE WEEK'S STRONGEST SECTOR...Chart 1 ranks the week's eleven S&P 500 stock sectors and shows ten of them in the black for the week. Only Communication Services are seeing a small loss. Some other laggards include industrials, financials, and energy. What may...
READ MORE
MEMBERS ONLY

How And When You Should Talk To Your Children About Money - And Why You Should Do It NOW!

by Gatis Roze,
Author, "Tensile Trading"
A frightening statistic from American Express several years ago found that over 90% of couples consistently defer ever talking about money matters with themselves and their kids. They come up with any manner of reasons not to discuss what is crucial to their lives and their futures. My belief is...
READ MORE
MEMBERS ONLY
Chartwise Women: Energized Stocks, Strong Sectors!
by Mary Ellen McGonagle,
President, MEM Investment Research
by Erin Swenlin,
Vice President, DecisionPoint.com
In this week's edition of Chartwise Women, Erin and Mary Ellen talk about the concept of "participation" within a sector - finding the sectors where the industries and stocks within are participating. The pair share their favorite sectors and industry groups to locate the stocks that...
READ MORE
MEMBERS ONLY
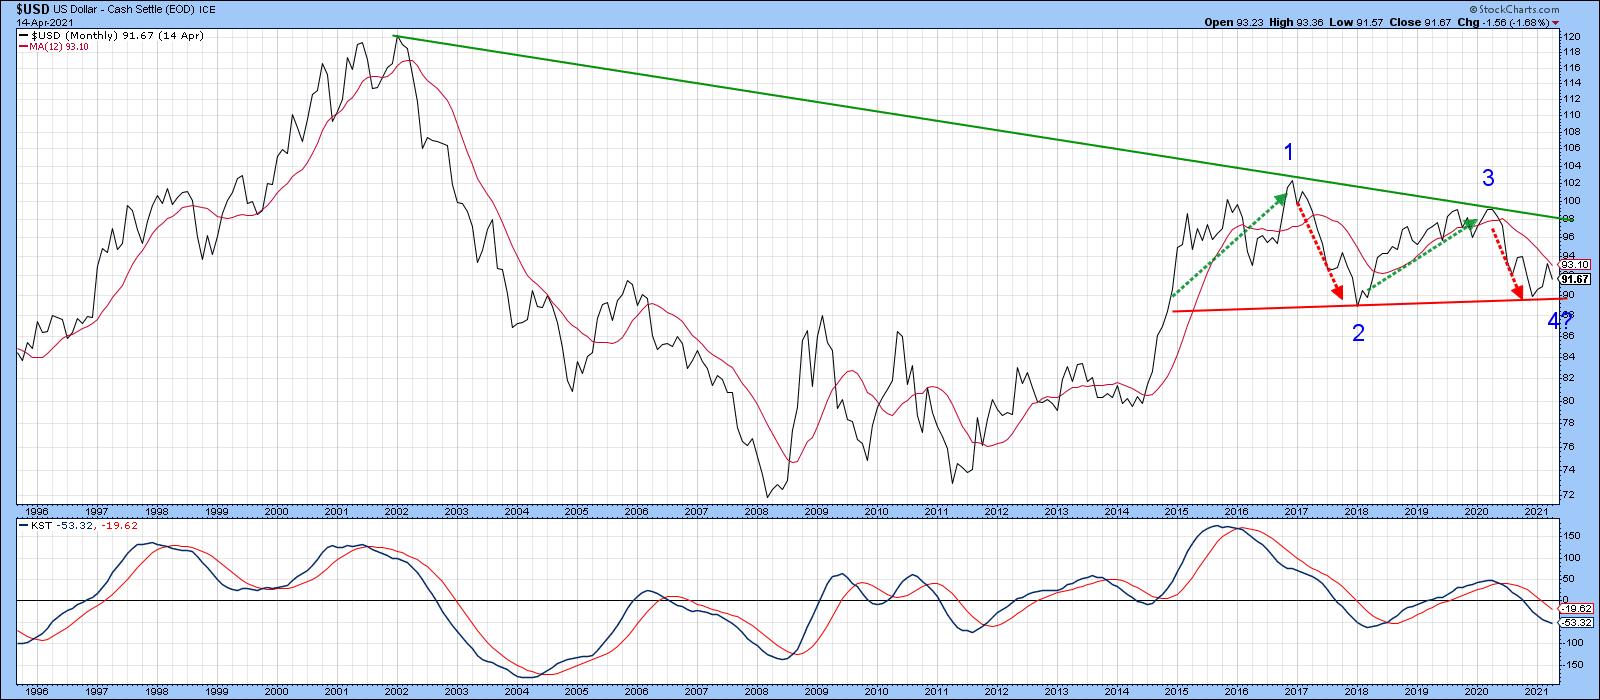
Dollar Hits a Crucial Fork in the Road

by Martin Pring,
President, Pring Research
The Dollar Index has been rangebound since 2015. During that period, it has experienced two mini bull and bear markets, as flagged by the dashed arrows in Chart 1. The latest bear has been in force for just over a year, as signaled by the Index trading below its 12-month...
READ MORE
MEMBERS ONLY
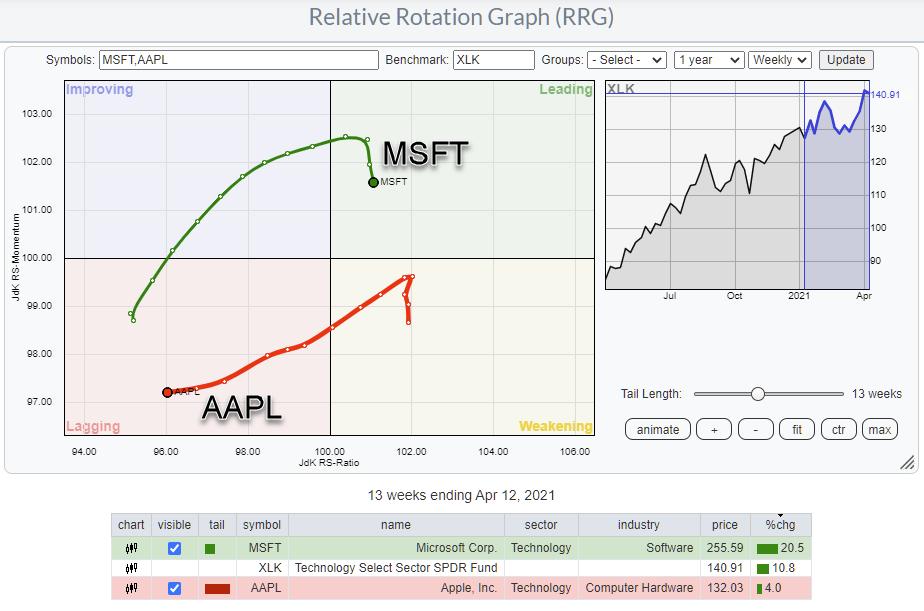
Can XLK hold without participation of AAPL & MSFT?
by Julius de Kempenaer,
Senior Technical Analyst, StockCharts.com
Developments in the technology sector keep me busy, but above all alert.
First of all it's the biggest sector in the S&P 500 and therefore by default an important one to watch. Primarily because you need a lot of power to push the S&P...
READ MORE
MEMBERS ONLY
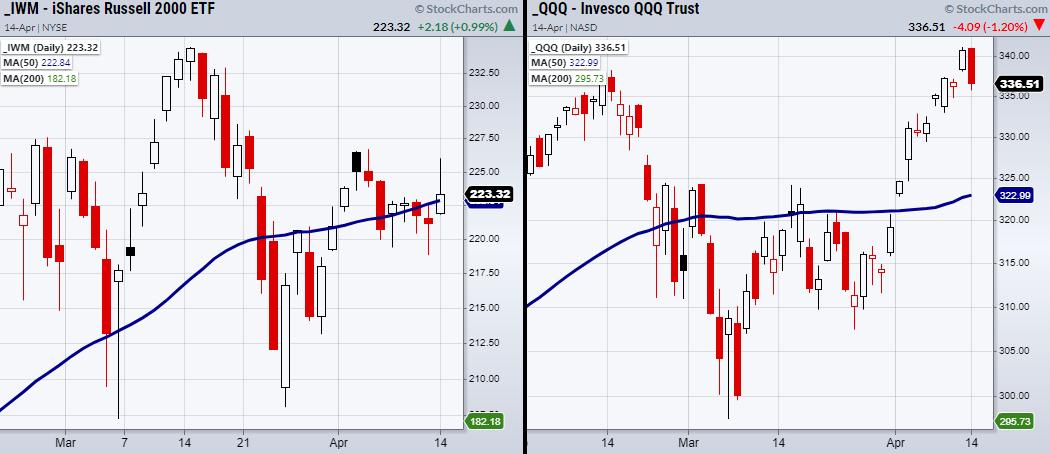
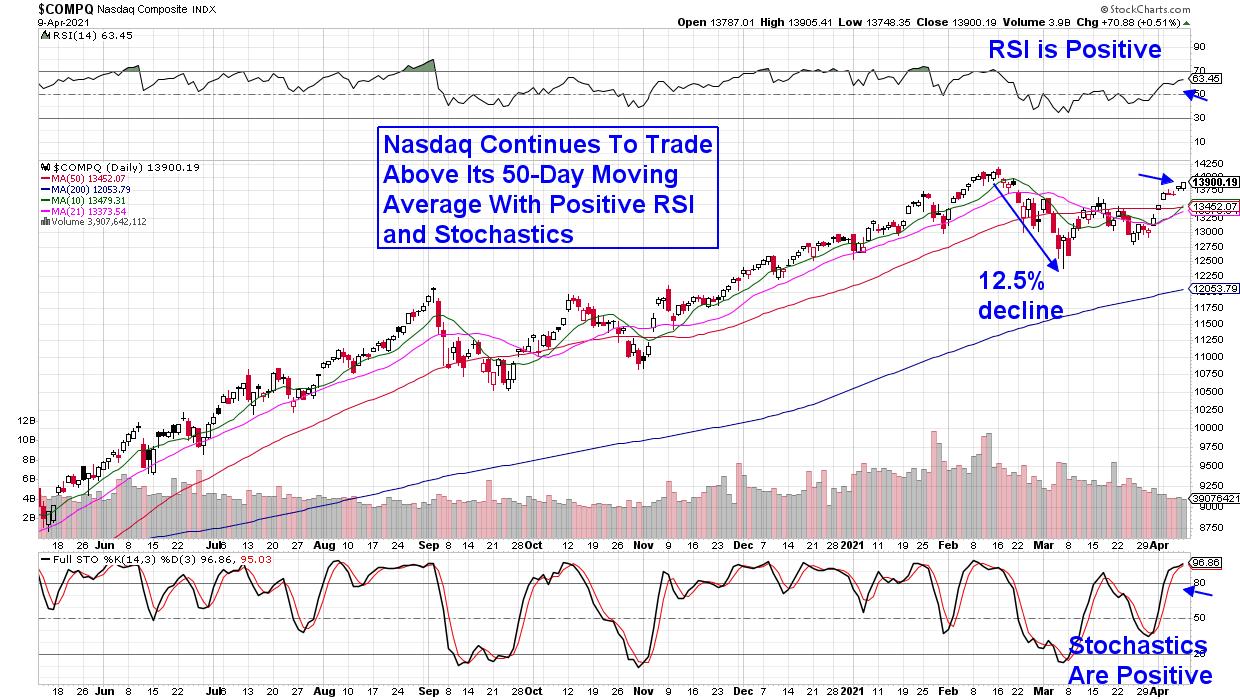
Why the Nasdaq 100 (QQQ) Needs to Hold Near Highs
On Tuesday, we talked about the Coinbase (COIN) public listing and how waiting for the dust to settle would be a good plan, as there is no prior price action or history to base projections from a technical standpoint. The plan turned out to be correct, as Coinbase's...
READ MORE
MEMBERS ONLY

DOLLAR WEAKENS AS COMMODITIES REBOUND -- COMMODITY INDEX NEARS TWO-YEAR HIGH
by John Murphy,
Chief Technical Analyst, StockCharts.com
DOLLAR INDEX BACKS OFF FROM 200-DAY LINE...A rebound in the dollar during the first quarter may have run its course. Chart 1 shows the Invesco Dollar Index Fund (UUP) falling back below its 200-day moving average and threatening its 50-day line. What the dollar does from here could have...
READ MORE
MEMBERS ONLY

Landry Light Pullbacks - Crypto

by Dave Landry,
Founder, Sentive Trading, LLC
In this edition of Trading Simplified, Dave continues to show his methodology in action. It's important to stick with what's happening in methodology and current markets. Dave has 2 new IPO Mystery Charts and covers Alt-Coins in the "Profit Center" segment. He also showcases...
READ MORE
MEMBERS ONLY
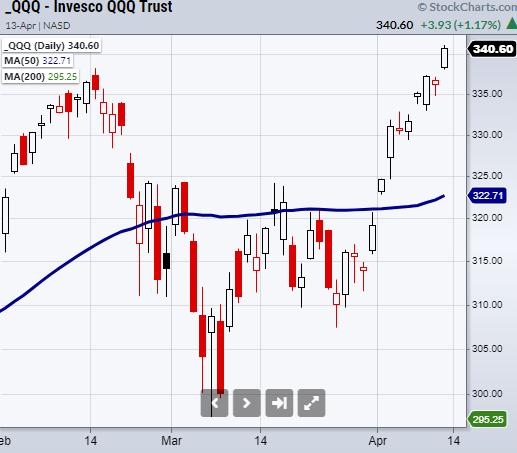
How Does Coinbase Affect the Tech Sector?
The Nasdaq 100 (QQQ) has made new all-time highs on the heels of Coinbase's direct listing on April 14th.
Coinbase is currently the most popular exchange for buying crypto and has attracted a large amount of popularity and hype before it releases, as market analysts throw out wildly...
READ MORE
MEMBERS ONLY
Sector Spotlight: Strong Rotation for Industrials
by Julius de Kempenaer,
Senior Technical Analyst, StockCharts.com
In this edition of StockCharts TV's Sector Spotlight, I look at last week's rotations for asset classes and sectors and review the daily rotations on the Relative Rotation Graph in combination with the weekly picture, aligning these with the current trends on the price charts. Caution...
READ MORE
MEMBERS ONLY

TESLA CLEARS ITS 50-DAY AVERAGE AND MAY BE BOTTOMING
by John Murphy,
Chief Technical Analyst, StockCharts.com
TESLA TURNS UP... Tesla is the day's biggest percentage gainer in the S&P 500 and the Nasdaq 100. It's also the day's strongest stock in the Consumer Discretionary SPDR which is itself hitting a new record. And it's chart is...
READ MORE
MEMBERS ONLY

A Review of the RRG L/S Baskets
by Julius de Kempenaer,
Senior Technical Analyst, StockCharts.com
Earlier today in Sector Spotlight, I discussed the various stocks inside the Long/Short baskets as I show them from time to time. The two RRGs above show both baskets as they currently are after the updates in Sector Spotlight.
Long
On the Long side, I removed EBAY and replaced...
READ MORE
MEMBERS ONLY
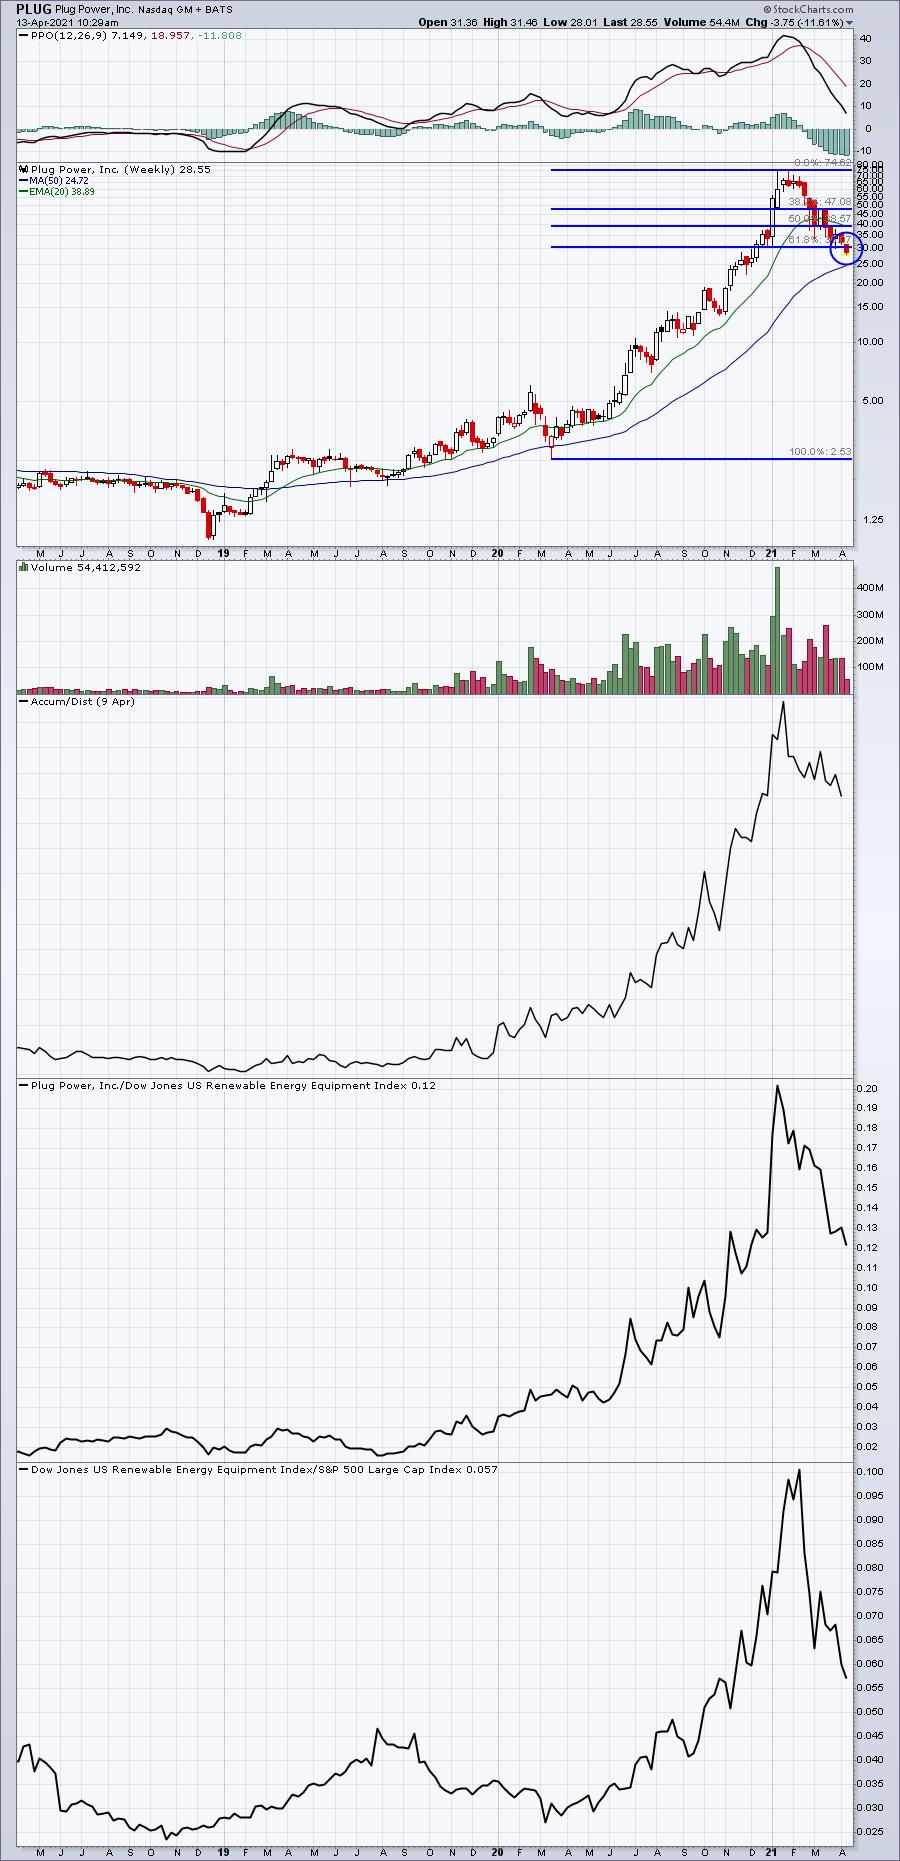
Why PLUG Could Be Bottoming This Week
by Tom Bowley,
Chief Market Strategist, EarningsBeats.com
I'm not a big fan of catching a falling knife. And right now, Plug Power (PLUG) is more like a machete. But there are both short-term and long-term reasons why we could see a major bottom print on its chart. Let's start with the technical long-term...
READ MORE
MEMBERS ONLY
How to Read the Mixed Market Picture
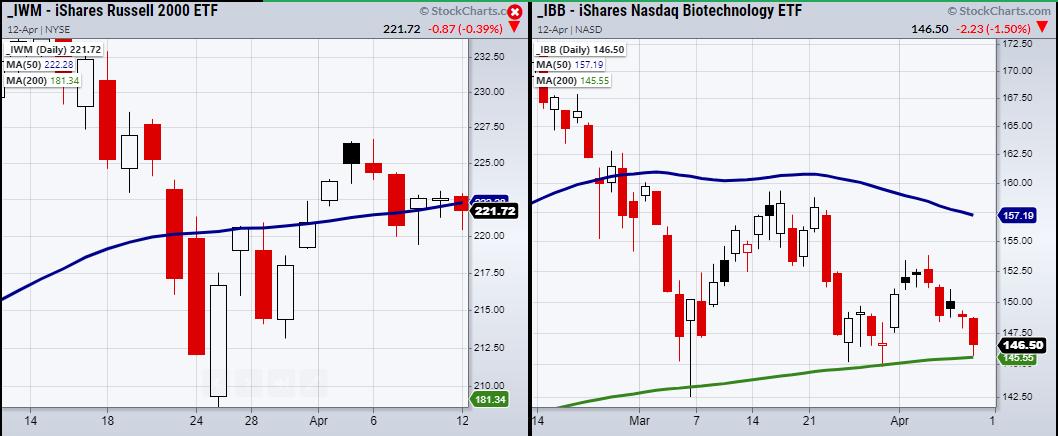
On Monday, the Economic Modern Family, which consists of 1 index and 5 key sectors, showed mixed signals as half of the Family closed down for the day. Currently, the Russell 2000 (IWM), Biotech (IBB) and Semiconductors (SMH) are down with Transportation (IYT), Retail (XRT) and Regional Banks (KRE) up...
READ MORE
MEMBERS ONLY
DP TV: Swenlin Trading Oscillators Flash Warning
by Erin Swenlin,
Vice President, DecisionPoint.com
by Carl Swenlin,
President and Founder, DecisionPoint.com
In this episode of DecisionPoint, Carl and Erin thoroughly review market price action and indicators in all timeframes. Carl spends some time discussing his sector chart annotations spotlighting Communications (XLC) and Technology (XLK). Of particular concern are the Swenlin Trading Oscillators, short-term indicators that have been quite prophetic at market...
READ MORE
MEMBERS ONLY
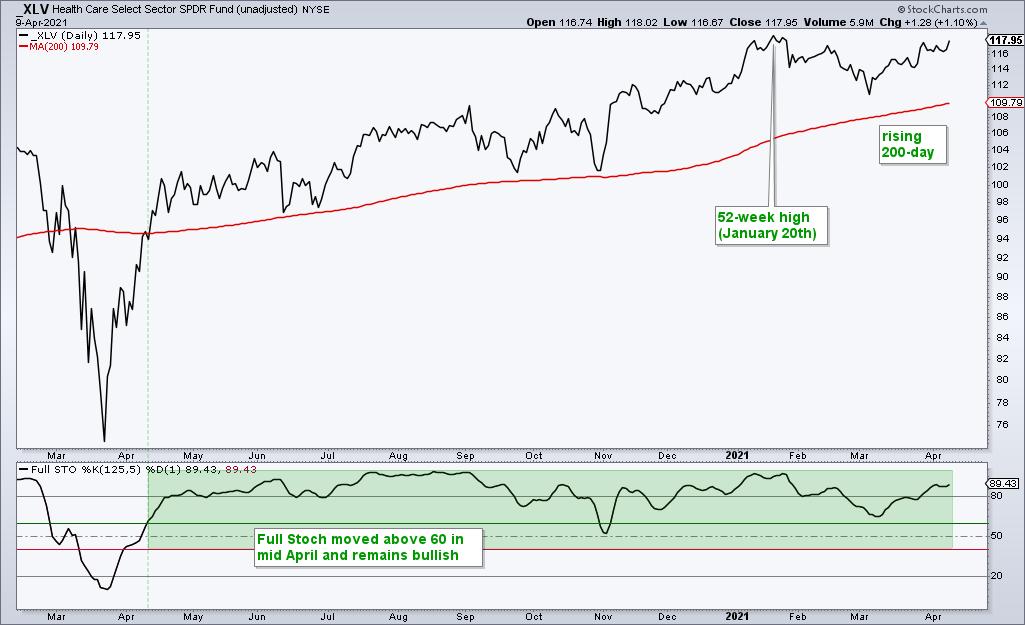
Healthcare SPDR Looks Poised to Extend Uptrend
by Arthur Hill,
Chief Technical Strategist, TrendInvestorPro.com
The Healthcare SPDR (XLV) formed two bullish continuation patterns within its long-term uptrend and recent breakouts bode well for further gains.
First and foremost, the long-term trend is up for XLV. The ETF is above its rising 200-day SMA and within 1% of its January high, which was a 52-week...
READ MORE
MEMBERS ONLY
What Are The Best ETFs To Invest In Right Now?
by Tom Bowley,
Chief Market Strategist, EarningsBeats.com
Investing isn't easy and there are so many choices, even if you narrow your choices and are only looking at ETFs (Exchange-traded funds). The number of ETFs is staggering. How do you put a portfolio together to match your own personal investing style?
That's a difficult...
READ MORE
MEMBERS ONLY

Week Ahead: NIFTY Has This Pattern to Navigate to Move Higher; RRG Chart Shows These Sectors to Relatively Outperform
by Milan Vaishnav,
Founder and Technical Analyst, EquityResearch.asia and ChartWizard.ae
In a trading range that was wider than the previous week, the Indian equities did not make any directional headway and ended on a flat note over the past five days. On the expected lines, the NIFTY oscillated in a wider range, but stayed within the falling channel that the...
READ MORE
MEMBERS ONLY
Institutions Have Raised $3 Trillion in Cash. They're Starting to Put That Money Back to Work
by Mary Ellen McGonagle,
President, MEM Investment Research
Institutions have increased their cash balances by 9% since the beginning of this year*. This brings their total cash pile to $3 trillion, which represents lots of potential firepower for equity gains as this money gets put to work.
For those who follow the markets closely, you'll know...
READ MORE
MEMBERS ONLY
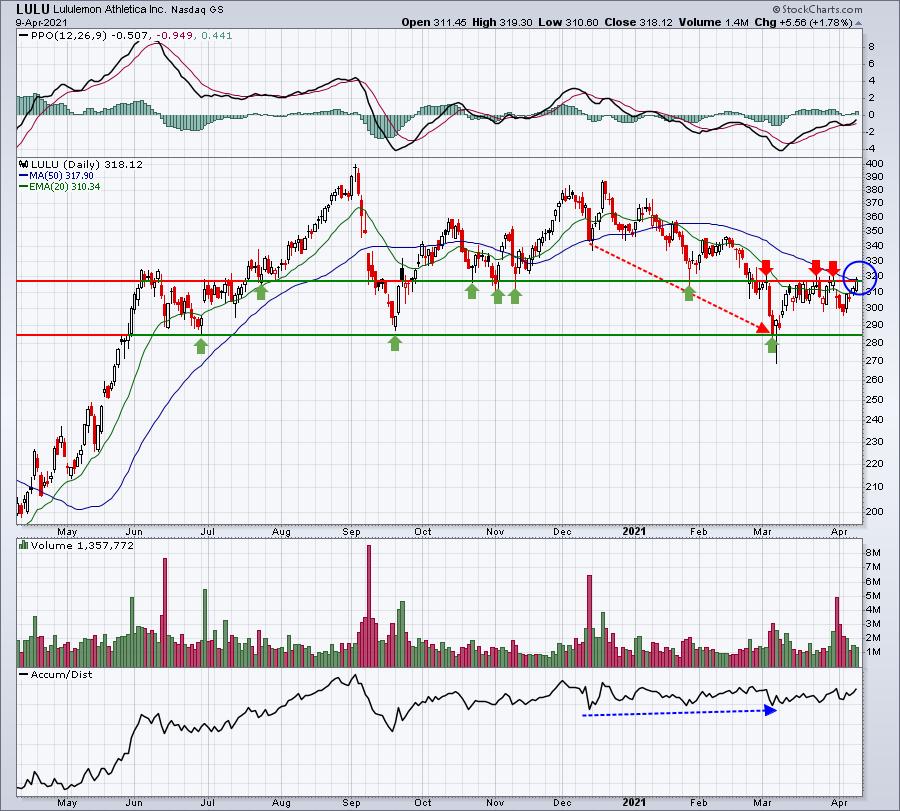
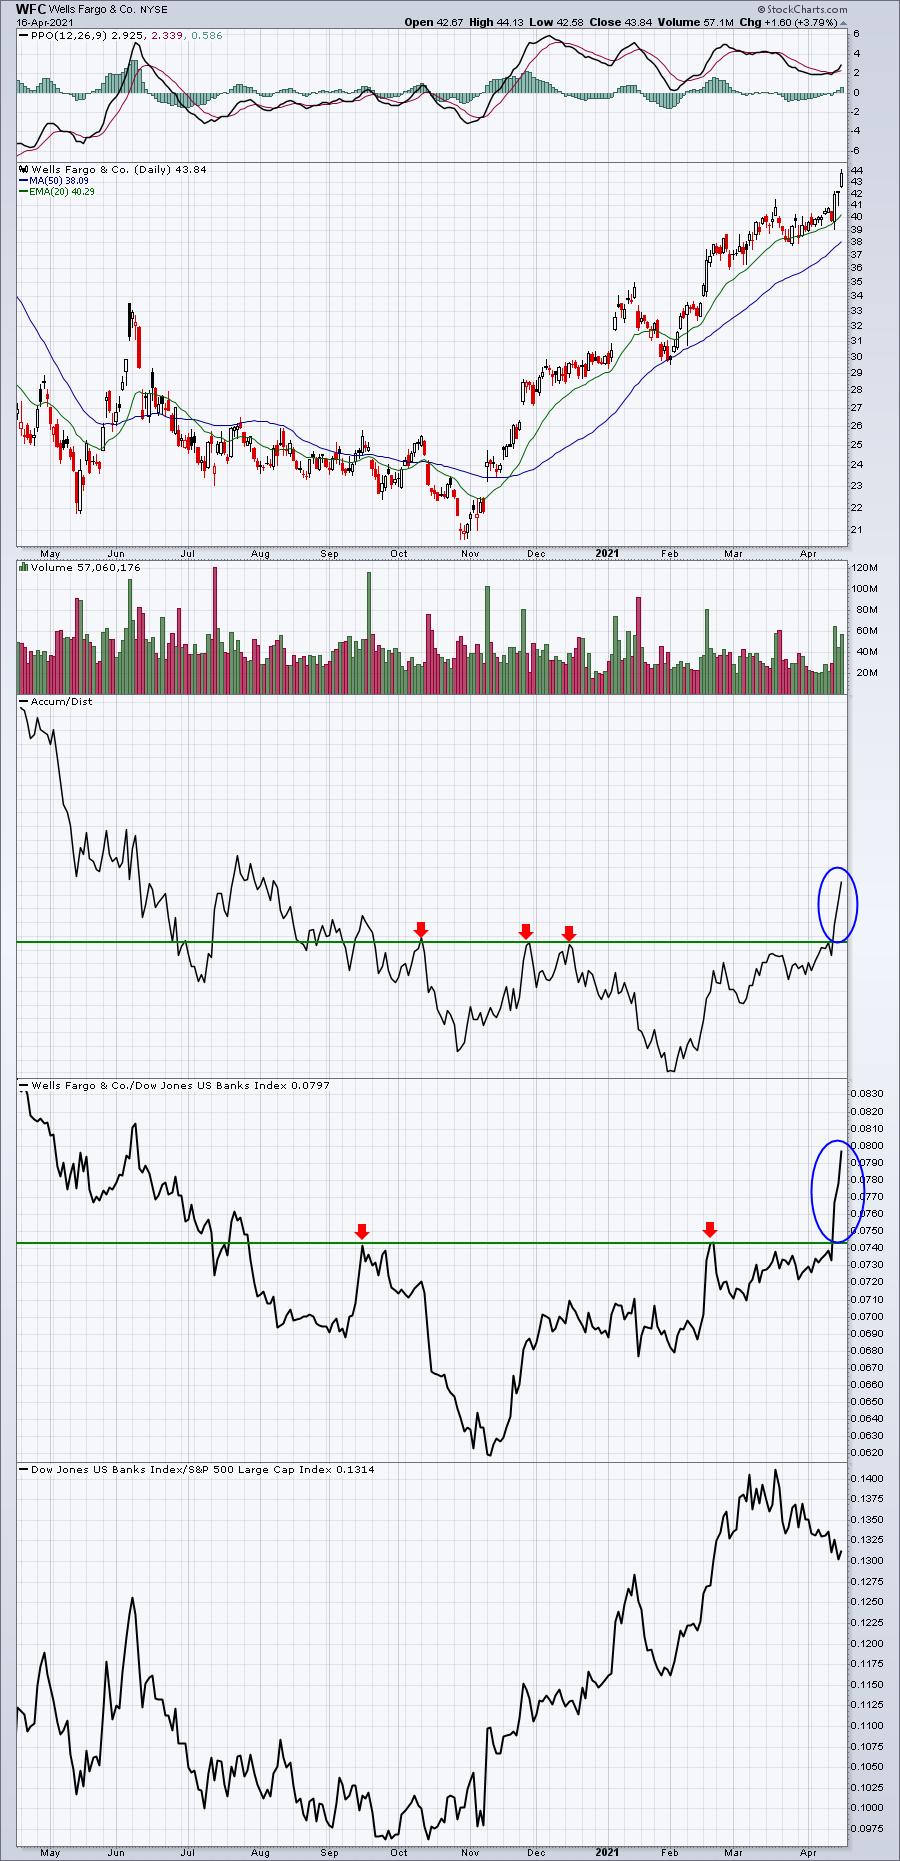
A Downtrending Stock Poised to Explode Higher - Get in Early
by Tom Bowley,
Chief Market Strategist, EarningsBeats.com
When I see a long-term winning stock sell off for a period of weeks, or even months, I always question the motive. If institutions want to buy a large position in a company, it takes time to do so. They don't simply put a market order in for...
READ MORE
MEMBERS ONLY
Major Upside Potential!
by Mary Ellen McGonagle,
President, MEM Investment Research
In this episode of StockCharts TV'sThe MEM Edge, Mary Ellen shares high growth areas of the market that are just beginning to reverse their downtrends, while also reviewing select stocks in those areas. She also reveals a must-run screen to help you as we enter into earnings season....
READ MORE
MEMBERS ONLY

A Battle for Breadth on Relative Rotation Graphs
by Julius de Kempenaer,
Senior Technical Analyst, StockCharts.com
This past Thursday, I was one of the guest hosts to fill in for David Keller on The Final Bar, as Dave was enjoying a week off. Of course I brought RRG to the show, but I also wanted to add a bit of educational content on how to use...
READ MORE
MEMBERS ONLY
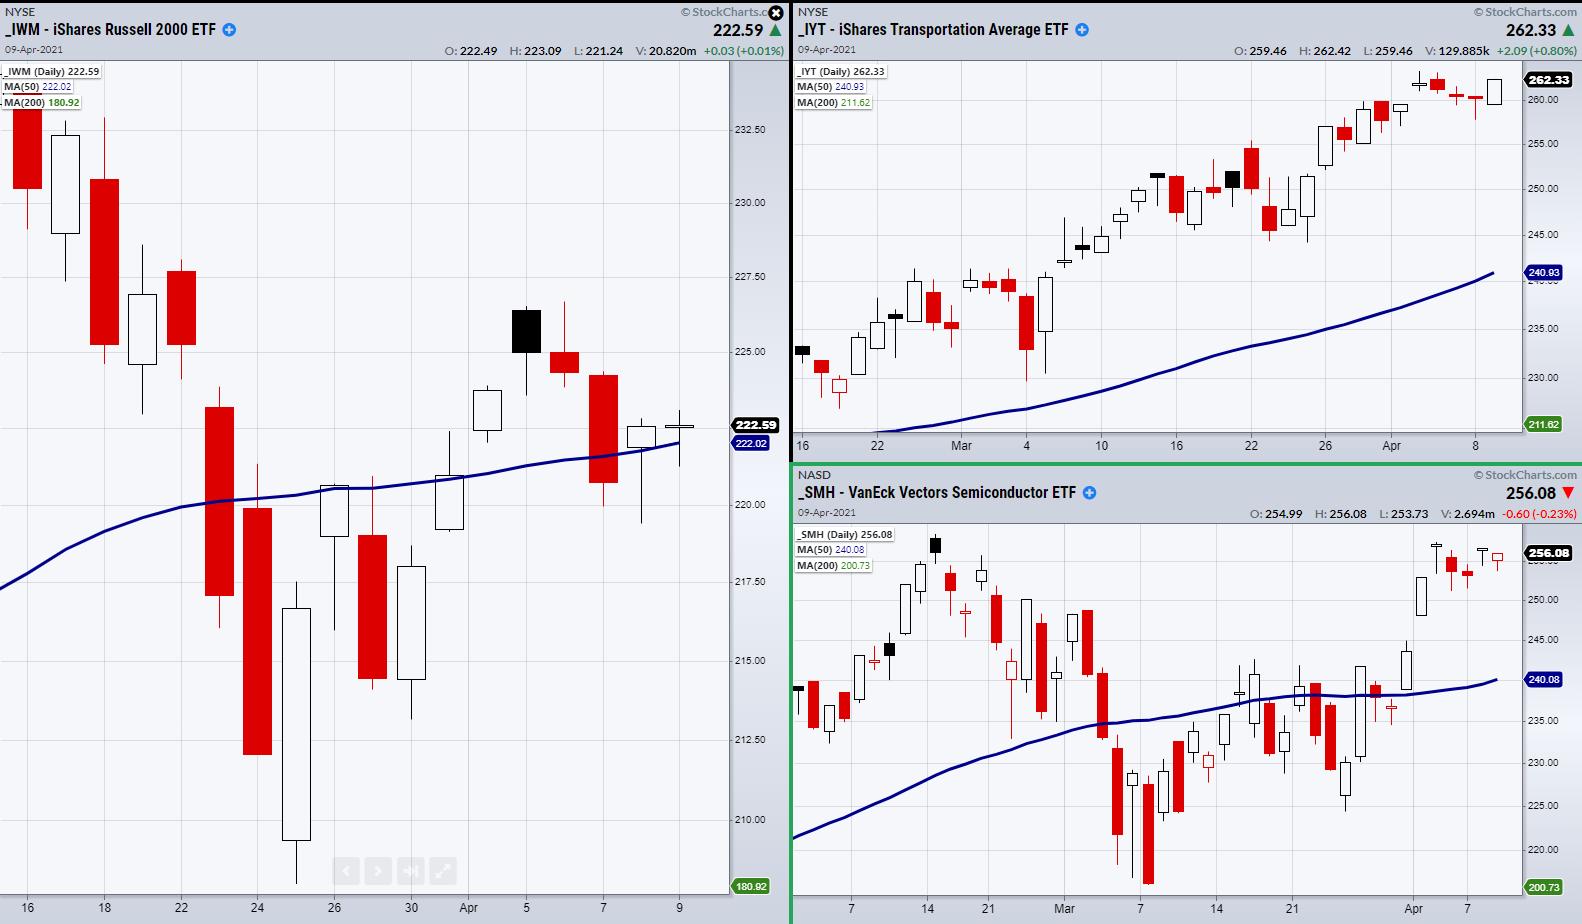
How to Navigate the Market with These 3 Symbols
Last week's focus was the Russell 2000 (IWM), Transportation ETF (IYT) and Semiconductors ETF (SMH). IWM has shown us general market direction and sentiment as it contains 2000 small-cap U.S companies. IYT is the backbone or demand side of the economy as the U.S opens with...
READ MORE
MEMBERS ONLY

S&P 500 Earnings 2020 Q4: Most Overvalued Advancing Market Ever
by Carl Swenlin,
President and Founder, DecisionPoint.com
You may ask why I used the qualification of "the most overvalued advancing market." On the chart below the current P/E Ratio is only exceeded twice, but both times it happened while the market was crashing -- the dotcom crash from the 2000 top, and the financial...
READ MORE
MEMBERS ONLY
Chartwise Women: Hot Areas Readying for Reopen
by Mary Ellen McGonagle,
President, MEM Investment Research
by Erin Swenlin,
Vice President, DecisionPoint.com
In this week's edition of Chartwise Women, Mary Ellen and Erin review areas of the market that are poised to outperform as consumers shift their focus toward being able to spend leisure time in public places. They also share ways you can screen for these stocks going forward....
READ MORE
MEMBERS ONLY

Is it Time to Buy Gold?
by Martin Pring,
President, Pring Research
The gold price peaked last August and has been zig-zagging down ever since. The approximate loss from the high has so far been just north of 15%. During that period, sentiment numbers have been slowly eroding, but not to bearish extremes, so is now a good time to buy? It...
READ MORE
MEMBERS ONLY

APPLE AND AMAZON MAY BE BOTTOMING
by John Murphy,
Chief Technical Analyst, StockCharts.com
APPLE MAY BE BOTTOMING... Chart 1 shows Apple (AAPL) in a downside correction since late January. That correction has taken the stock back down to its 200-day moving average which has acted as a long-term support line. Assuming that its long-term trend is still up, this would be a logical...
READ MORE
MEMBERS ONLY
Letting the Ebb & Flow Control Your Portfolio
by Dave Landry,
Founder, Sentive Trading, LLC
In this edition of Trading Simplified, Dave continues his discussion about portfolios and shares some examples of swing trades that turned out fantastic longer-term trades. Dave also follows up on a mystery chart that ended badly, and finally takes a look at profit centers and alt coins.
This video was...
READ MORE
