MEMBERS ONLY

PERCENT OF S&P 500 STOCKS ABOVE THEIR MOVING AVERAGES LOOKS STRETCHED

by John Murphy,
Chief Technical Analyst, StockCharts.com
% OF S&P 500 STOCKS ABOVE 50-DAY AVERAGE IS HIGH... Market breadth figures for the stock market remain quite strong. A couple of them, however, suggest that the market may be stretched on the upside. Chart 1 shows the percent of S&P 500 stocks above their 50-day...
READ MORE
MEMBERS ONLY

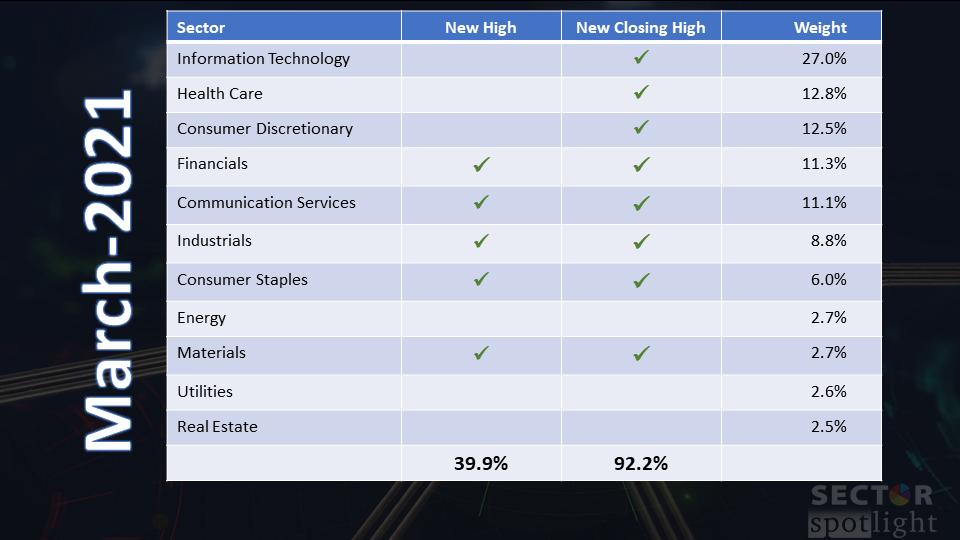
Sector Spotlight: 8 Sectors at New Closing Highs

by Julius de Kempenaer,
Senior Technical Analyst, StockCharts.com
It is the last Tuesday of the month, and that means looking at seasonality!
In this edition of StockCharts TV's Sector Spotlight, it's time to go over some monthly charts! As usual, Julius brings two batches of monthly charts to the show: one for Asset Classes,...
READ MORE
MEMBERS ONLY
Has the Market Run Up Too Quickly?
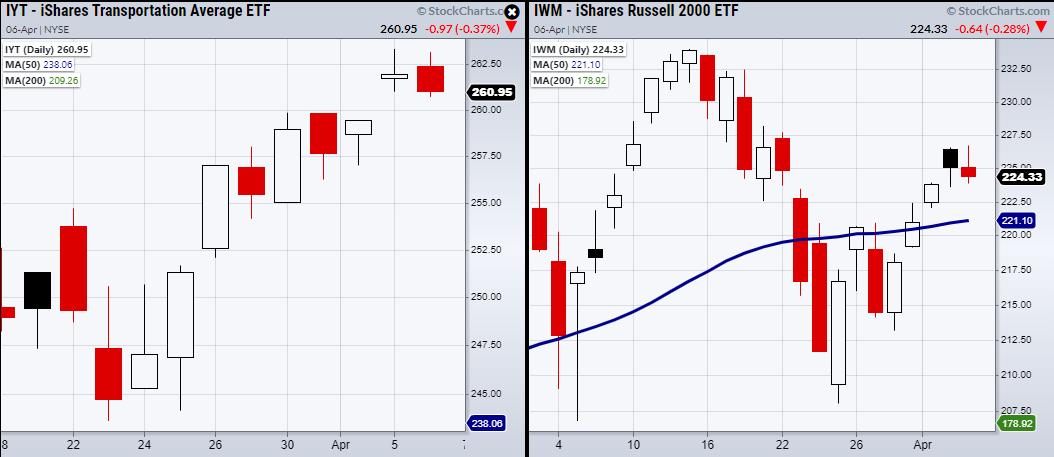
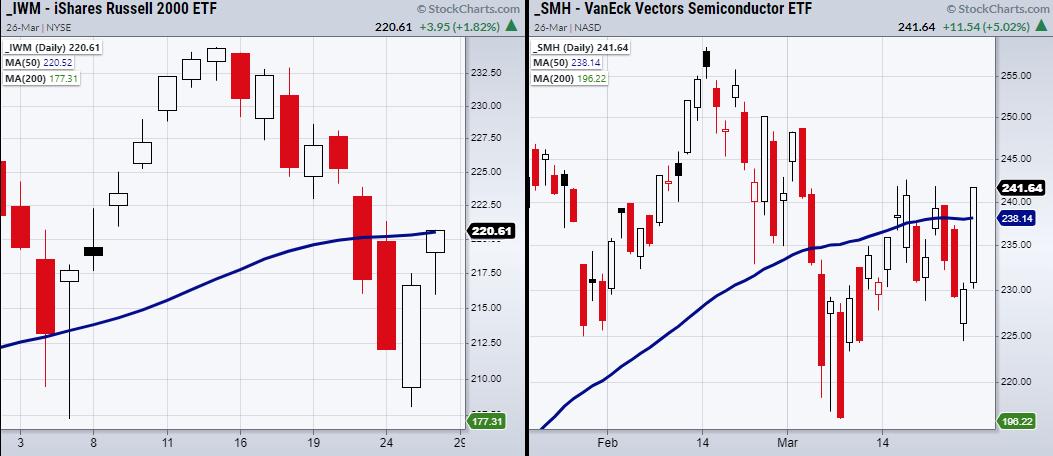
On Monday, we talked about the momentum in the Transportation (IYT) and Semiconductors (SMH) sectors, which showed strength when compared to the Russell 2000 (IWM). On Tuesday, IYT closed near Monday's low, making it a potential bearish engulfing day. Meanwhile, SMH failed to clear resistance at $258.59....
READ MORE
MEMBERS ONLY
Over 90% of "The Market" is in an Uptrend
by Julius de Kempenaer,
Senior Technical Analyst, StockCharts.com
Every first Tuesday of the month, I look at Asset Classes and Sectors' developments using monthly charts. This start-of-the-month routine keeps me on track of the longer-term developments in terms of price trends.
Yes, Relative Rotation Graphs are all about relative trends and relative strength. And I consider that...
READ MORE
MEMBERS ONLY

DP TV: Indicators Confirm New All-Time Highs

by Erin Swenlin,
Vice President, DecisionPoint.com

by Carl Swenlin,
President and Founder, DecisionPoint.com
In this episode of DecisionPoint, Carl and Erin review the surge to new all-time highs and reveal the indicators that are confirming this breakout. There are a few problem indicators, but in general the market is looking healthy. Hear their outlook for the SPY moving forward. Erin highlights Semiconductors and...
READ MORE
MEMBERS ONLY
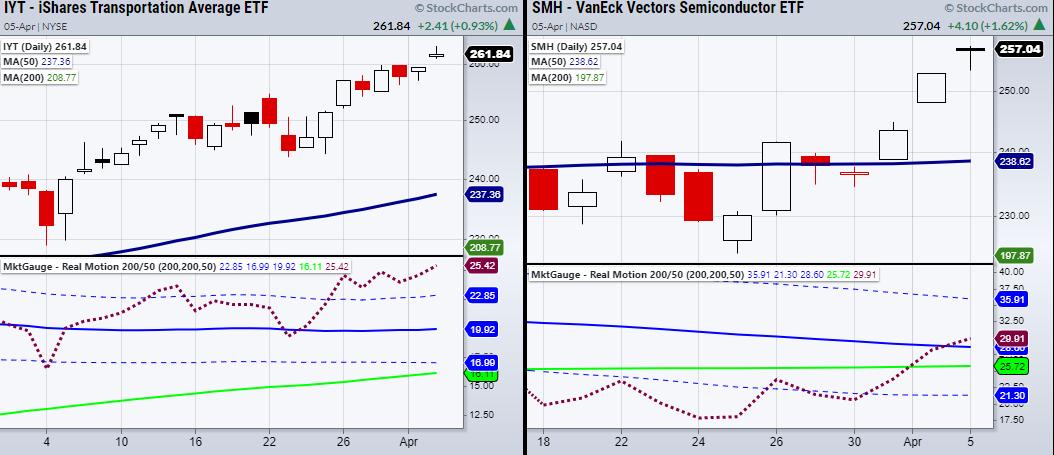
Why Transportation (IYT) and Semiconductors (SMH) Have Hidden Strength
SMH and IYT are the strongest members of the Economic Modern Family, as they are both in a bullish phase in price and in momentum.
We are measuring momentum based on MarketGauge's proprietary indicator RealMotion. RealMotion was designed to show hidden strength/weakness in a security based on...
READ MORE
MEMBERS ONLY

CONSUMER DISRETIONARY AND TECH STOCKS LEAD MARKET HIGHER -- SOME BIG TECH BREAKOUTS --- QQQ TURNS UP
by John Murphy,
Chief Technical Analyst, StockCharts.com
CONSUMER DISRETIONARY SPDR NEARS OLD HIGH...Stocks are trading sharply higher today following a strong jobs report on Friday and news today of a stronger service economy. The Dow and S&P 500 are trading in record territory and the Nasdaq isn't far behind. Nine of the...
READ MORE
MEMBERS ONLY
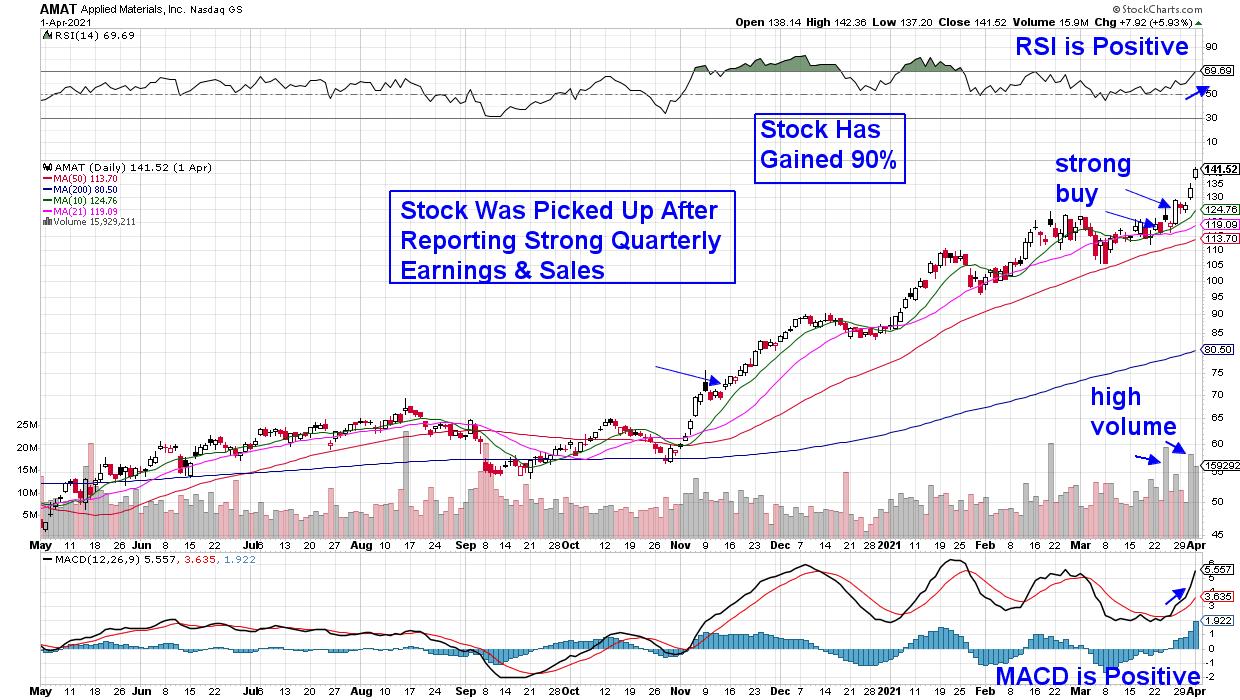
Tech Takes Center Stage in Biden's Infrastructure Plan; Here's a Top Stock to Benefit

by Mary Ellen McGonagle,
President, MEM Investment Research
We had quite an end to the holiday-shortened week after Biden unveiled his infrastructure bill. The $2.3 trillion plan not only proposes to invest in infrastructure and climate change, but a large portion of funds are allocated for 5G/broadband expansion across the U.S. Each of these areas...
READ MORE
MEMBERS ONLY

Week Ahead: NIFTY Likely to See Incremental Gains; RRG Charts Show This Sector Ending Relative Outperformance

by Milan Vaishnav,
Founder and Technical Analyst, EquityResearch.asia and ChartWizard.ae
The previous week was a short and truncated one with just three working days. The NIFTY stayed volatile on the expected lines and danced to yield and a stronger dollar on the expected lines, but continued to post some gains. On the weekly charts, the Index stayed much in a...
READ MORE
MEMBERS ONLY
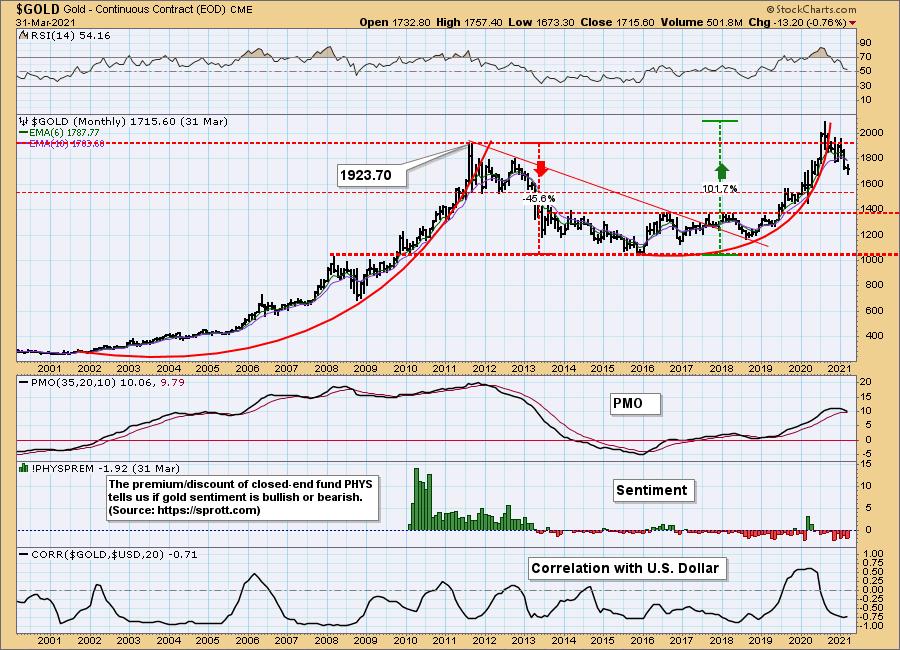
Is It Time to Go Long on Gold? -- Mary Ellen McGonagle Joins DP Trading Room Monday!
by Erin Swenlin,
Vice President, DecisionPoint.com
In today's "Diamond Mine" Trading Room (DP Diamonds subscribers only), I was asked if it was time to go long on Gold given its rally this week. Well, if we are talking about "longs," we should start at the monthly chart and work down...
READ MORE
MEMBERS ONLY
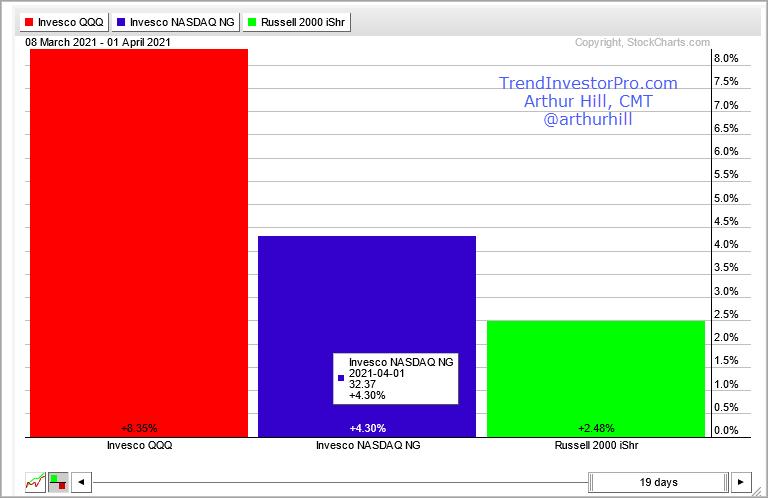
A Relative Strength Clue for QQQ

by Arthur Hill,
Chief Technical Strategist, TrendInvestorPro.com
The Nasdaq 100 ETF (QQQ) represents the largest stocks in the Nasdaq and the Nasdaq 100 Next Gen ETF (QQQJ) covers the next 100 (101 to 200). Stocks at the top of the latter group are knocking on the door and trying to fatten up for inclusion into the legendary...
READ MORE
MEMBERS ONLY
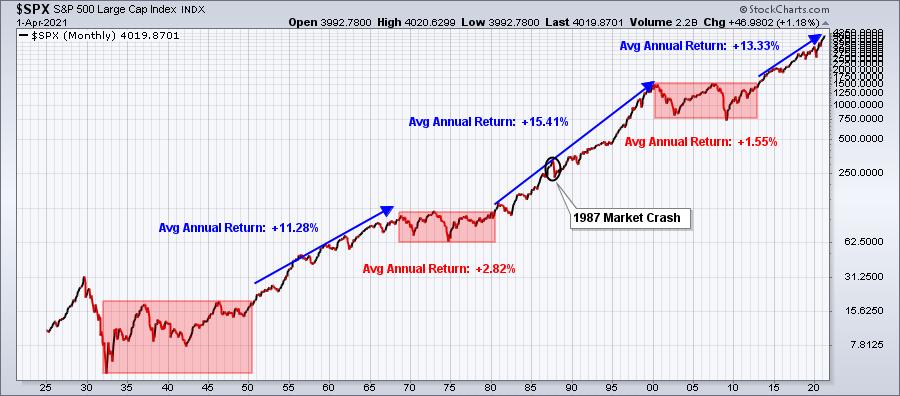
This Is The ONLY Technical Sell Signal I Use To Spot Secular Bear Markets

by Tom Bowley,
Chief Market Strategist, EarningsBeats.com
Why am I always so bullish? I'm asked this question in many different ways, but I'm very happy to explain my stance - and it's quite simple. Because the stock market goes up a WHOLE LOT MORE than it goes down. Instead of constantly...
READ MORE
MEMBERS ONLY
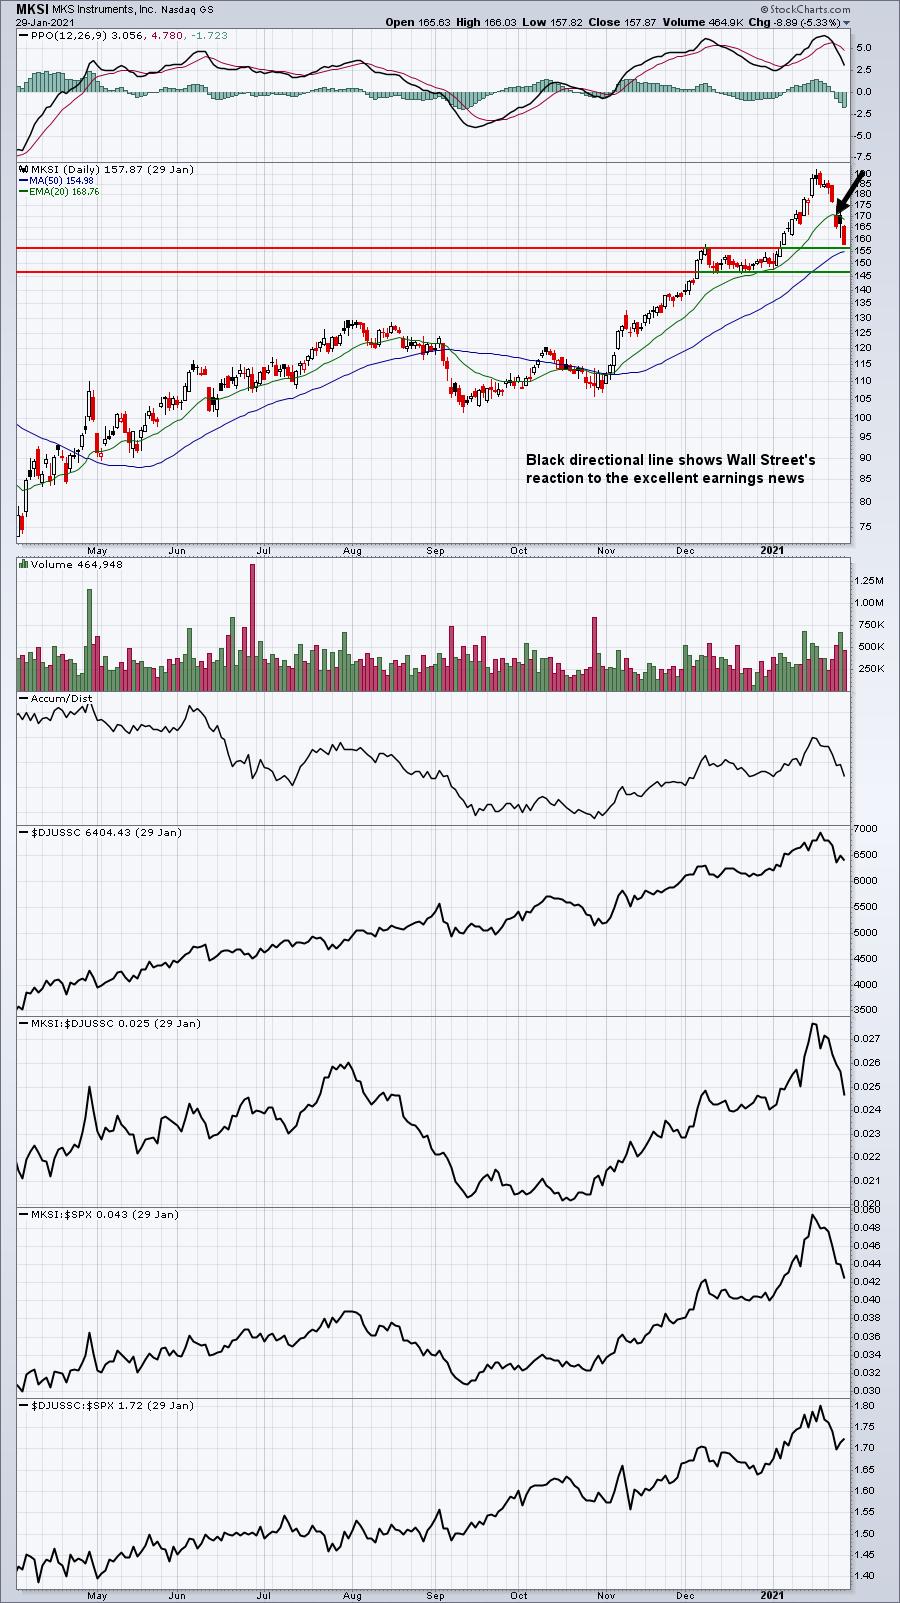
Here's What Great Earnings-Related Trade Setups Look Like
by Tom Bowley,
Chief Market Strategist, EarningsBeats.com
I love earnings season. Perhaps it's the CPA inside of me, having practiced in public accounting for a couple decades. Maybe it's the excitement of new fundamental information being released that alters the valuation of companies. But mostly, I think, it's the short-term inefficiency...
READ MORE
MEMBERS ONLY
Candlestick Charting Explained & Candlestick Charting Explained Workbook

by Greg Morris,
Veteran Technical Analyst, Investor, and Author
StockCharts.com's bookstore is offering a limited time, very low price on both books. See the end of this article for details.
The success of the first edition (1992) originally called Candlepower, and the second edition (1995) made the decision to do an expanded third edition easy. I...
READ MORE
MEMBERS ONLY
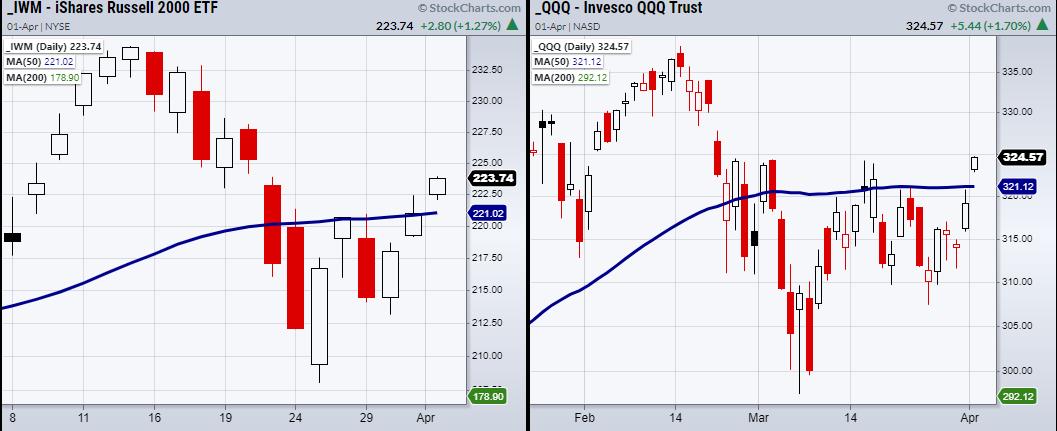
With 2 Indices Clearing Major Resistance, Watch Out for This Common Trader Pitfall
On Thursday, both the Russell 2000 (IWM) and the Nasdaq 100 (QQQ) cleared major resistance levels from the 50-day moving average. In many traders/investors' minds, this has opened the bullish floodgates with new highs in view. Additionally, the High Yield Bond ETF (JNK) is holding over its 50-DMA....
READ MORE
MEMBERS ONLY

Chartwise Women: Stocks Pivot on Biden Plan
by Mary Ellen McGonagle,
President, MEM Investment Research
by Erin Swenlin,
Vice President, DecisionPoint.com
In this week's edition of Chartwise Women, with President Biden's infrastructure plan laid out, Erin and Mary Ellen share the stocks that are pivoting back into favor. They review what sectors and industry groups to watch and the stocks that are likely to benefit from his...
READ MORE
MEMBERS ONLY
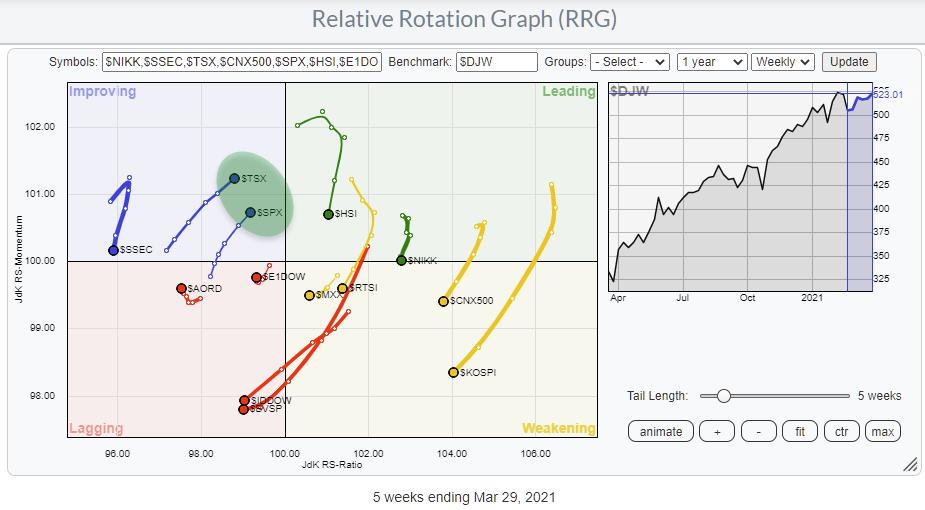
US Moving Towards Leading Quadrant vs. the World..... oh, and Canada Too
by Julius de Kempenaer,
Senior Technical Analyst, StockCharts.com
With the S&P 500 jumping to new highs, it's interesting to see how that impacts the position and the rotation of the US vs. the rest of the world.
The RRG above visualizes that. The highlighted area shows both the S&P and the Candian...
READ MORE
MEMBERS ONLY

Trolling the StockCharts Economic Database for Useful Stock Market Indicators

by Martin Pring,
President, Pring Research
Many of you may be unaware of the fact that StockCharts has a small database of economic indicators. (You can find them by searching for symbols that begin with $$.) This week, I ran through a number of series to see if any could be useful from a long-term stock market...
READ MORE
MEMBERS ONLY

Same as It Ever Was

by Dave Landry,
Founder, Sentive Trading, LLC
In this edition of Trading Simplified, Dave is ready to share a plethora of lessons with you. First up, after a brief market update, Dave continues his series "If I Can Do It So Can You; Letting The Ebb and Flow Control Your Portfolio." He finishes with Mystery...
READ MORE
MEMBERS ONLY

STRONGER TECH STOCKS BOOST NASDAQ -- SEMIS TURN UP
by John Murphy,
Chief Technical Analyst, StockCharts.com
TECHS ARE HAVING A STRONG DAY... Technology stocks are the day's strongest sector which is helping boost the Nasdaq market. As a result, the Nasdaq is leading today's rally. Chart 1 show the Invesco QQQ Trust trading 1.8% higher today and nearing a test of...
READ MORE
MEMBERS ONLY
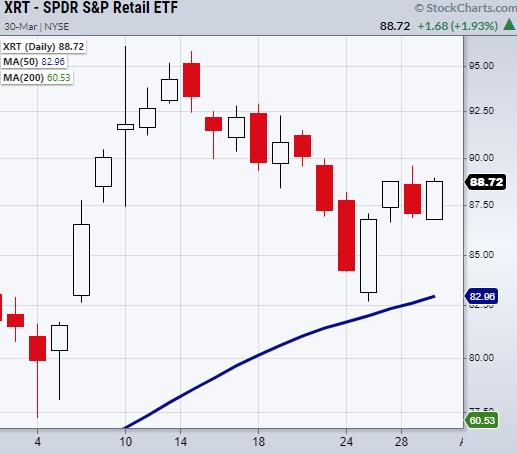
Is the Retail Sector (XRT) Heating Up?
Last Thursday, the retail sector ETF (XRT) opened near its 50-day moving average. It closed with a large range on increased volume, which was a good sign of strength. Though it has not made a decent-sized move since then, it has been holding its current price level.
Another factor is...
READ MORE
MEMBERS ONLY
Sector Spotlight: Tech is a Drag
by Julius de Kempenaer,
Senior Technical Analyst, StockCharts.com
It is the last Tuesday of the month, and that means looking at seasonality!
In this edition of StockCharts TV's Sector Spotlight, after an overview of last week's rotations and performances for asset classes and sectors, I bring up his 3-D visualization for sector seasonality and...
READ MORE
MEMBERS ONLY

SOUTHWEST AIRLINES ACHIEVES BULLISH BREAKOUT -- ALASKA AIR AND JETBLUE MIGHT BE NEXT
by John Murphy,
Chief Technical Analyst, StockCharts.com
SOUTHWEST AIRLINES CLEARS OVERHEAD RESISTANCE... Airlines stocks continue to gain more ground. Although the entire group is rising, three in particular caught my eye. The weekly bars in Chart 1 show Southwest Airlines (LUV) having cleared resistance along its early 2020 peak and reaching the highest level in more than...
READ MORE
MEMBERS ONLY
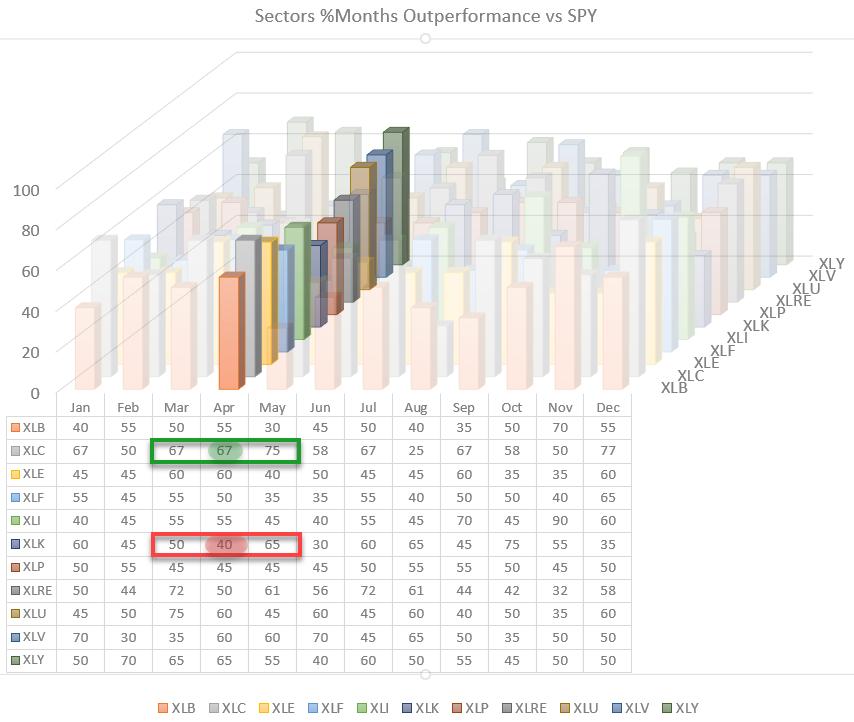
Comm is Da Bomb
by Julius de Kempenaer,
Senior Technical Analyst, StockCharts.com
The seasonal trends for sectors vs. the S&P 500 going into April show many 50/50 odds for out- or underperformance. But the two sectors that stand out are interesting and important ones.
Seasonality for Communication services shows that this sector outperformed 67% of the time in April...
READ MORE
MEMBERS ONLY
DP TV: Scanning and Sifting for Winning Stocks
by Erin Swenlin,
Vice President, DecisionPoint.com
In this episode of DecisionPoint, Erin flies solo and gives us an in-depth market review of the SPY, The Big Four (Dollar, Gold, Crude and Bonds) and a thorough sector review. As part of the sector review, she demonstrates how she mines for her "Diamond of the Week."...
READ MORE
MEMBERS ONLY
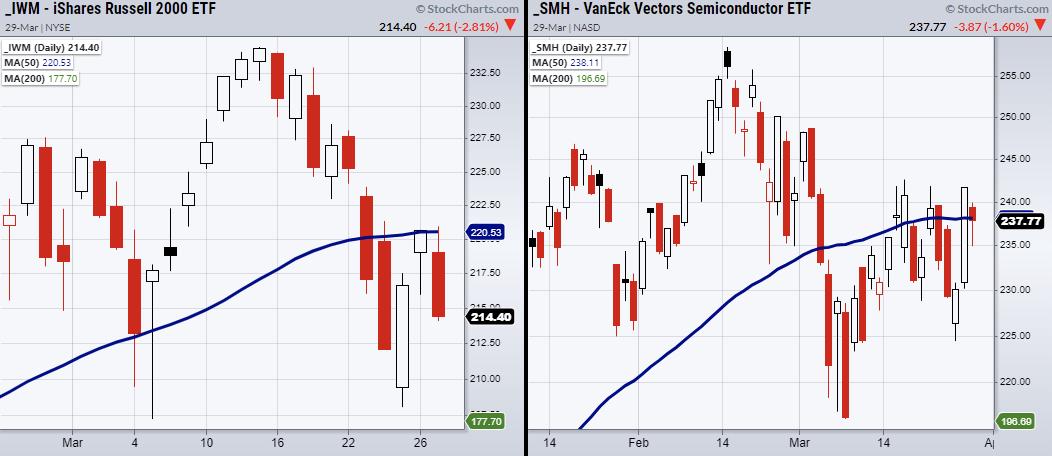
Expectations vs. the Market
Last Friday, the Russell 2000 (IWM) index and Semiconductors (SMH) cleared their 50-day moving average. From a technical standpoint, this looked as though the rally would continue into Monday. At least, that is what traders/investors were hoping for when they bought near Friday's close.
Monday's...
READ MORE
MEMBERS ONLY
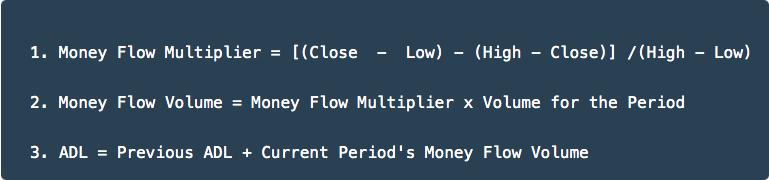
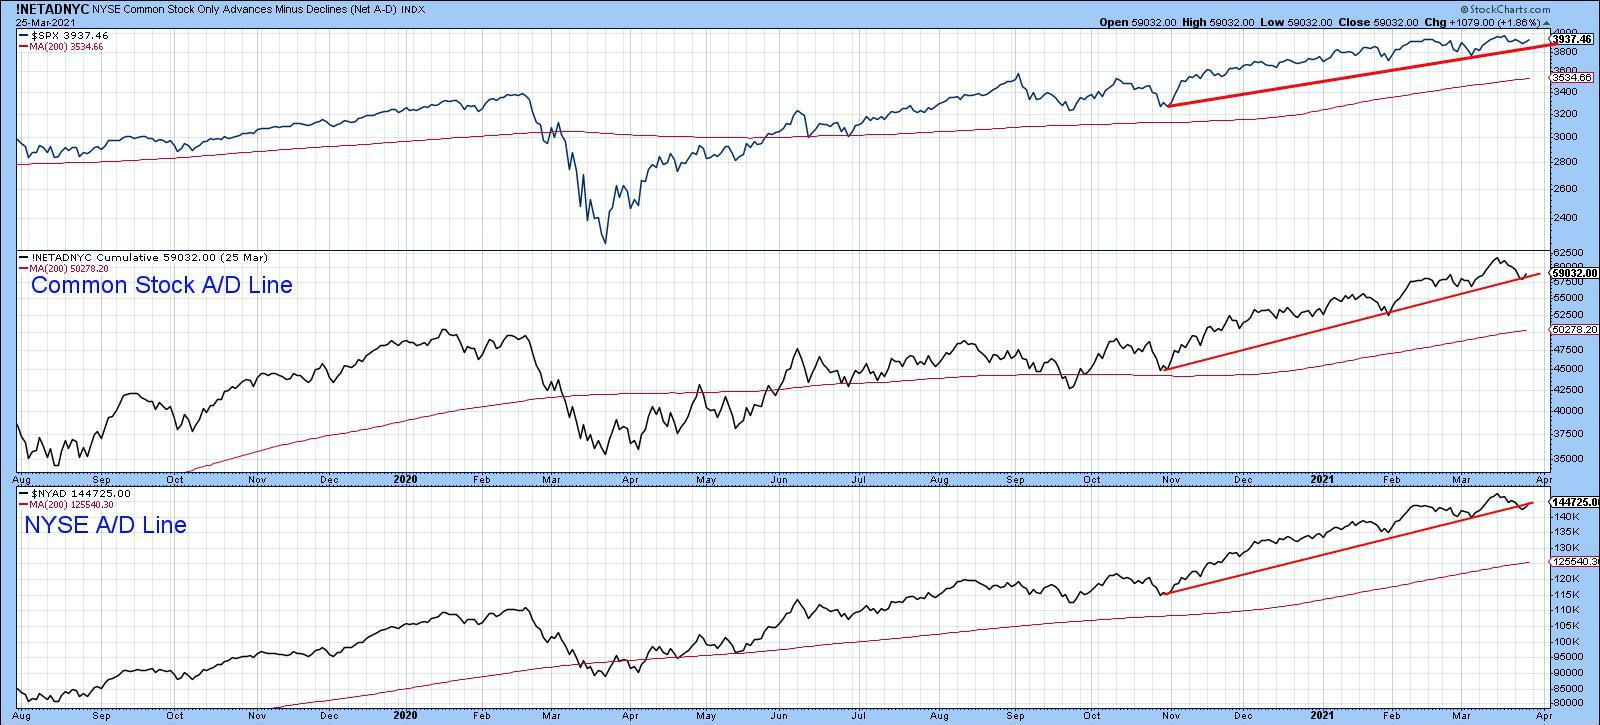
Will The AD Line Matter As We Speed Towards Earnings?
by Tom Bowley,
Chief Market Strategist, EarningsBeats.com
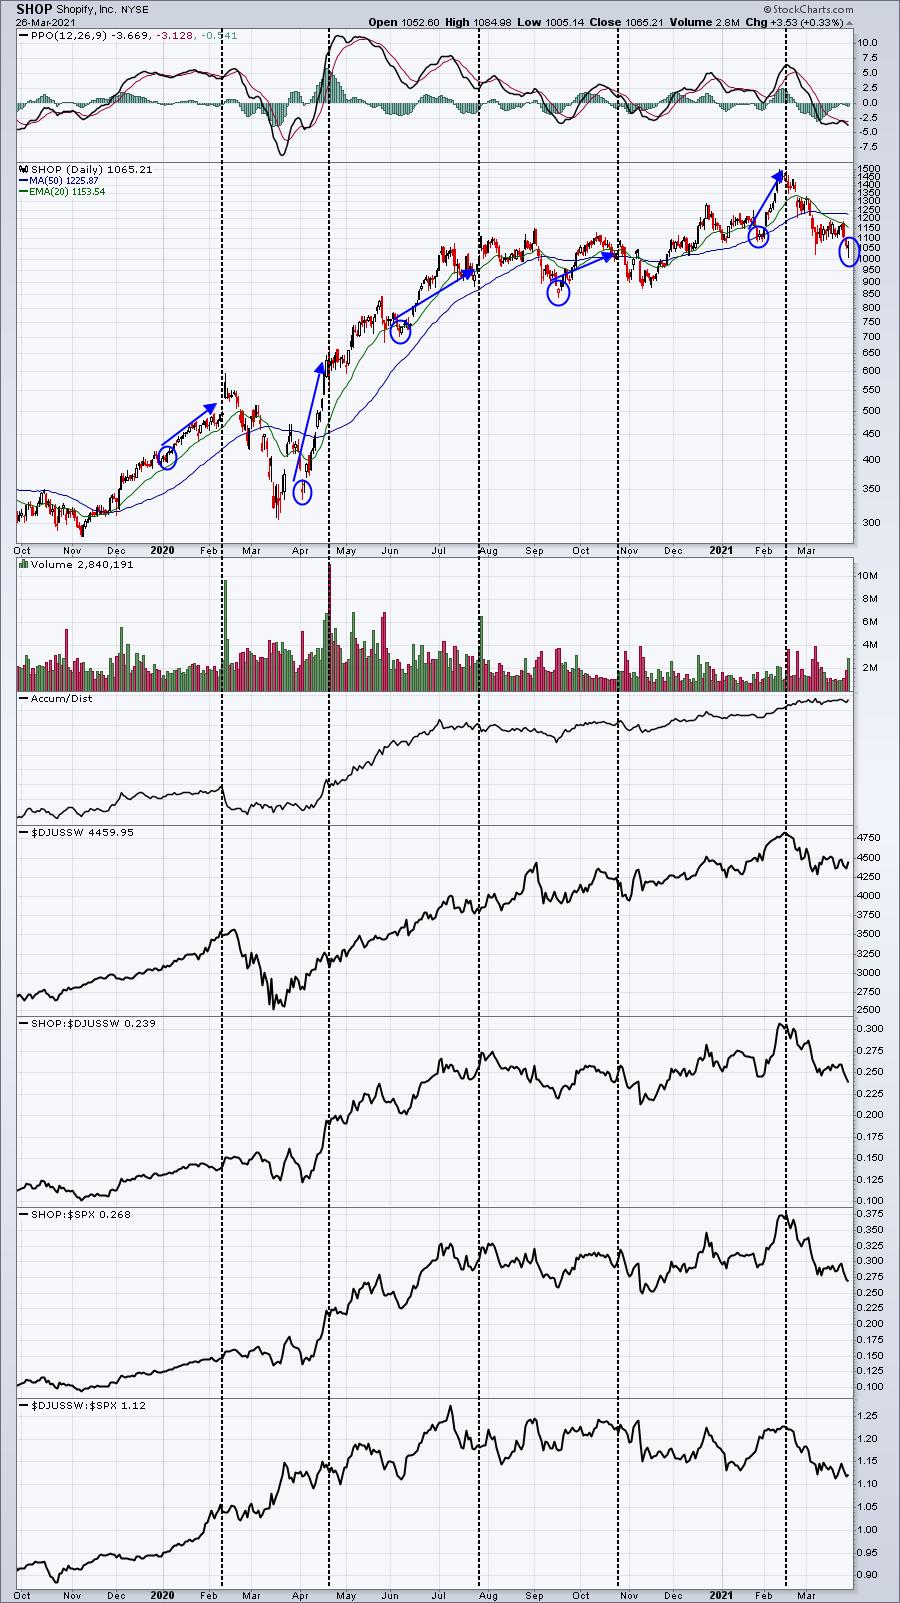
Growth stocks have been hammered on both an absolute and relative basis over the past several weeks, but as we move into earnings season, should we pay attention to rising AD lines? The accumulation/distribution line, developed by Marc Chaikin, doesn't really look at whether the stock is...
READ MORE
MEMBERS ONLY

News Flash! Big Advances Deserve Big Corrections and Proper Perspective - Tesla Example
by Arthur Hill,
Chief Technical Strategist, TrendInvestorPro.com
Dozens of high flying stocks and ETFs are down double digits from their February highs, but chartists should put these declines into perspective when analyzing the charts. The ARK Innovation ETF (ARKK), the Clean Energy ETF (PBW) and the Solar Energy ETF (TAN) declined over 30% from their February highs...
READ MORE
MEMBERS ONLY

Week Ahead: NIFTY to Stay Broadly Ranged in Truncated Week; This Zone Emerged as Strong Support Area for Markets
by Milan Vaishnav,
Founder and Technical Analyst, EquityResearch.asia and ChartWizard.ae
The previous five days of the week were spent in a broad range, where the markets remained in wide-ranged consolidation and ended the week on a modestly negative note. The NIFTY oscillated in an over 600-point range just like the week before, staying predominantly in a corrective mode -- except...
READ MORE
MEMBERS ONLY
Half Your Stock's Move Is Traceable To This One Item
by Mary Ellen McGonagle,
President, MEM Investment Research
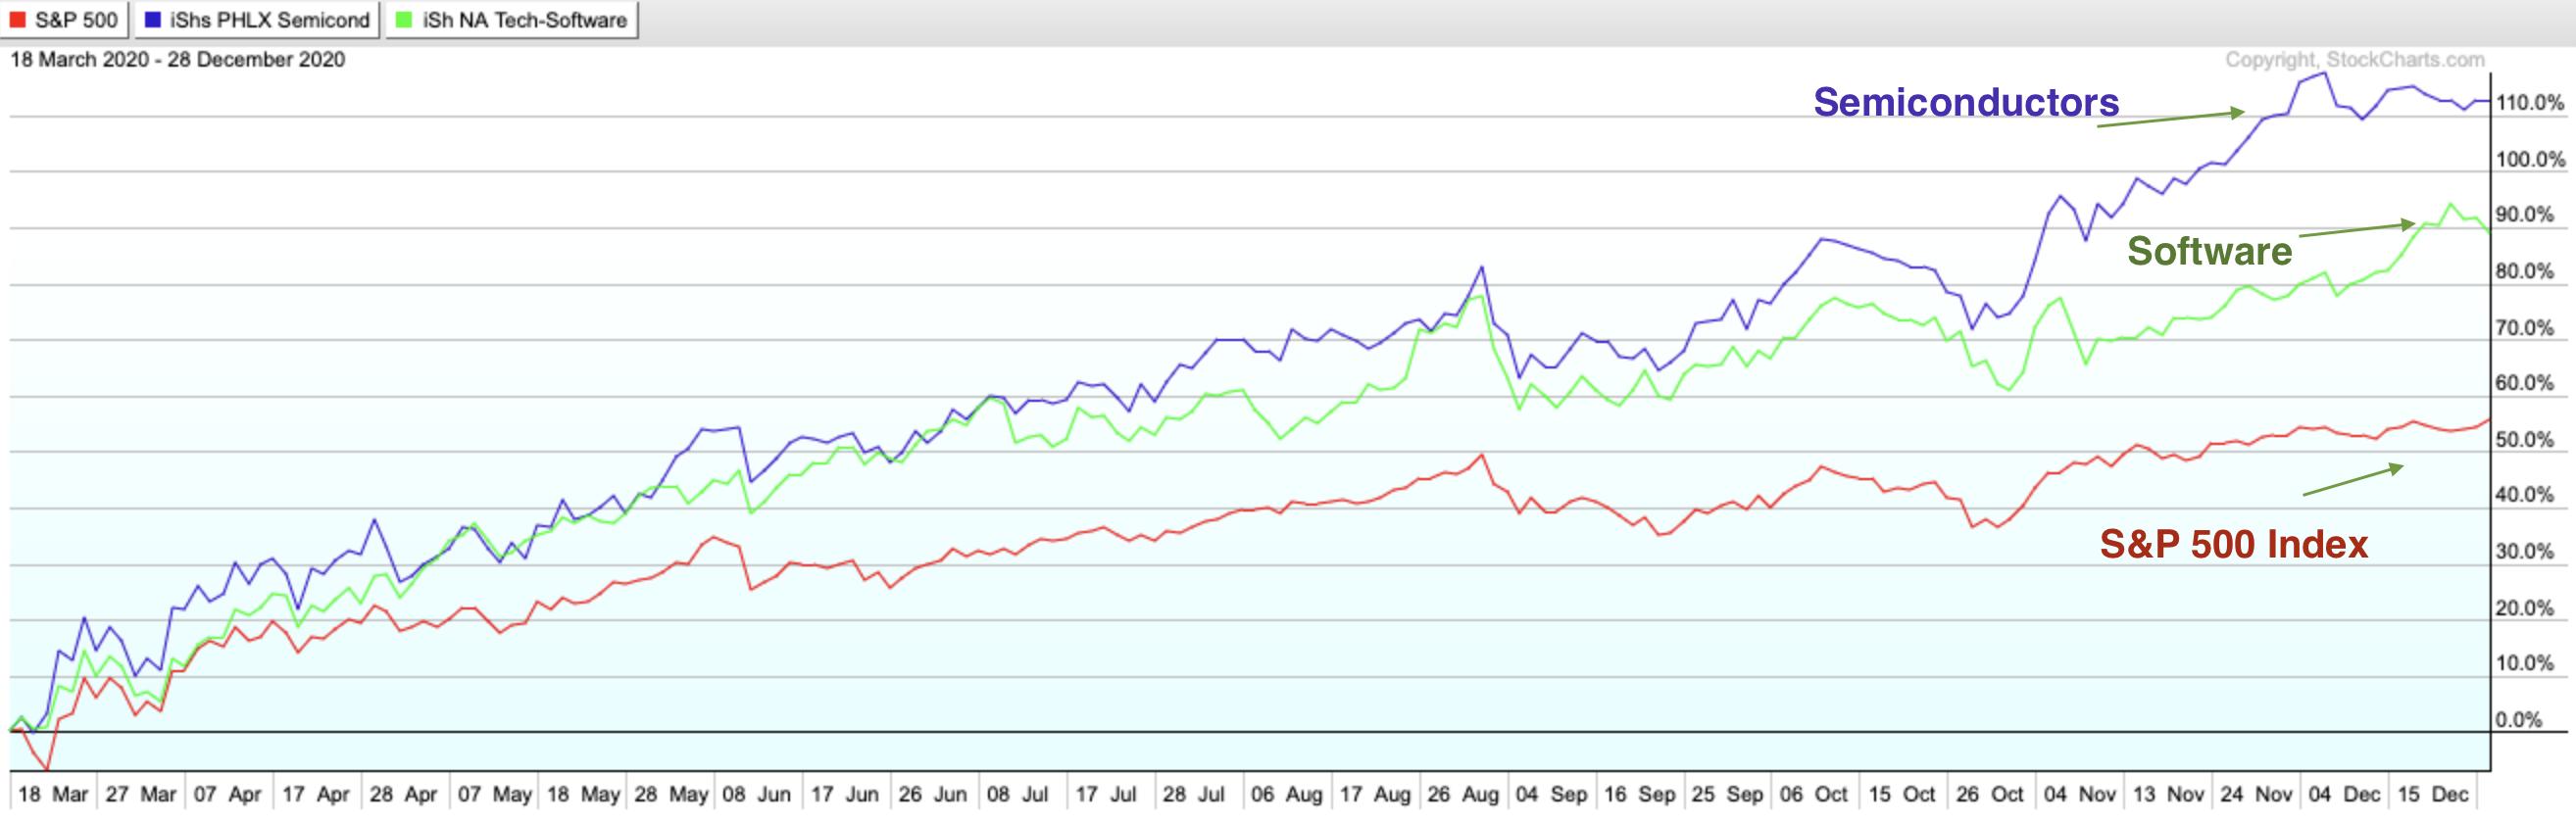
Have you ever noticed that top-performing stocks travel in groups? Just look at last year's biggest winners out of the bear market, where Technology stocks far outpaced the markets.
Within Technology, many out-performers were Cloud Computing related stocks. Software companies that helped corporations store large amounts of accessible...
READ MORE
MEMBERS ONLY
One Of The Market's Biggest Mysteries..... Solved
by Tom Bowley,
Chief Market Strategist, EarningsBeats.com
I'm sure that most of you have heard that old Wall Street adage "buy on rumor, sell on news." Well, it's never truer than with earnings. Wall Street meets with management teams prior to the end of the fiscal quarter and gathers a lot...
READ MORE
MEMBERS ONLY
Improving Relative Strength for Homebuilders

by David Keller,
President and Chief Strategist, Sierra Alpha Research
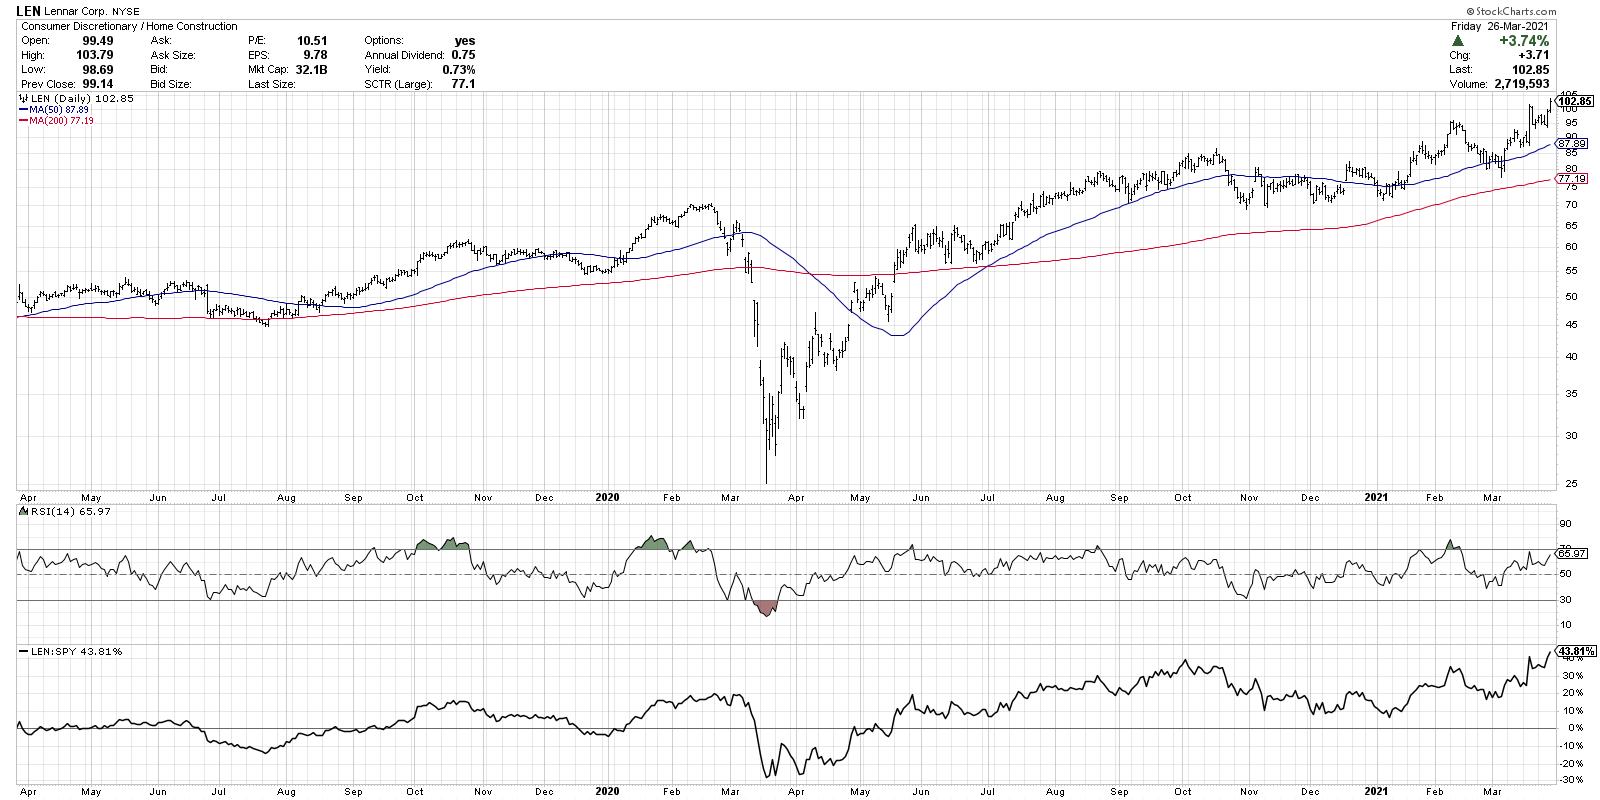
Relative strength is one of the most important parts of my technical toolkit. Basically, the idea is to lean into stocks that are working and lean away from stocks that are not working. If that sounds easy, simple and straightforward, that's because it is!
This week, I noticed...
READ MORE
MEMBERS ONLY
Several Key Indexes Testing Important Support
by Martin Pring,
President, Pring Research
It's never a good idea to try and predict contra-trend moves in a strong equity bull market, because the benefit of the doubt always goes with the prevailing trend. If false moves develop, they have a strong tendency to develop on the downside. That said, several key indexes...
READ MORE
MEMBERS ONLY

Markets Broaden Out While Leadership Re-Emerges
by Mary Ellen McGonagle,
President, MEM Investment Research
In this episode of StockCharts TV'sThe MEM Edge, Mary Ellen reveals the "Anatomy Of A Downtrend Reversal" with tools to help spot when it's safe to get back into a stock that's pulled back. She also shares top turnaround candidates in each...
READ MORE
MEMBERS ONLY
Can Transportation Lead the Market Higher?
Mish's Economic Modern Family is made up of 5 key sectors and 1 index. Each member has been specifically chosen to help investors/traders navigate the market by giving an easy way to see emerging trends and important price levels.
The Family consists of:
* Granddad Russell 2000 (IWM)...
READ MORE
MEMBERS ONLY

Tech Is a Drag
by Julius de Kempenaer,
Senior Technical Analyst, StockCharts.com
There is no doubt about it; Tech(nology) is an important sector. As a matter of fact, it is a crucial sector. At 26% weight inside the S&P 500 index, technology is twice as big as the next biggest sector -- Health Care at 13% -- and number...
READ MORE
MEMBERS ONLY

Balance: How It Puts Money In Your Pocket, And How You Can Achieve It

by Gatis Roze,
Author, "Tensile Trading"
I just revisited the past 30 years of my trading journals. The objective of my little research study was to investigate whether there was a discernible correlation between my actual annual investment performances and if they were impacted by what I'll label as my "personal annual equilibrium...
READ MORE
MEMBERS ONLY

ALUMINUM AND STEEL STOCKS BOOST MATERIALS -- HOMEBUILDERS CONTINUE TO BREAK OUT -- CHIP LEADERS
by John Murphy,
Chief Technical Analyst, StockCharts.com
MATERIALS NEAR RECORD... In a generally positive market day, materials are one of the days strongest sectors. Chart 1 shows the Materials Sector SPDR (XLB) gapping higher and nearing a new record. It's being led higher by aluminum and steel stocks which are also having a strong day....
READ MORE
MEMBERS ONLY

Out on a Limb: Market Top is Coming!

by Larry Williams,
Veteran Investor and Author
In this special presentation, Larry goes "way out on a limb" and gives a market forecast based on the tools he trusts and wants to share with you. So how can we see the future? Through seasonals, cycles, intermarket relationships, technical strength/weakness and, economic data.
This video...
READ MORE
MEMBERS ONLY
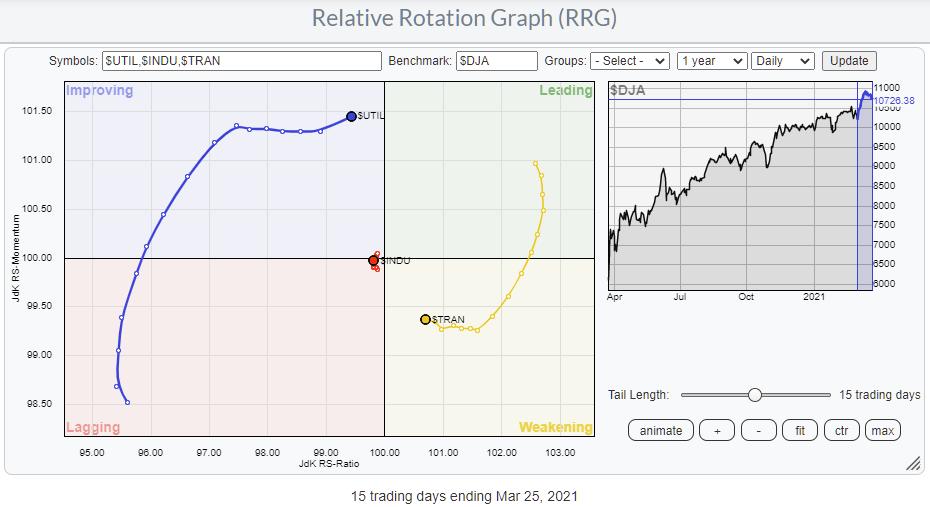
Is the Dow Theory Sending Us a Message?
by Julius de Kempenaer,
Senior Technical Analyst, StockCharts.com
The Dow theory is more than 100 years old, but still holds value today. Sometimes simple things can help you paint a clearer picture for yourself.
One of the principles of the Dow Theory is that "Indices Must Confirm Each Other." Basically, this means that signals or trends...
READ MORE
