MEMBERS ONLY
The Chart You Need to Stay Bullish

by David Keller,
President and Chief Strategist, Sierra Alpha Research
I have learned over my career to be skeptical. I have learned to question my investment thesis and actively argue the other side of any position to challenge my own analysis. I have learned to actively search out people that disagree with me and try to see what they are...
READ MORE
MEMBERS ONLY

Big Moves Ahead for These Areas!

by Mary Ellen McGonagle,
President, MEM Investment Research
Is it time to buy the dip? In this episode of StockCharts TV'sThe MEM Edge, Mary Ellen reviews new areas of the market, as well as select stocks that are showing relative strength and are poised to trade higher. She also shares her outlook on recovery areas that...
READ MORE
MEMBERS ONLY

The Name is Value, Growth to Value....

by Julius de Kempenaer,
Senior Technical Analyst, StockCharts.com
The Growth/Value relationship is always interesting to keep an eye on -- but even more so recently.
For a long period of time, roughly from late 2018 until Q3 2020, Growth stocks were beating Value hands down.
The chart above shows the Growth/Value relationship in the big pane...
READ MORE
MEMBERS ONLY

10-YEAR YIELD IS SPIKING OVER 1.60% AND MAY BE HEADING TOWARD 2.00%

by John Murphy,
Chief Technical Analyst, StockCharts.com
10-YEAR YIELD EXCEEDS 1.60%...After a modest consolidation, bond yields are spiking again. The daily bars in Chart 1 show the 10-Year Treasury yield climbing 10 basis points to 1.63% which puts it at the highest level in more than a year. The weekly bars in Chart 2...
READ MORE
MEMBERS ONLY
Chartwise Women: Is it Time to Enter or Exit?
by Mary Ellen McGonagle,
President, MEM Investment Research

by Erin Swenlin,
Vice President, DecisionPoint.com
Buying is easy, selling is much harder. In this week's edition of Chartwise Women, Erin and Mary Ellen concentrate on exit strategies. Follow along as both explain how they set stops and which key signals they use to exit their holdings. It doesn't have to be...
READ MORE
MEMBERS ONLY

NASDAQ LEADS TODAY'S RALLY -- TECHNOLOGY SPDR REGAINS 50-DAY LINE
by John Murphy,
Chief Technical Analyst, StockCharts.com
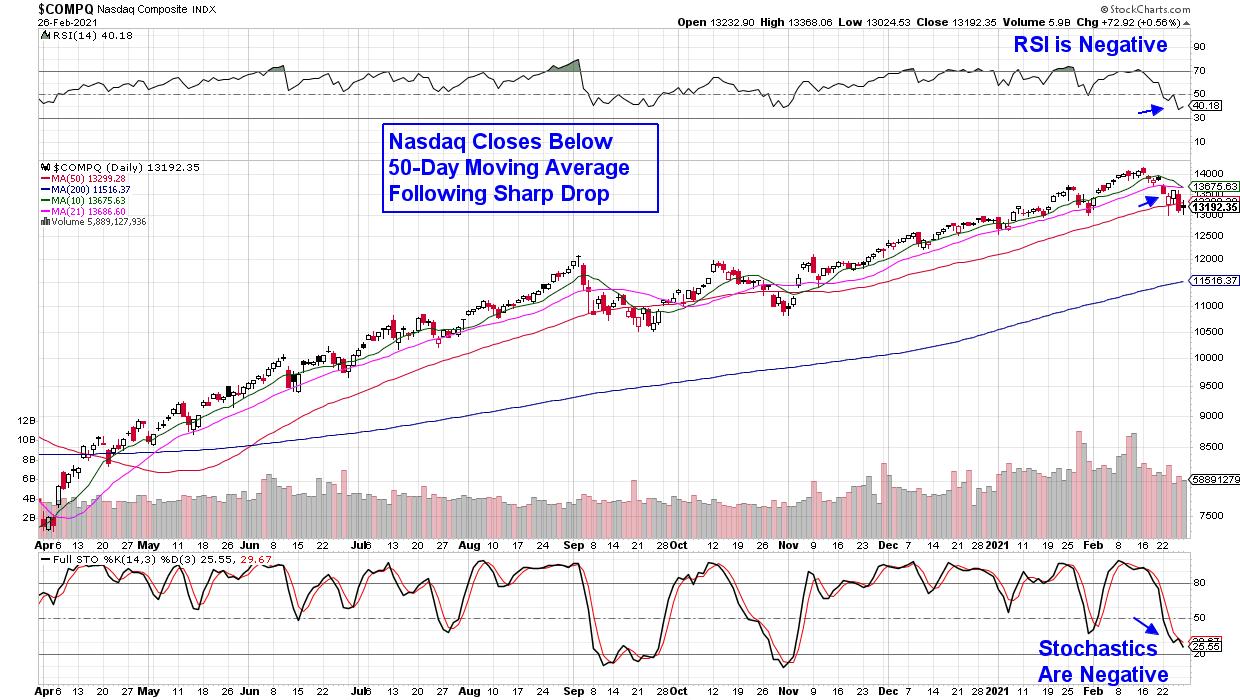
NASDAQ AND TECH SPDR REGAIN 50-DAY AVERAGE...The tech-dominated Nasdaq market led a broad rally in stocks today. Chart 1 shows the Nasdaq Composite Index gaining 2.5% and trading back above its 50-day moving average. It was the strongest of the three major stock indexes. The Dow Industrials and...
READ MORE
MEMBERS ONLY

How Long Will the Market Remain Choppy?
The market is confused and choppy. This can be seen by looking at the major indices, as most disagree with each other. This is important because when the overall market moves together, it makes trading easier as it allows traders to better time their entries based on pullbacks and breakouts....
READ MORE
MEMBERS ONLY

DOW HITS NEW RECORD WHILE TECHNOLOGY LAGS -- SEMIS RUN INTO RESISTANCE -- DIP IN 10-YEAR YIELD MAY BE BOOSTING STOCKS
by John Murphy,
Chief Technical Analyst, StockCharts.com
TECH NEARS OVERHEAD RESISTANCE... While the Dow and S&P 500 are trading higher today, with the Dow in record territory, the tech-dominated Nasdaq market continues to lag behind the rest of the market. Chart 1 shows the Technology SPDR (XLK) nearing a test of its 50-day moving average...
READ MORE
MEMBERS ONLY

If I Can Do It, So Can You! (Part 2)

by Dave Landry,
Founder, Sentive Trading, LLC
In this edition of Trading Simplified, Dave returns to follow up on his last presentation. He focuses on his core methodology and shows how you, as a trader, can do it as well. Finally, Dave shows how to establish free positions.
This video was originally broadcast on March 10th, 2021....
READ MORE
MEMBERS ONLY

US Breaking Out Against the World, But the Stocks Doing it May Surprise You!

by Martin Pring,
President, Pring Research
Back in the opening week of the yearl I wrote an article entitled Four Charts and Four Themes of the First Half of 2021. Three of them - higher stocks, higher commodities and value starting to outperform growth - are so far on track, but my negative analysis concerning US...
READ MORE
MEMBERS ONLY
Which Megatrends Have the Hottest Trending Stocks?
When looking for stocks that will continue to perform in 2021, we can look at the megatrends that will continue to grow considering the pandemic will be in the rear-view mirror.
On top of the list of trends is blockchain technology-and alternative currency. With Bitcoin above 52k and stocks like...
READ MORE
MEMBERS ONLY

Sector Spotlight: USD Strength and Tech Weakness
by Julius de Kempenaer,
Senior Technical Analyst, StockCharts.com
In this edition of StockCharts TV's Sector Spotlight, I start with a look at what happened last week in terms of rotation for asset classes and sectors. After that, I put these rotations in longer-term perspective using weekly charts and Relative Rotation Graphs while overlaying the 12-month rolling...
READ MORE
MEMBERS ONLY

DP TV: Time to Play Defense
by Erin Swenlin,
Vice President, DecisionPoint.com

by Carl Swenlin,
President and Founder, DecisionPoint.com
In this episode of DecisionPoint, Carl and Erin dive into the SPY, particularly into the Technology Sector with Carl reviewing the FAANG+. Erin gives us a sector overview and discusses the new rotation into defensive areas of the market. She covers her favorite sectors and defensive industry groups to consider,...
READ MORE
MEMBERS ONLY

The Market's New Normal
Monday's strange price action looks as though the market shrugged off the stimulus money in some areas, yet not others. While there are many factors at play, the most notable shift is in big tech, which continues to show weakness.
The tech-heavy index Nasdaq 100 (QQQ) sold off...
READ MORE
MEMBERS ONLY

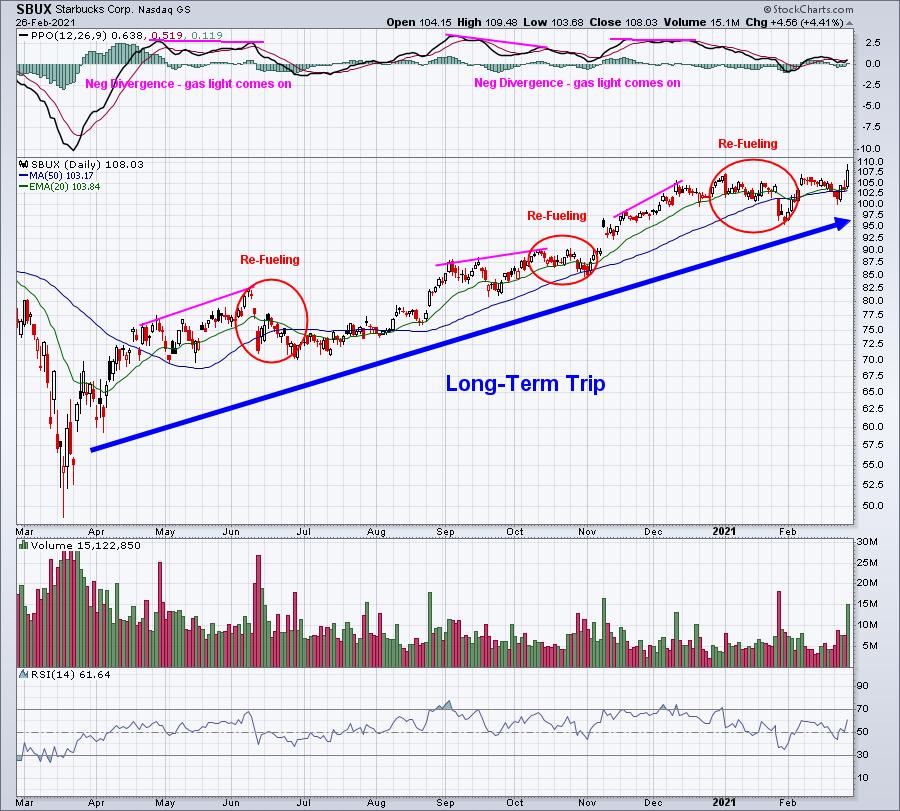
Divergences Don't End The Long-Term Journey - Part 2 of 2

by Tom Bowley,
Chief Market Strategist, EarningsBeats.com
In last weekend's Part 1 of 2, I discussed what divergences are and provided an analogy. Divergences can flash a refueling warning light during a long-term journey higher. If you recall, I illustrated it by using Starbucks (SBUX) as an example:
Divergences can mark long-term tops, but I&...
READ MORE
MEMBERS ONLY

SECTOR RANKINGS SHOW ENERGY, FINANCIALS, AND INDUSTRIALS IN THE LEAD -- WHILE CONSUMER DISCRETIONARY AND TECHNOLOGY LAG BEHIND -- A CHART LOOK AT ENERGY
by John Murphy,
Chief Technical Analyst, StockCharts.com
ENERGY STILL IN THE LEAD... After a hectic week when a rise in bond yields caused some profit-taking in technology stocks and the Nasdaq market, a strong jobs report on Friday helped stocks end the week on a strong note. One of the factors driving bond yields higher is expectations...
READ MORE
MEMBERS ONLY

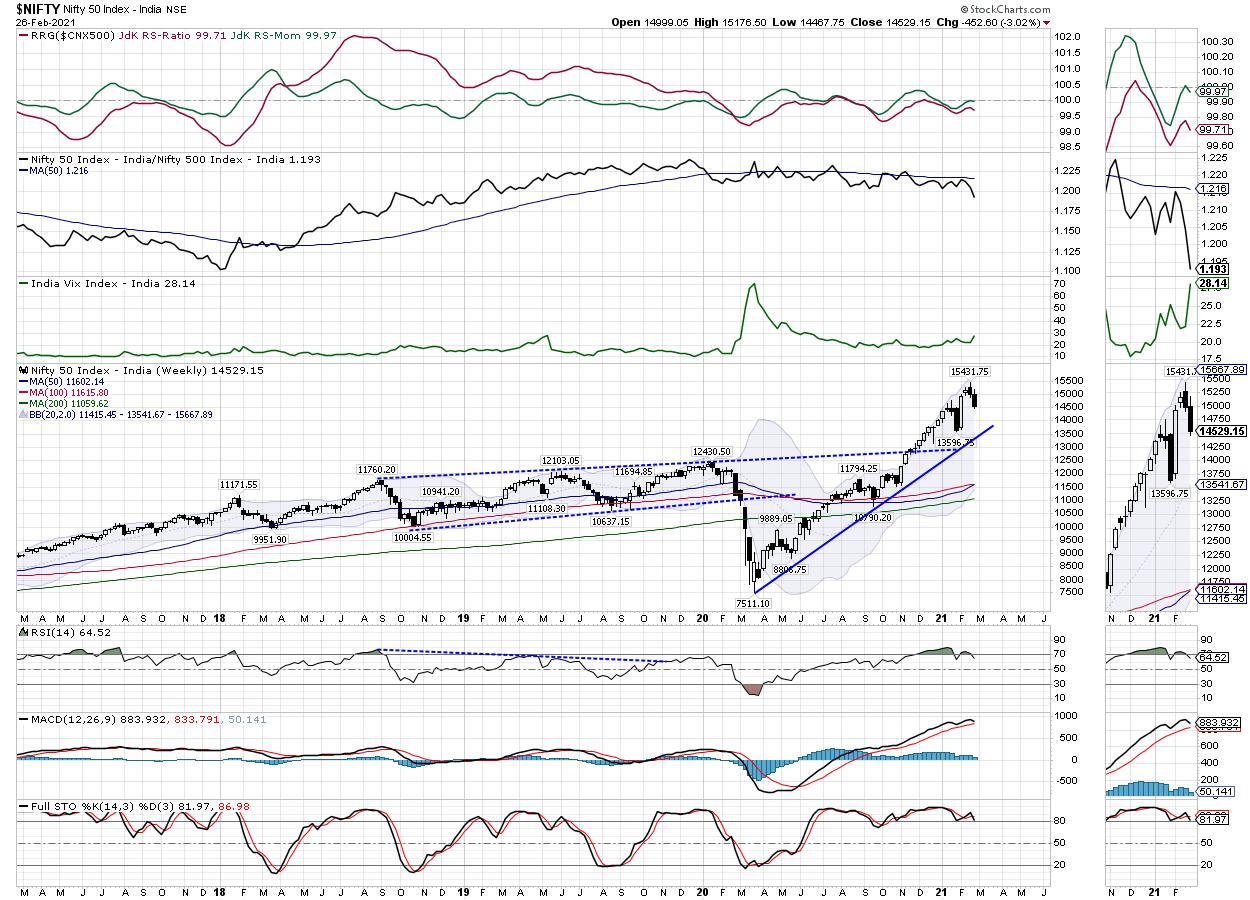
Week Ahead: These Signs Show Possibility of NIFTY Slipping in Broad Consolidation; This Index Moves Back Inside RRG Leading Quadrant

by Milan Vaishnav,
Founder and Technical Analyst, EquityResearch.asia and ChartWizard.ae
Both the trend and the sentiment in the equity markets were affected due to a spike in the US Treasury Bond yields, which had its obvious effect on the emerging markets in general. The spikes and the strengthening US Dollar index caused some gap down opening and corrective moves in...
READ MORE
MEMBERS ONLY

Why ETFs Are Best-Of-Breed For Only 50% Of Your Asset Classes

by Gatis Roze,
Author, "Tensile Trading"
This is an update to an important blog I wrote three years ago. Investors have once again been misled by the media and bamboozled by ETF sponsors such as iShares, SPDRs and Invesco. Exchange traded funds (ETFs) are not the panacea for every asset class as they all want you...
READ MORE
MEMBERS ONLY
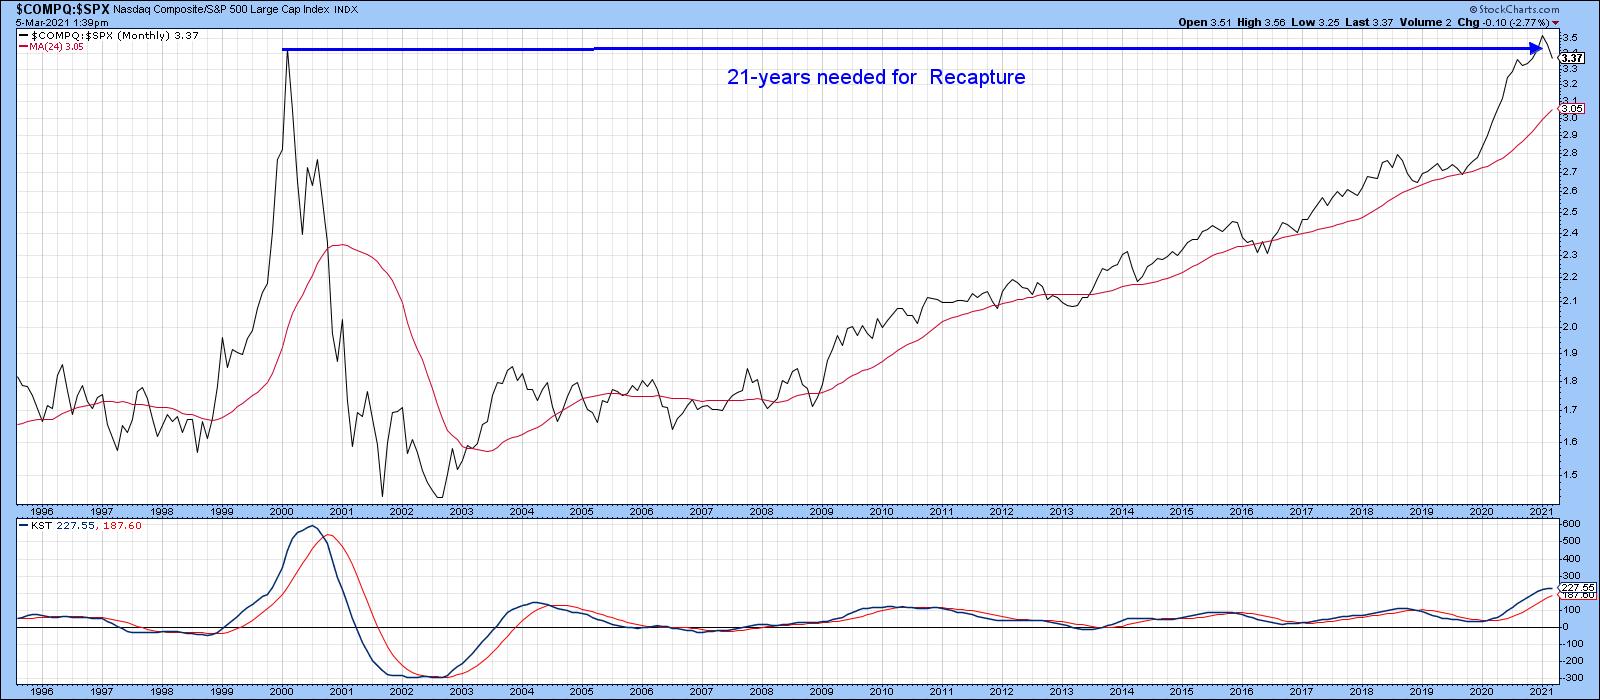
After 13 Years, a Key Multi-Year Sector Relationship May be Reversing - and Could Have Enormous Implications
by Martin Pring,
President, Pring Research
Technology, as reflected in the tech-dominated NASDAQ Composite, peaked as a group in 2000 and sank in popularity for the next 3 years. Since then, as shown by the relative graph in Chart 1, it has recaptured all of that lost ground. Now, its long-term KST may have started to...
READ MORE
MEMBERS ONLY
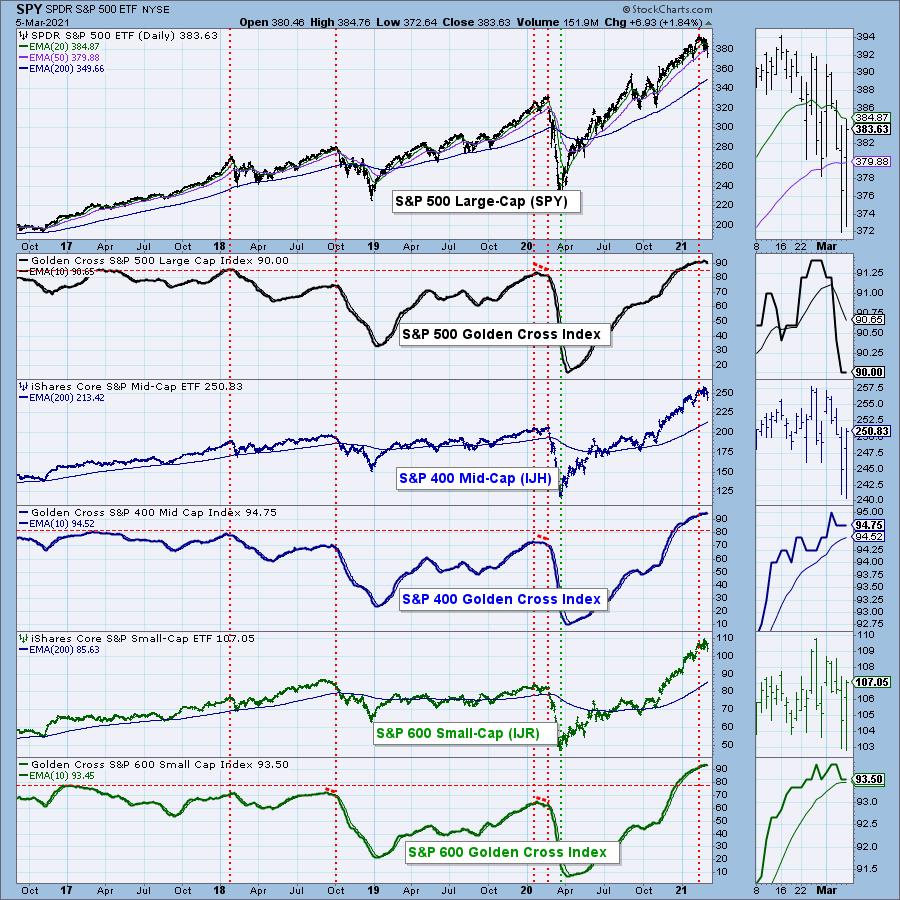
Beware of the Negative Crossover on the DecisionPoint "Golden Cross" Index
by Erin Swenlin,
Vice President, DecisionPoint.com
Carl Swenlin ingeniously created the newest DecisionPoint indicators, called the "Golden Cross Index" and "Silver Cross Index". It is actually a simple concept, and one he and I were both surprised hadn't been created yet.
Most are familiar with a "golden cross,"...
READ MORE
MEMBERS ONLY

Why You Should Watch Transportation (IYT) and Retail (XRT) Monday
The market has stopped the bleeding with a rally into Friday's close. The Small Caps index Russell 2000 (IWM) held over its 50-day moving average of 213.40. Additionally, the retail (XRT) and transportation (IYT) sectors never broke under their 50-DMAs, with IYT going on to clear its...
READ MORE
MEMBERS ONLY
Are the Markets Safe Again?
by Mary Ellen McGonagle,
President, MEM Investment Research
Is it time to buy the dip? In this episode of StockCharts TV'sThe MEM Edge, Mary Ellen reviews what to be on the lookout for with stocks reversing their downtrends, while also highlighting attractive charts in strong areas of the market.
This video was originally recorded on March...
READ MORE
MEMBERS ONLY
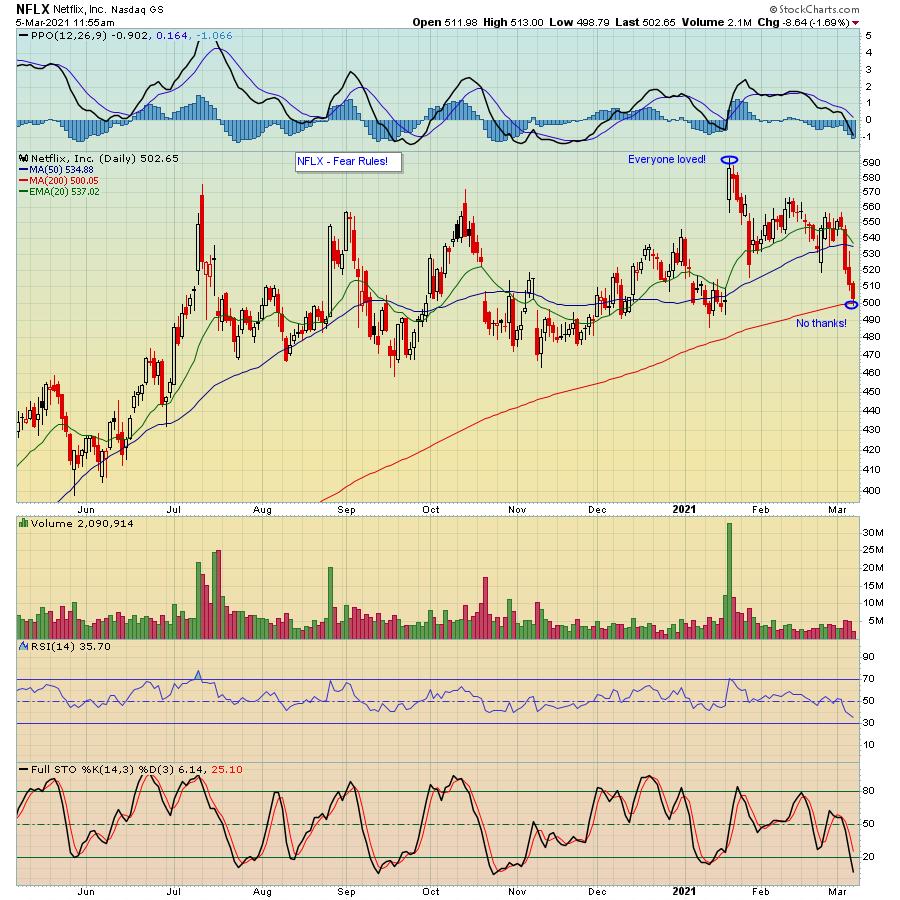
Here's a Stock That Deserves Your Attention

by John Hopkins,
President and Co-founder, EarningsBeats.com
Everyone is giving up on growth stocks, especially given the sharp rise in rates, with the 10 Year US Treasury Note rising as high as 1.62% on Friday. And now, any good news - i.e., a solid jobs report - is seen as bad news, with concerns of...
READ MORE
MEMBERS ONLY
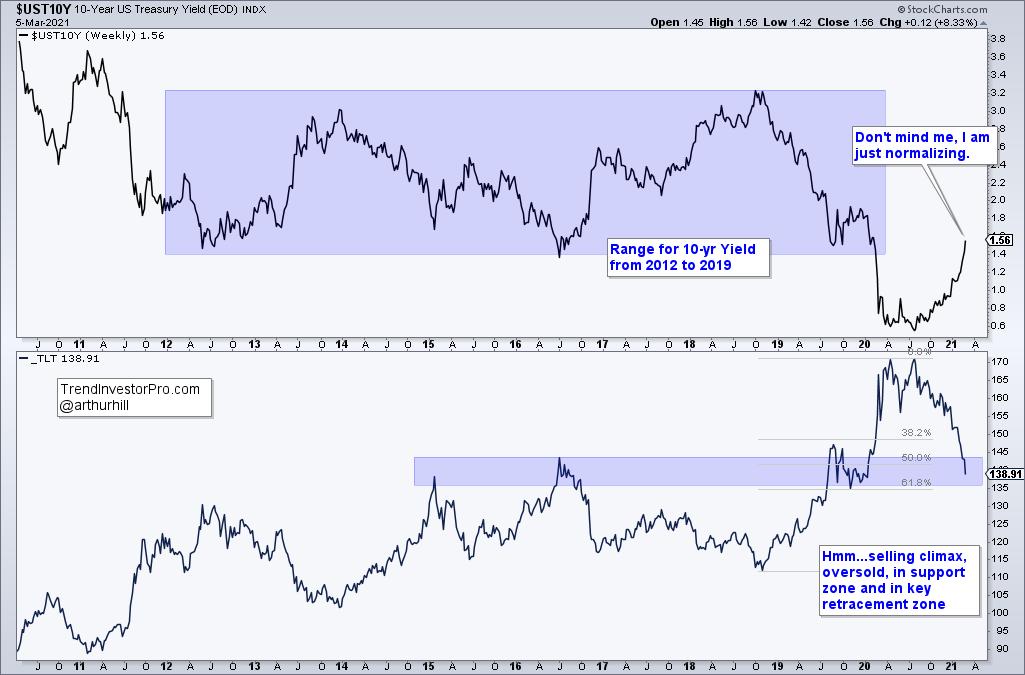
Does the 10-Year Yield Really Matter?

by Arthur Hill,
Chief Technical Strategist, TrendInvestorPro.com
Two items are dominating the news narrative right now: the rise in interest rates and the decline in tech stocks. Are rising rates really an issue for tech stocks? The charts suggest that the evidence is mixed, at best. In fact, it is not very hard to find periods when...
READ MORE
MEMBERS ONLY
Chartwise Women: Stocks Bucking the Downtrend!
by Mary Ellen McGonagle,
President, MEM Investment Research
by Erin Swenlin,
Vice President, DecisionPoint.com
In this week's edition of Chartwise Women, Mary Ellen and Erin share their outlook for the current market while also reviewing select growth, high-yield and headline-making stocks that have positive charts in an otherwise dismal environment.
This video was originally recorded on March 4th, 2021. Click on the...
READ MORE
MEMBERS ONLY
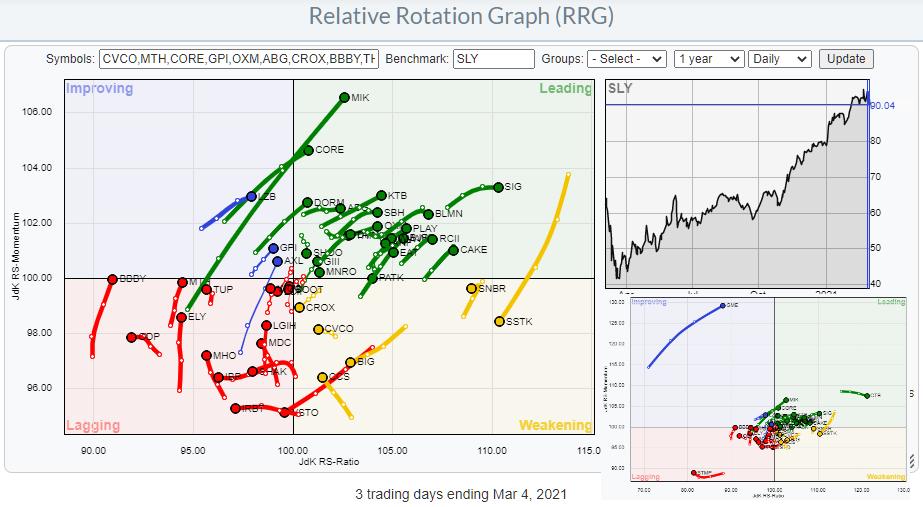
KTB Holds while SLY, SPY and PSCD Drop
by Julius de Kempenaer,
Senior Technical Analyst, StockCharts.com
Recently, I have been talking and writing about small-cap sectors and especially how the small cap segment in the consumer discretionary sector, the PSCD ETF, is currently diverging from its large cap counterpart, XLY. For this article I have collected the top 50 members in PSCD (Invesco), and there are...
READ MORE
MEMBERS ONLY

JUMP IN BOND YIELDS WEIGH ON STOCKS -- S&P 500 TRADES BELOW ITS 50-DAY AVERAGE
by John Murphy,
Chief Technical Analyst, StockCharts.com
BOND YIELD JUMPS... Bond yields are spiking higher again today following dovish remarks from Jerome Powell. Chart 1 shows the 10-Year Treasury yield jumping 7 basis points to 1.54% and putting in on track for the highest close in more than a year. As a result, stocks are coming...
READ MORE
MEMBERS ONLY

Which Key Sectors Have the Ability to Support the Market
Wednesday was another disappointing day for the market as many short-term buyers from Tuesday got flushed out in the move lower. However, with a second down day, should we be worried about a potential correction? Or is the market still holding its main support?
To answer this, first let us...
READ MORE
MEMBERS ONLY

NASDAQ 100 LEADS MARKET LOWER AND FALLS FURTHER BELOW ITS 50-DAY AVERAGE
by John Murphy,
Chief Technical Analyst, StockCharts.com
NASDAQ 100 FALLS BACK BELOW 50-DAY LINE... Chart 1 shows the Invesco QQQ Trust losing -2.8% today and falling further below its 50-day moving average. Technology was the day's weakest sector along with consumer discretionary stocks. Eight of the eleven market sectors ended lower. More cyclical parts...
READ MORE
MEMBERS ONLY
How to Stay on the Right Side of the Market with This Special Tool
Tuesday was a choppy day for the market, which had sporadic price swings plus a large amount of volatility. These days are tough to trade, as they can make it hard to see the daily trend direction.
One tool that can help you decide whether you want to trade the...
READ MORE
MEMBERS ONLY
Sector Spotlight: Small Caps Secret Message
by Julius de Kempenaer,
Senior Technical Analyst, StockCharts.com
In this edition of StockCharts TV's Sector Spotlight, I go over the rotations for asset classes and sectors as they were traced out last week. While talking about the short-term rotations, I bring in the weekly RRGs and charts to find matching and therefore more reliable trends. After...
READ MORE
MEMBERS ONLY

After 13 Years, a Key Multi-Year Sector Relationship May be Reversing - and Could Have Enormous Implications
by Martin Pring,
President, Pring Research
Technology, as reflected in the tech-dominated NASDAQ Composite, peaked as a group in 2000 and sank in popularity for the next 3 years. Since then, as shown by the relative graph in Chart 1, it has recaptured all of that lost ground. Now, its long-term KST may have started to...
READ MORE
MEMBERS ONLY

RISING BOND YIELDS ARE WEIGHING ON GOLD
by John Murphy,
Chief Technical Analyst, StockCharts.com
GOLD SPDR CONTINUES TO WEAKEN...With all the talk about rising inflation and rising commodity prices, it may seem strange to see the gold market still in a downtrend. But it is. The daily bars in Chart 1 shows the Gold SPDR (GLD) falling to the lowest level since last...
READ MORE
MEMBERS ONLY

Playing Consumer Discretionary Through PSCD
by Julius de Kempenaer,
Senior Technical Analyst, StockCharts.com
In my article for last weekend's ChartWatchers newsletter, I wrote about a set of ETFs representing small-cap sectors and how they can be used in a Relative Rotation Graph. I also talk about it in this week's episode of Sector Spotlight. The crux is that looking...
READ MORE
MEMBERS ONLY

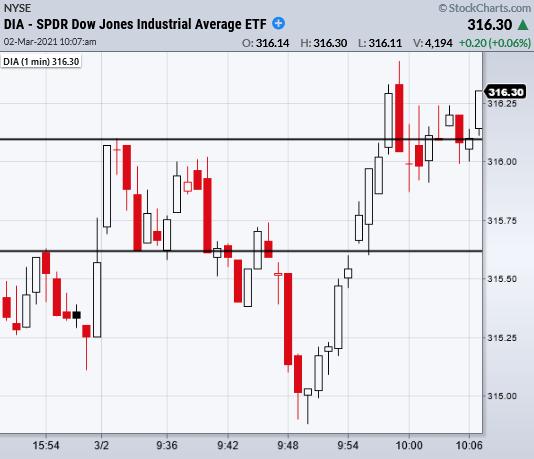
NASDAQ's 50-Day Moving Average Continues to Provide Price Guidance
Last Friday, the market ended on a cliffhanger. The Nasdaq 100 (QQQ) closed under its 50-day moving average, while the S&P 500 (SPY) and Dow Jones (DIA) teetered on the edge of their 50-DMAs.
Not only did the market gap higher Monday, but the QQQs ended the day...
READ MORE
MEMBERS ONLY
DP TV: No Inflation?! Know These Rules!
by Erin Swenlin,
Vice President, DecisionPoint.com
by Carl Swenlin,
President and Founder, DecisionPoint.com
In this episode of DecisionPoint, Carl and Erin discuss not only the current market conditions and indicators, but share "Farrell's Ten Rules" for all investors to know and remember! Carl gives us the current read on Bitcoin and GME, while Erin looks at the Dollar, Gold,...
READ MORE
MEMBERS ONLY
Secondary Downtrends in Primary Uptrends Create Opportunities
by Arthur Hill,
Chief Technical Strategist, TrendInvestorPro.com
With a pullback led by QQQ and the high flyers, several ETFs have become short-term oversold in a longer term uptrend. In Dow Theory terms, the primary trend for these ETFs is up and the secondary trend is down. A secondary downtrend within a primary uptrend is considered a correction...
READ MORE
MEMBERS ONLY
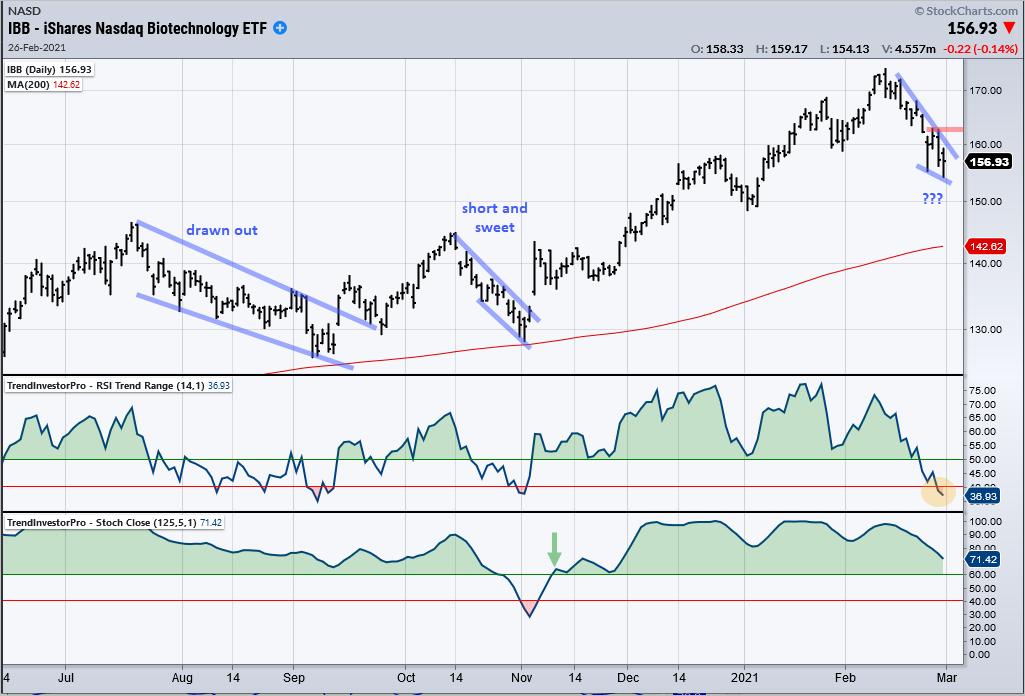
Divergences Don't End The Long-Term Journey - Part 1 of 2
by Tom Bowley,
Chief Market Strategist, EarningsBeats.com
When you look into a technician's "tool kit", you'll likely find a divergence analysis. Generally speaking, any time you have higher prices and lower (fill in the blank) or lower prices and higher (fill in the blank), there's either a negative divergence...
READ MORE
MEMBERS ONLY
Week Ahead: Technical Pullbacks Likely, But Upsides in NIFTY to Stay Capped; RRG Chart Shows This Sector Ending Relative Underperformance
by Milan Vaishnav,
Founder and Technical Analyst, EquityResearch.asia and ChartWizard.ae
In the previous weekly note, we had expected the markets to show limited upsides and had also noted some possibility of the NIFTY slipping into some consolidation. The previous week remained quite volatile and the NIFTY oscillated in a violent and volatile way for the first four days of the...
READ MORE
MEMBERS ONLY
One Key Signal That It's Time to Sell Your Stock
by Mary Ellen McGonagle,
President, MEM Investment Research
Every bull market cycle has its set of big, winning stocks – companies with strong fundamentals and increasing mutual fund sponsorship which helps propel these select stocks higher for huge gains. These leading names don't go up forever however, and it's important to know when to sell...
READ MORE
