MEMBERS ONLY

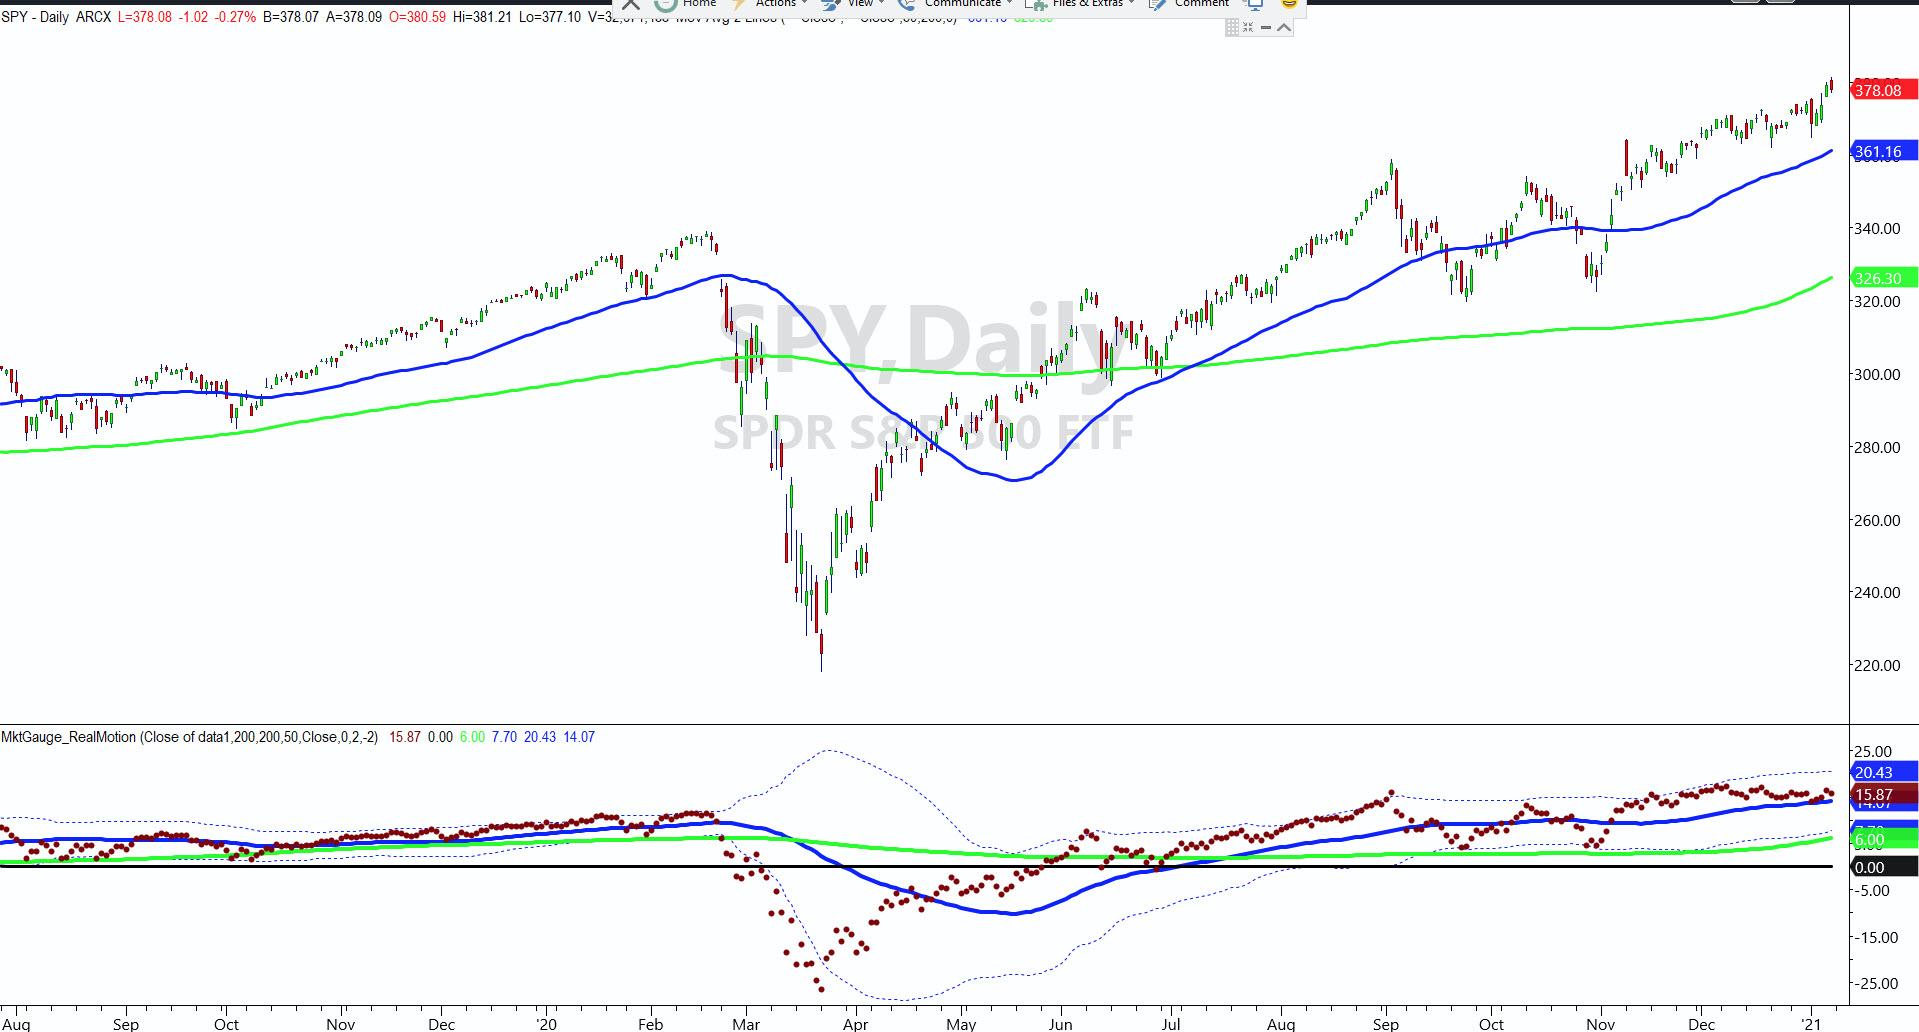
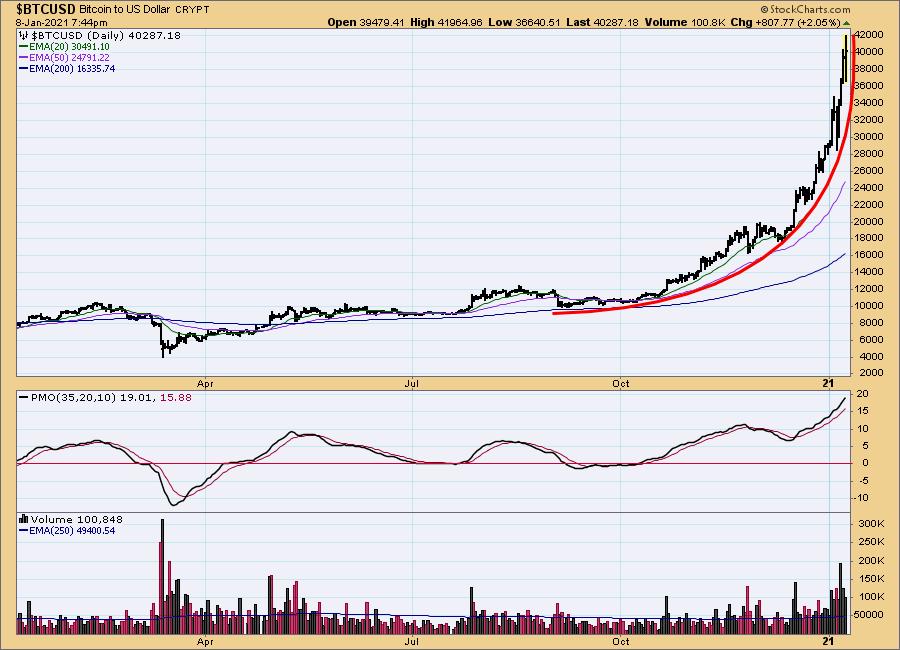
BITCOIN FINALLY CORRECTS

by John Murphy,
Chief Technical Analyst, StockCharts.com
BITCOIN CORRECTS VERY OVERBOUGHT CONDITION...The rally in bitcoin over the past year has been nothing short of spectacular. The daily bars in Chart 1 show how big that gain has been. Prices have gone from $4000 in the spring to $40000 last week. It also doubled in price from...
READ MORE
MEMBERS ONLY
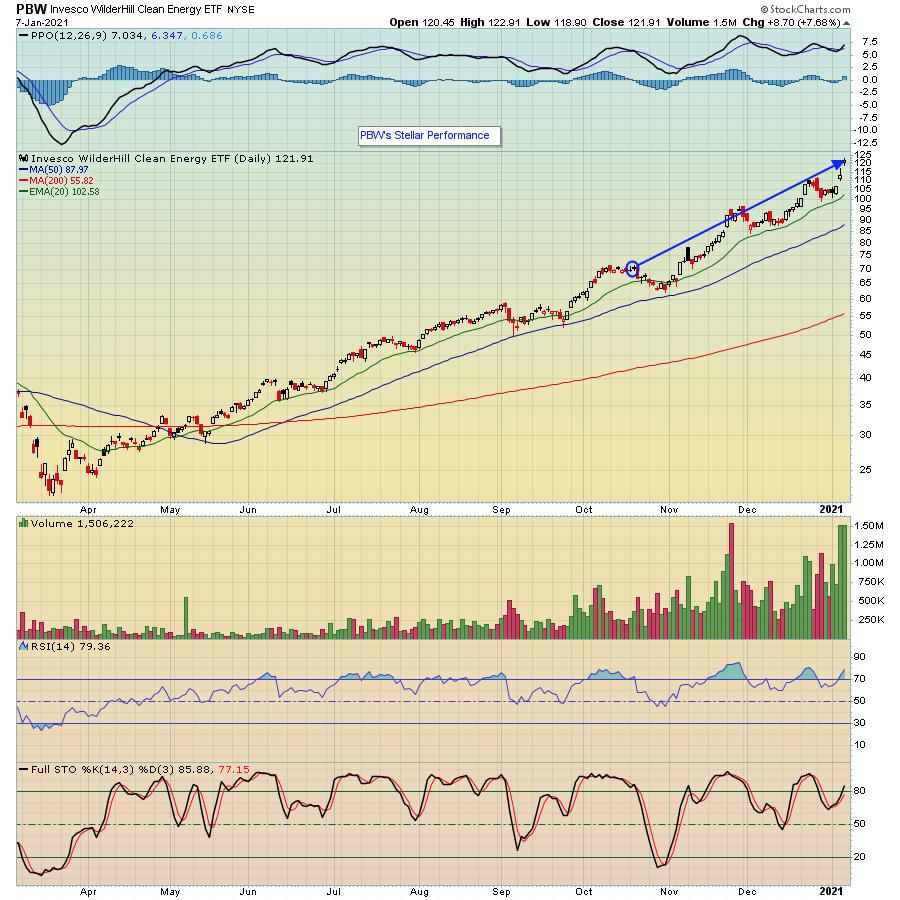
Searching For The Next Solar ETF And FREE Event This Morning

by Tom Bowley,
Chief Market Strategist, EarningsBeats.com
Whether you're investing in individual stocks or ETFs, finding that next BIG winner makes a huge difference in your absolute results and your relative results vs. a benchmark like the S&P 500. At EarningsBeats.com, we spend a great deal of time researching stocks and reviewing...
READ MORE
MEMBERS ONLY

Week Ahead: Buoyant NIFTY Stays Prone to Profit-Taking Bouts; RRG Chart Highlights Importance of Staying Selective

by Milan Vaishnav,
Founder and Technical Analyst, EquityResearch.asia and ChartWizard.ae
In a week that was a bit more volatile than the previous one, the Indian equities continued with their up move, ending once again on a lifetime high point. The trading range also widened over the past five sessions as the Index oscillated in the range of 414 points. On...
READ MORE
MEMBERS ONLY
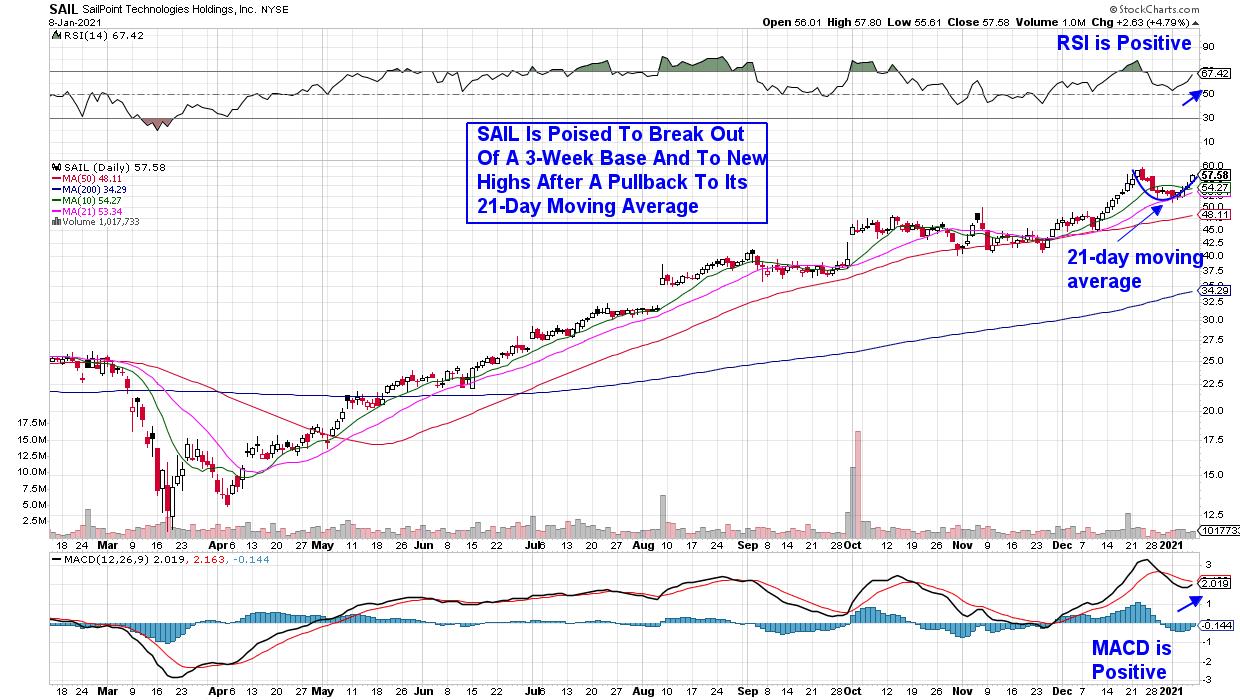
Stocks in This Leading Industry Group Have Lots More Upside!

by Mary Ellen McGonagle,
President, MEM Investment Research
Last month, the U.S. Government suffered its worst cyberattack in history, with many federal agencies being targeted by suspected Russian hackers.
The major data theft and security breach has corporations, as well as the government, ramping up spending to protect themselves. And with estimates calling for a 20% increase...
READ MORE
MEMBERS ONLY
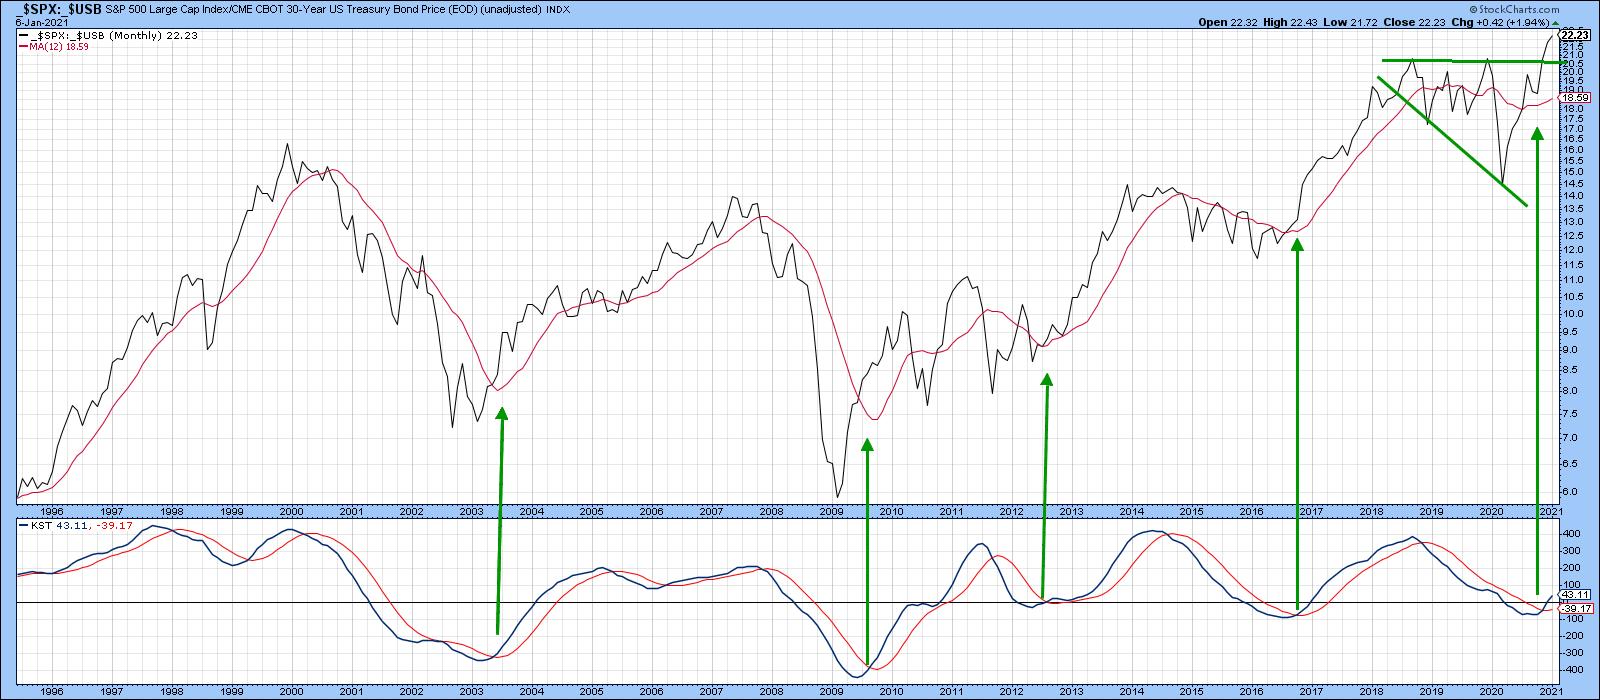
Five Charts and Four Themes for the First Half of 2021

by Martin Pring,
President, Pring Research
Prices are determined by the attitude of market participants to the emerging fundamentals. Fortunately for us technicians, these attitudes move in trends, and once a trend gets underway it tends to perpetuate. Provided it is not overstretched, we can reasonably assume that that trend will continue. It's in...
READ MORE
MEMBERS ONLY
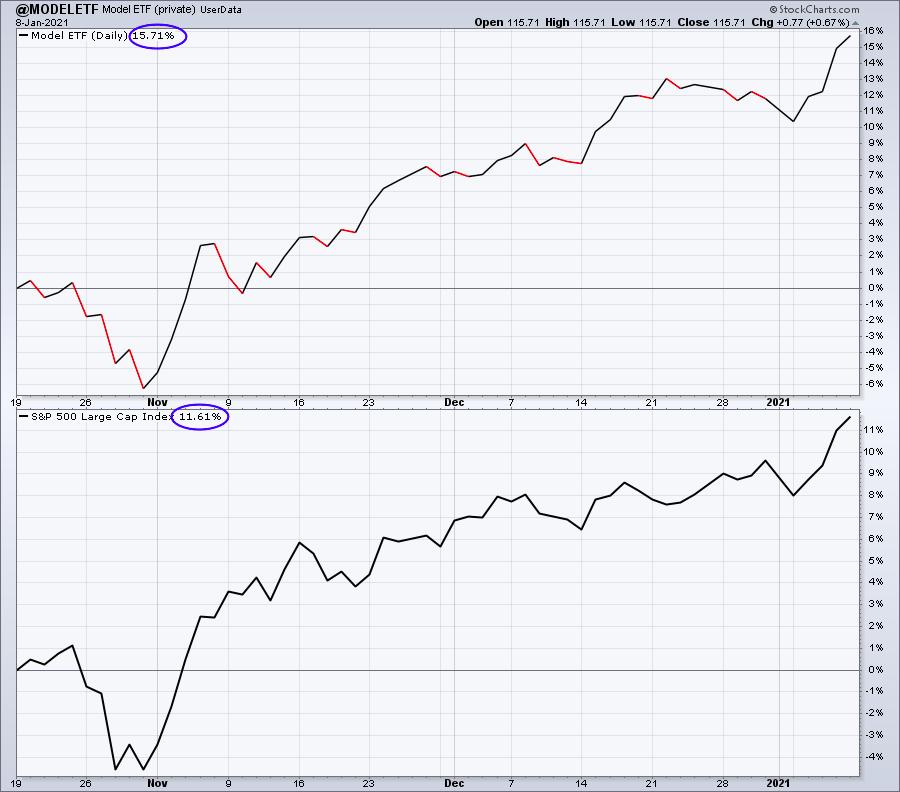
Building a Strong ETF Portfolio to Beat the S&P

by John Hopkins,
President and Co-founder, EarningsBeats.com
In my last ChartWatchers article, I mentioned that we had started a new ETF feature of the EarningsBeats.com service. This new feature is meant for those individuals who are interested in putting capital to work in ETFs as part of their trading strategy.
Our first ETF Portfolio consisted of...
READ MORE
MEMBERS ONLY

Bullish Blue Wave Spurs New Leadership
by Mary Ellen McGonagle,
President, MEM Investment Research
In this episode of StockCharts TV'sThe MEM Edge, Mary Ellen examines new areas of leadership as the markets respond to a full-blue Senate and House. In addition to highlighting specific stocks, she also shares how to screen for top candidates among new leadership areas.
This video was originally...
READ MORE
MEMBERS ONLY
Adding Momentum to Our Top 2021 Picks
It is only the end of the first week of January, and already many of our picks in Mish's Outlook 2021 have made big money.
However, in Friday's StockCharts TV video, Mish picks out 17 of the 57 stock picks and showed you the charts along...
READ MORE
MEMBERS ONLY
What Could Possibly Go Wrong?

by Erin Swenlin,
Vice President, DecisionPoint.com

by Carl Swenlin,
President and Founder, DecisionPoint.com
It is hard to see any downside when you're making a lot of money, which is why people can't resist a bubble. From the Tulip Mania, to DotCom Fever, to the Real Estate Crisis, for many people the appeal of easy and fast money cannot be...
READ MORE
MEMBERS ONLY
Tracking Trend Signals and Mean-Reversion Setups

by Arthur Hill,
Chief Technical Strategist, TrendInvestorPro.com
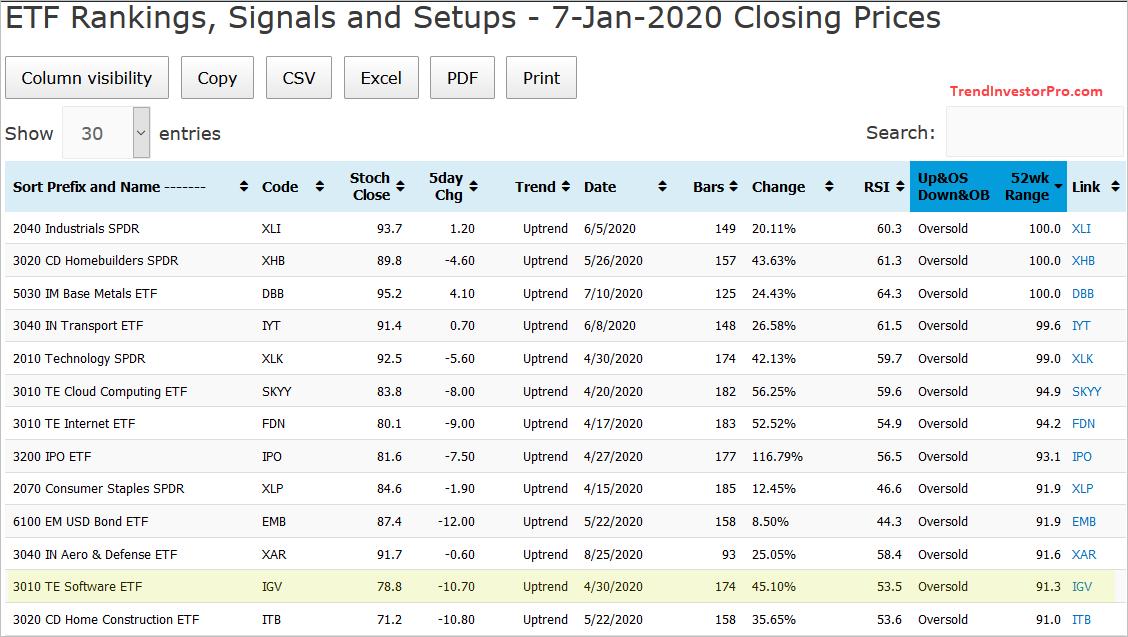
Tech-related ETFs are lagging over the last few weeks, but they are still in uptrends overall. This means bullish setups still matter so today we will look at a classic mean-reversion setup in the Software ETF (IGV).
The IGV setup came to light through the ETF Ranking, Trends and Setups...
READ MORE
MEMBERS ONLY
One Obstacle Every Investor Must Overcome To Enjoy Stock Market Success
by Tom Bowley,
Chief Market Strategist, EarningsBeats.com
The demon lies within. Listen, I know because I've had to overcome this demon. Stock market success - true, sound, market-beating success - didn't occur until I realized one thing. The stock market, collectively, is smarter than me. When I began constructing our stock portfolios at...
READ MORE
MEMBERS ONLY
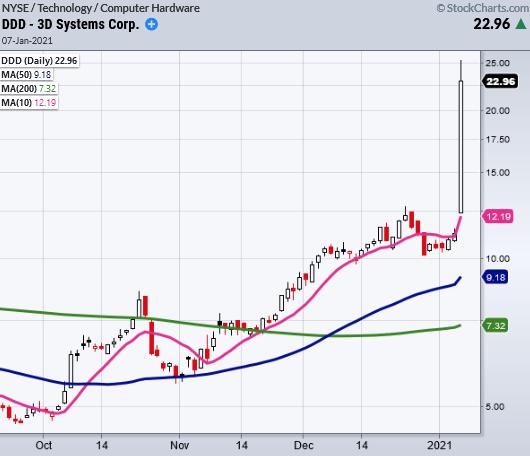
3D Printing Rings in the New Year!
Mish's Market Minute Advantage members bought DDD on November 9th. Then, the service added to the position on Wednesday, January 6th. Furthermore, Mish went on Real Vision on the 5th and told those attendees that she believed the stock would double.
Who could have imagined the stock would...
READ MORE
MEMBERS ONLY

Chartwise Women: Blue Wave Means Big Opportunities
by Mary Ellen McGonagle,
President, MEM Investment Research
by Erin Swenlin,
Vice President, DecisionPoint.com
In this week's edition of Chartwise Women, Mary Ellen and Erin start the new year by reviewing which sectors have the most upside potential following recent election results. They also share top candidates in those sectors and ways to screen for potential winners.
This video was originally recorded...
READ MORE
MEMBERS ONLY
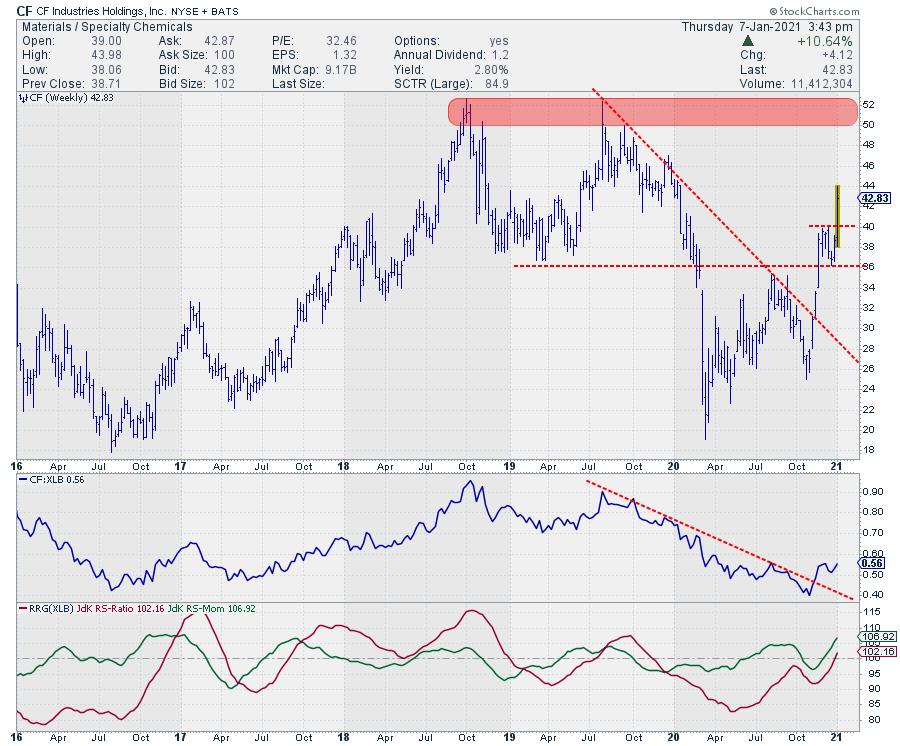
CF Industries Confirms Uptrend as it Moves Into Leading Quadrant on RRG

by Julius de Kempenaer,
Senior Technical Analyst, StockCharts.com
On the weekly RRG, XLB is inside weakening but rotating back towards the leading quadrant. On the daily RRG, XLB is pushing rapidly into leading from improving. This alignment makes the sector very interesting to watch in the coming days/weeks.
It is one of the seven sectors that are...
READ MORE
MEMBERS ONLY
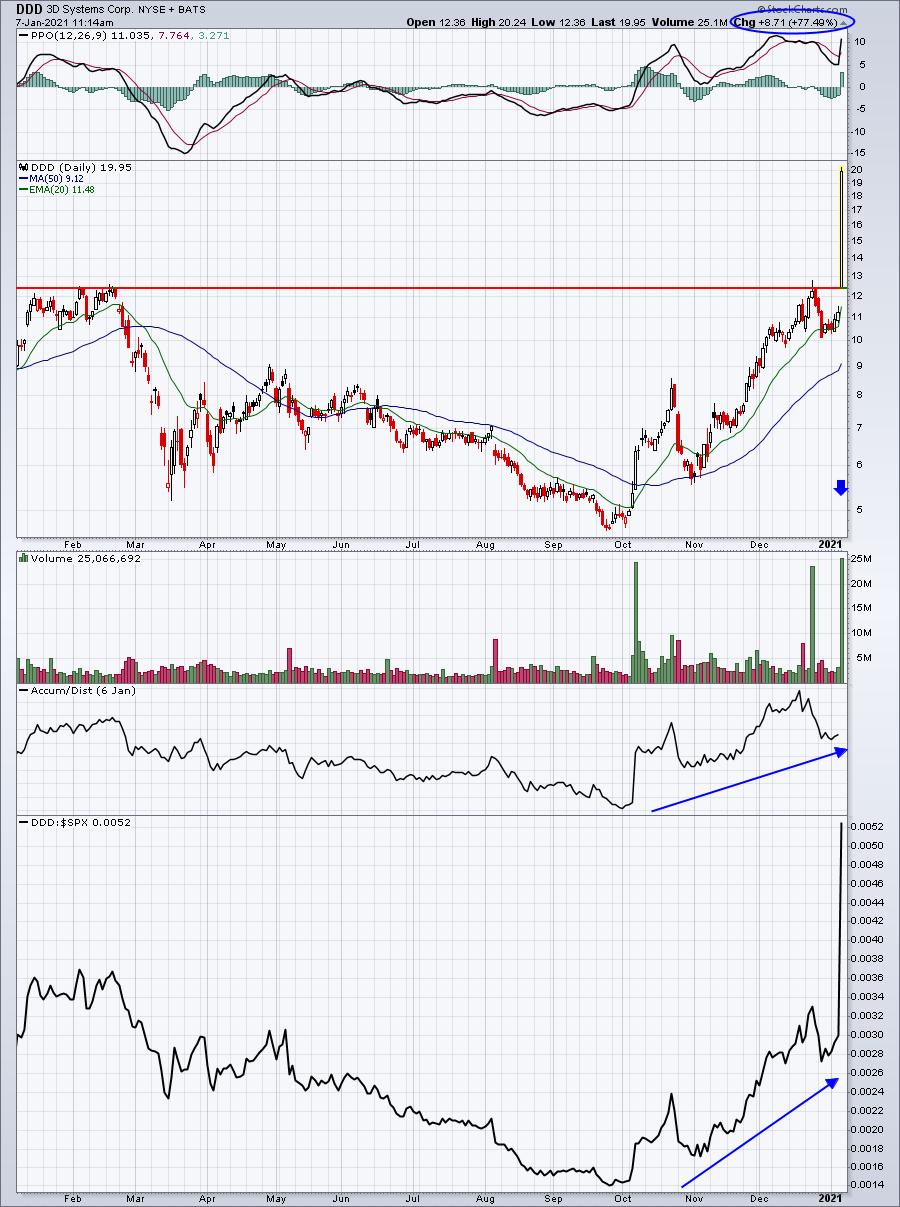
Massive Short Squeeze Taking Place In This Computer Hardware Stock Today
by Tom Bowley,
Chief Market Strategist, EarningsBeats.com
Imagine you're in a crowded theater, there's one small exit in the lower corner and someone yells, "FIRE!" Or perhaps you're the bottom grain of sand in an hourglass. That's what many of the short sellers likely feel like today...
READ MORE
MEMBERS ONLY
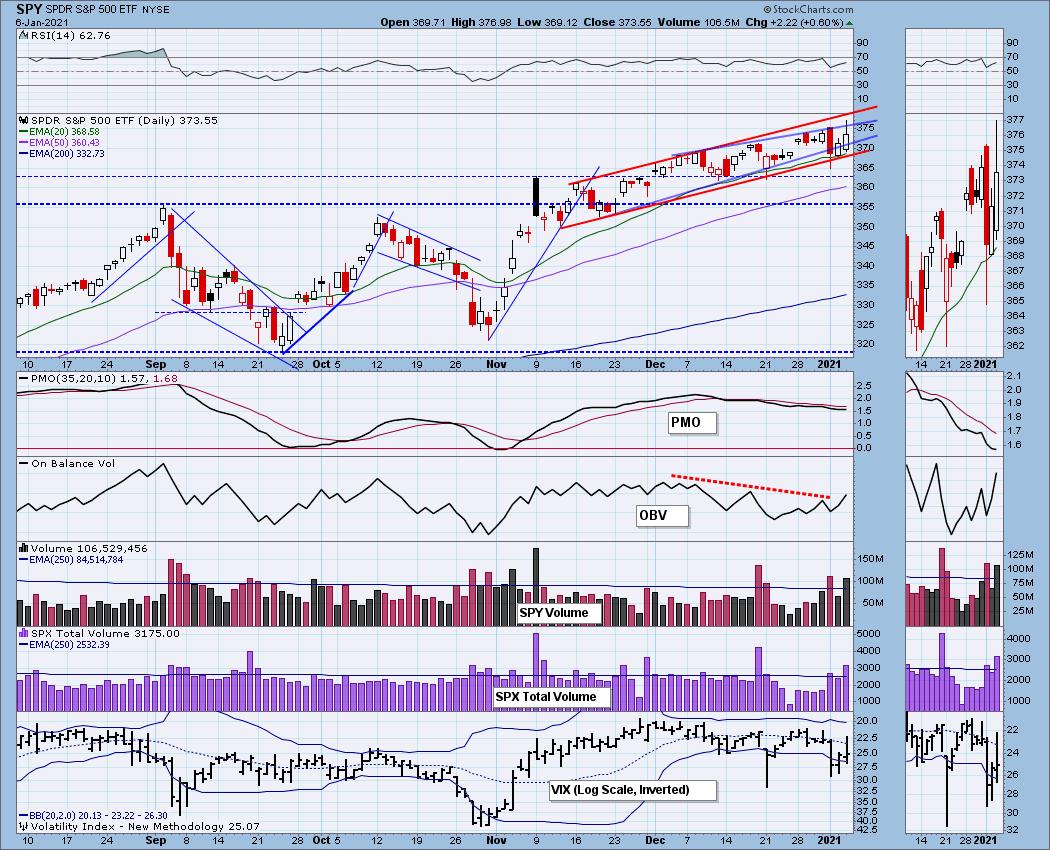
Rising Wedge Abandoned for Rising Trend Channel
by Erin Swenlin,
Vice President, DecisionPoint.com
Last night as I studied the 5-month candlestick chart, I debated whether to adjust the trendlines on the rising wedge that we've been monitoring. I was seeing a possible rising trend channel. I still believed there were enough bearish technicals, like an OBV negative divergence and a PMO...
READ MORE
MEMBERS ONLY

Four Charts and Four Themes for the First Half of 2021
by Martin Pring,
President, Pring Research
Prices are determined by the attitude of market participants to the emerging fundamentals. Fortunately for us technicians, these attitudes move in trends, and once a trend gets underway it tends to perpetuate. Provided it is not overstretched, we can reasonably assume that that trend will continue. It's in...
READ MORE
MEMBERS ONLY

Trading Hot IPOs

by Dave Landry,
Founder, Sentive Trading, LLC
In this edition of Trading Simplified, Dave continues discussing how to find and trade hot IPOs, including tips and tricks for trading them that Dave himself has found very useful of late. Dave also looks at a new Mystery Chart.
This video was originally broadcast on January 6th, 2021. Click...
READ MORE
MEMBERS ONLY

TEN-YEAR TREASURY YIELD EXCEEDS 1% FOR FIRST TIME SINCE MARCH -- THAT'S HELPING MAKE FINANCIALS THE DAY'S STRONGEST SECTOR -- MATERIALS AND INDUSTRIALS HIT RECORDS
by John Murphy,
Chief Technical Analyst, StockCharts.com
10-YEAR TREASURY YIELD EXCEEDS 1%... Bond yields and stocks are climbing sharply today on hopes for more stimulus spending. And the market is being led higher by more economically-sensitive stocks like financials, materials, energy, and industrials. Financials in particular are getting big boost from rising bond yields. Chart 1 shows...
READ MORE
MEMBERS ONLY

Seasonality is Nice but Reality Rules
by Julius de Kempenaer,
Senior Technical Analyst, StockCharts.com
Happy New Year!!!
Those of you who watch my weekly show Sector Spotlight on StockCharts TV will know that, towards the end of every month, I look at the seasonality for sectors going into the new month and then try to combine that with the actual rotations that are taking...
READ MORE
MEMBERS ONLY
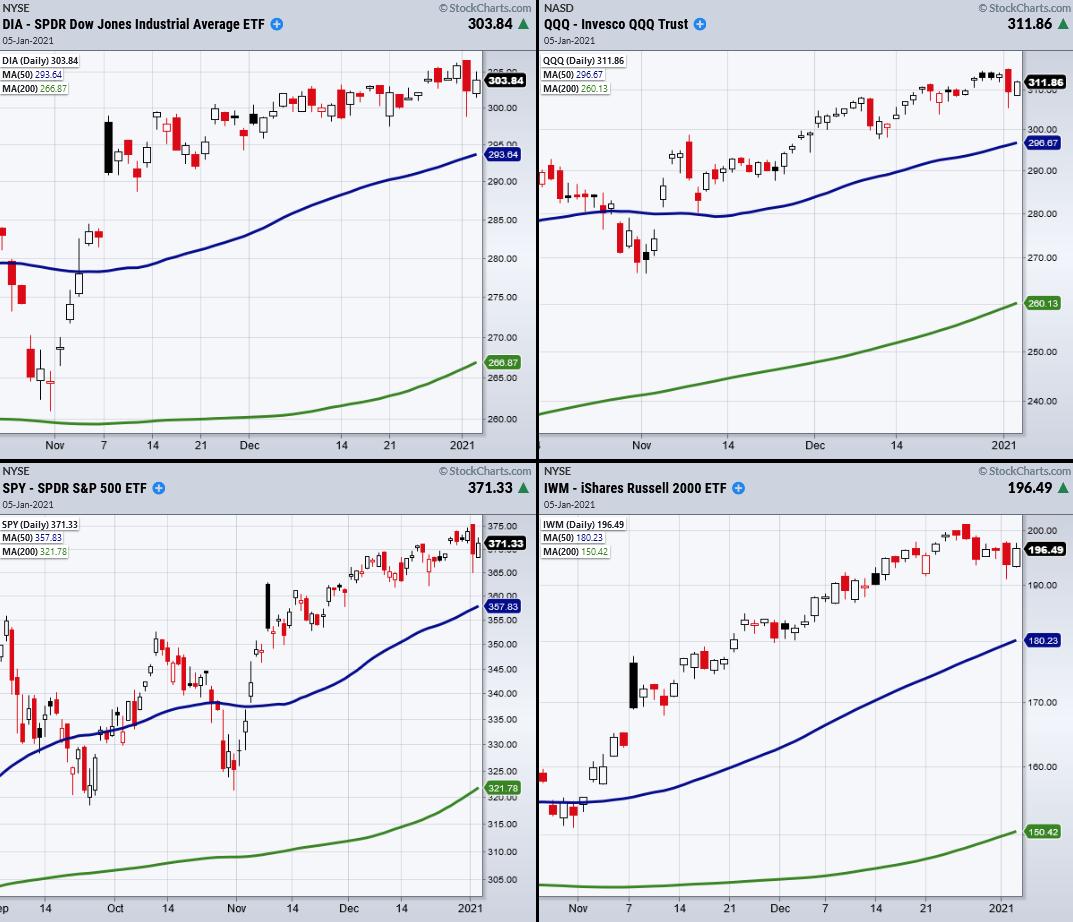
A Secret Setup Created by the Start of the New Year!
All the major indices closed with an inside day, meaning that today's price range fits completely inside the prior days price range. This can be seen in the above 4 charts.
Monday also brought us a new calendar range, as it was the first trading day of the...
READ MORE
MEMBERS ONLY

Sector Spotlight: 7 Sectors in Monthly Uptrends
by Julius de Kempenaer,
Senior Technical Analyst, StockCharts.com
In this edition of StockCharts TV's Sector Spotlight, I take a look at the rotations that took place in Asset Classes and Sectors during the last two weeks of December. After the break, I dive into the long-term trends for those asset classes and sectors using monthly charts....
READ MORE
MEMBERS ONLY

DP TV: Rising Wedge Resolves Downward
by Erin Swenlin,
Vice President, DecisionPoint.com
by Carl Swenlin,
President and Founder, DecisionPoint.com
The market opened the year with a bang as the SPY experienced an onslaught of selling. In this episode of DecisionPoint, Carl and Erin review the price action in conjunction with their indicators to determine if this is the beginning or the end of this selling climax. They take a...
READ MORE
MEMBERS ONLY

GOLD AND SILVER SURGE -- SILVER AND ITS MINERS ARE RISING FASTER -- STOCKS WEAKEN
by John Murphy,
Chief Technical Analyst, StockCharts.com
GOLD AND SILVER SURGE... A couple of recent messages described the price of gold being in a downside correction but finding support near its 200-day moving average. The most recent message showed both metals gaining more ground which suggested that their correction might be ending. Both precious metals are surging...
READ MORE
MEMBERS ONLY

2021 Outlook

by Larry Williams,
Veteran Investor and Author
In this special episode of Real Trading with Larry Williams, Larry presents his forecast for the coming year in the markets. He reviews his 2020 forecast, goes over what he thinks is going to happen in 2021 and shows how you can better understand the future of the markets.
This...
READ MORE
MEMBERS ONLY

Aerojet Soars

by Bruce Fraser,
Industry-leading "Wyckoffian"
Lockheed Martin (LMT) announced in December the acquisition of Aerojet Rocketdyne Holdings (AJRD) for $56 per share. From a Wyckoff perspective this appears to be a great deal for LMT. The Point and Figure chart indicates that Lockheed management knew they were purchasing an undervalued company. We typically think of...
READ MORE
MEMBERS ONLY

A Classical Bottom Formation in Place for This Stock
by Milan Vaishnav,
Founder and Technical Analyst, EquityResearch.asia and ChartWizard.ae
Chennai Petroleum Corp. Ltd -- CHENNPETRO.in
The long-term weekly chart of this stock offers some good classical ingredients in it: it hints at a potential bottom in place and a probable trend reversal going ahead from here.
The stock peaked near 480 in late 2017 and, ever since, has...
READ MORE
MEMBERS ONLY

Week Ahead: Weak Dollar Index May Continue Fueling Liquidity in Markets Unless It Pulls Up; RRG Chart Shows Strong Sectoral Setups
by Milan Vaishnav,
Founder and Technical Analyst, EquityResearch.asia and ChartWizard.ae
In a relatively very stable week, the Indian equity markets continued with their up move and have ended yet another week with gains. The volatility that was witnessed in the week before this one was absent. Instead of a wide 700-point wild move that was witnessed, the past five days...
READ MORE
MEMBERS ONLY

Insights, Lessons Learned And Skills Reinforced From 11 Market Wizards In 2020

by Gatis Roze,
Author, "Tensile Trading"
The catalyst for this blog is the new Stock Market Wizards book that happily appeared under my Christmas tree last week. When I opened this gift, I was in the midst of doing my own annual page-by-page review of my personal Traders Journal for the year 2020. Putting that aside,...
READ MORE
MEMBERS ONLY
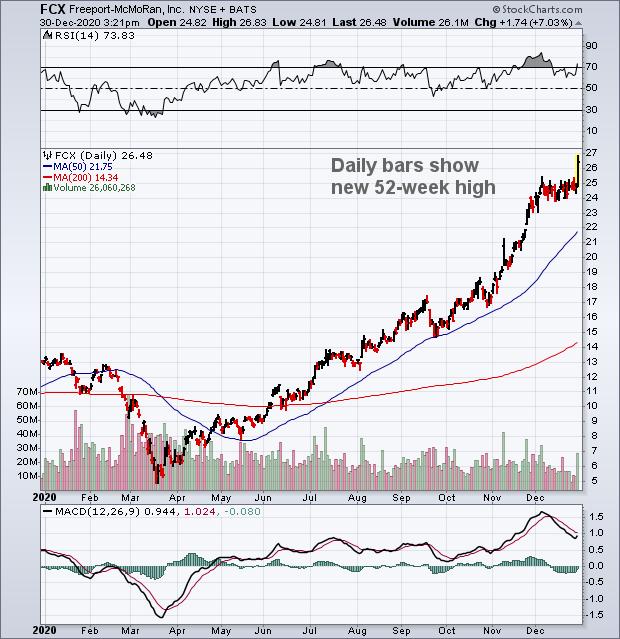
A Longer Term Look at Freeport McMoran Shows a New Bull Trend
by John Murphy,
Chief Technical Analyst, StockCharts.com
This article is about using charts in different time spans to gain a better perspective on an individual stock or any other market. I'm using copper producer Freeport McMoran (FCX) to make that point. I'm picking that stock because it's Wednesday's biggest...
READ MORE
MEMBERS ONLY
These Recovery Plays Are In Strong Buy Zones
by Mary Ellen McGonagle,
President, MEM Investment Research
Happy New Year!
The S&P 500 closed the year at a new high in price despite record new COVID-19 cases worldwide. A new, more contagious variant of the virus is also being ignored as investors are instead focused on an economic recovery buoyed by the rollout of vaccines....
READ MORE
MEMBERS ONLY
Pullback vs. Breakdown - Spotting the Difference
by Mary Ellen McGonagle,
President, MEM Investment Research
In this special workshop from StockCharts TV'sThe MEM Edge, Mary Ellen shares the best technical indicators to signal whether your stock is simply pulling back or headed into a downtrend. She also presents the ideal buy point for when your stock recovers from a pullback, as well as...
READ MORE
MEMBERS ONLY
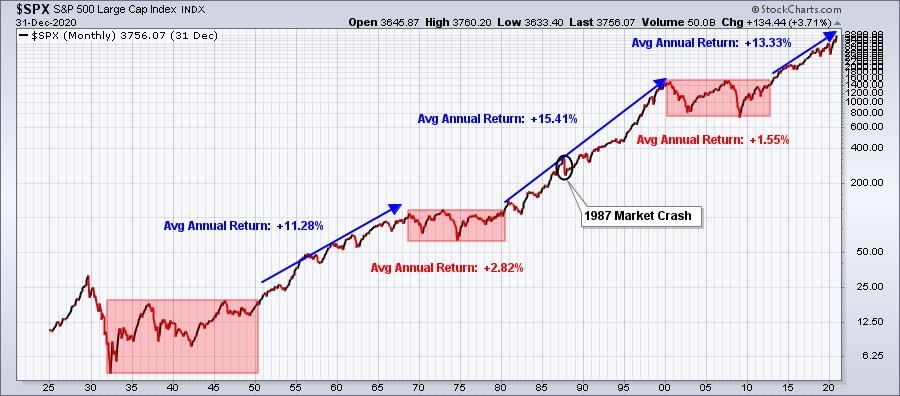
5 Things to Know About This Secular Bull Market
by Tom Bowley,
Chief Market Strategist, EarningsBeats.com
Happy New Year!
Many market pundits view every year in the stock market exactly the same. I do not. I believe there are "big picture" headwinds and tailwinds that impact the stock market in much the same way as currents impact fish attempting to swim upstream vs. downstream....
READ MORE
MEMBERS ONLY

Financials En-Route For a Strong Start in 2021
by Julius de Kempenaer,
Senior Technical Analyst, StockCharts.com
My first article for the Chartwatchers newsletter going into the new year... 2021!!
First of all, I wish all readers and watchers of Sector Spotlight a very happy and, above all, healthy new year. That "Healthy" part all of a sudden has gotten a whole new meaning after...
READ MORE
MEMBERS ONLY
Chartwise Women: Chart Patterns are Treasure Maps
by Mary Ellen McGonagle,
President, MEM Investment Research
by Erin Swenlin,
Vice President, DecisionPoint.com
In this remastered Chartwise Women archive workshop, Erin and Mary Ellen discuss the use of chart patterns in your trading decisions or as ways to add another dimension to your analysis. They look at some popular patterns that worked and some that did not work. Chart patterns can show you...
READ MORE
MEMBERS ONLY

Will 2021 Be Another 2010?

by David Keller,
President and Chief Strategist, Sierra Alpha Research
The end of the year tends to provide the perfect opportunity to reflect, renew and refocus. Hopefully, you've taken advantage of the Reflections 2020 specials on StockCharts TV, including my session on the Ten Questions You Should Ask Yourself at Year End!
I was asked recently by my...
READ MORE
MEMBERS ONLY

Why Gold Bugs Should Be Praying for the Demise of Commodities
by Martin Pring,
President, Pring Research
Last month, the gold price slipped down very closely towards its 12-month MA. This is not a perfect indicator, but most downside penetrations are followed by bearish action, so you could say that gold is at the crossroads. Chart 1 tells us that prices have bounced a bit since then,...
READ MORE
MEMBERS ONLY

A LONGER TERM LOOK AT FREEPORT MCMORAN SHOWS A NEW BULL TREND
by John Murphy,
Chief Technical Analyst, StockCharts.com
FREEPORT MCMORAN HITS NEW 52-WEEK HIGH... This article is about using charts in different time spans to gain a better perspective on an individual stock or any other market. I'm using copper producer Freeport McMoran (FCX) to make that point. I'm picking that stock because it&...
READ MORE
MEMBERS ONLY

Gold's Tortured Progress
by Carl Swenlin,
President and Founder, DecisionPoint.com
I frequently use the word "tortured" when discussing gold because so much of the time any progress it makes comes with great pain and suffering. In August GLD broke above the resistance line drawn across the 2011 price top. It was a decisive break, meaning that the breakout...
READ MORE
MEMBERS ONLY
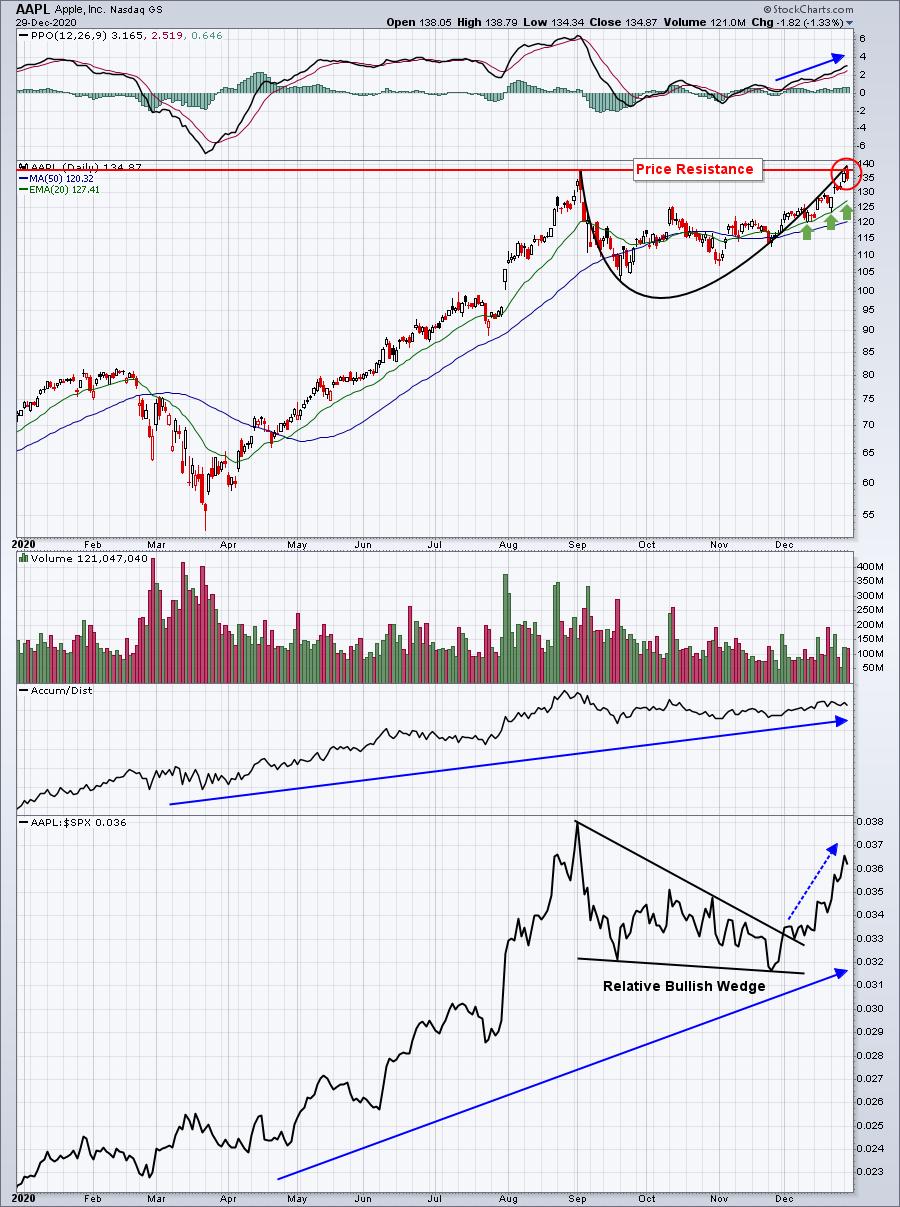
Apple (AAPL) Prints Reversing Candle, Short-Term Selling Possible
by Tom Bowley,
Chief Market Strategist, EarningsBeats.com
Candlestick charting can be very useful if you're a short-term trader, especially when you see a reversing candle at key price support or resistance. Yesterday, we saw a dark cloud cover candle form on more-than-average volume, suggesting to me that AAPL may have topped near-term. Make no mistake,...
READ MORE
