MEMBERS ONLY

Don't Forget This About Splits

by Carl Swenlin,
President and Founder, DecisionPoint.com
On August 31, AAPL stock split 4 for 1 and TSLA split 5 for 1. On several occasions prior to that date I tried to make DecisionPoint ALERT readers and DecisionPoint Show viewers aware that stock splits often occur in the vicinity of price tops. It doesn't happen...
READ MORE
MEMBERS ONLY
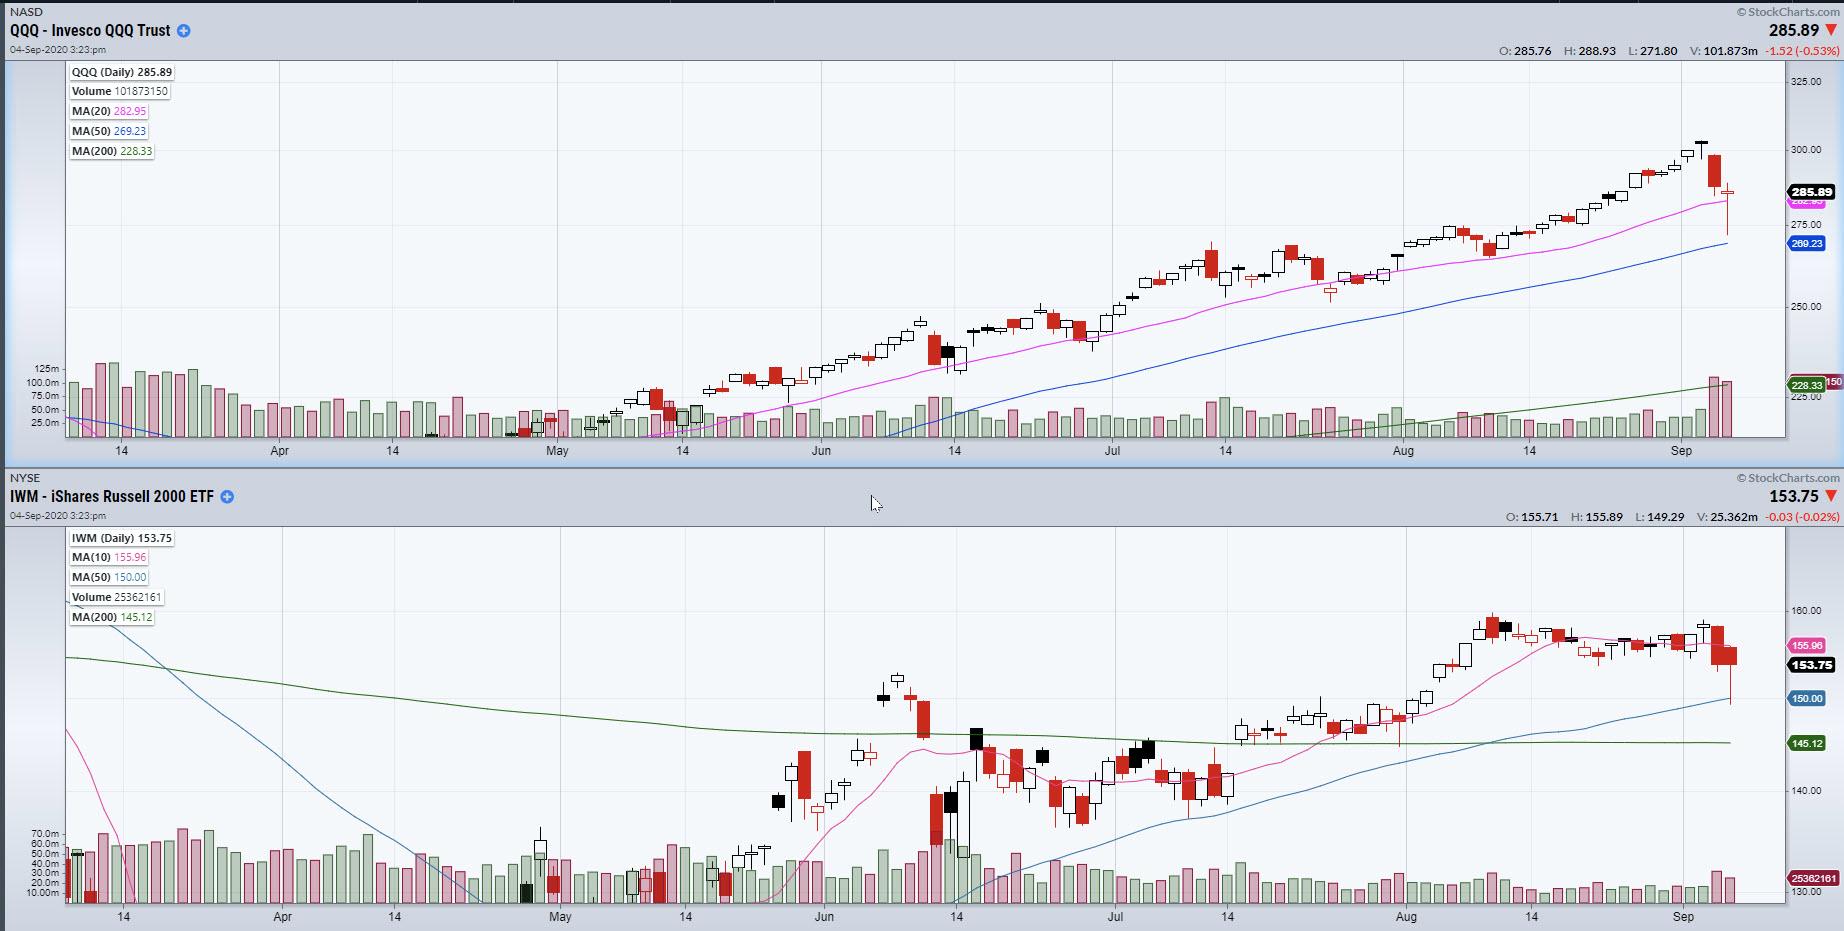
A Potential Break in the 50-DMA and Where to Look Next
Last Friday, we noted how major symbols (QQQ, IWM, JNK, SMH) bounced off the 50-DMA. Now, with the market still undecided, we can build a plan on what to look for if we break under the 50-DMA.
Let's take a look at the QQQs and the SPYs on...
READ MORE
MEMBERS ONLY

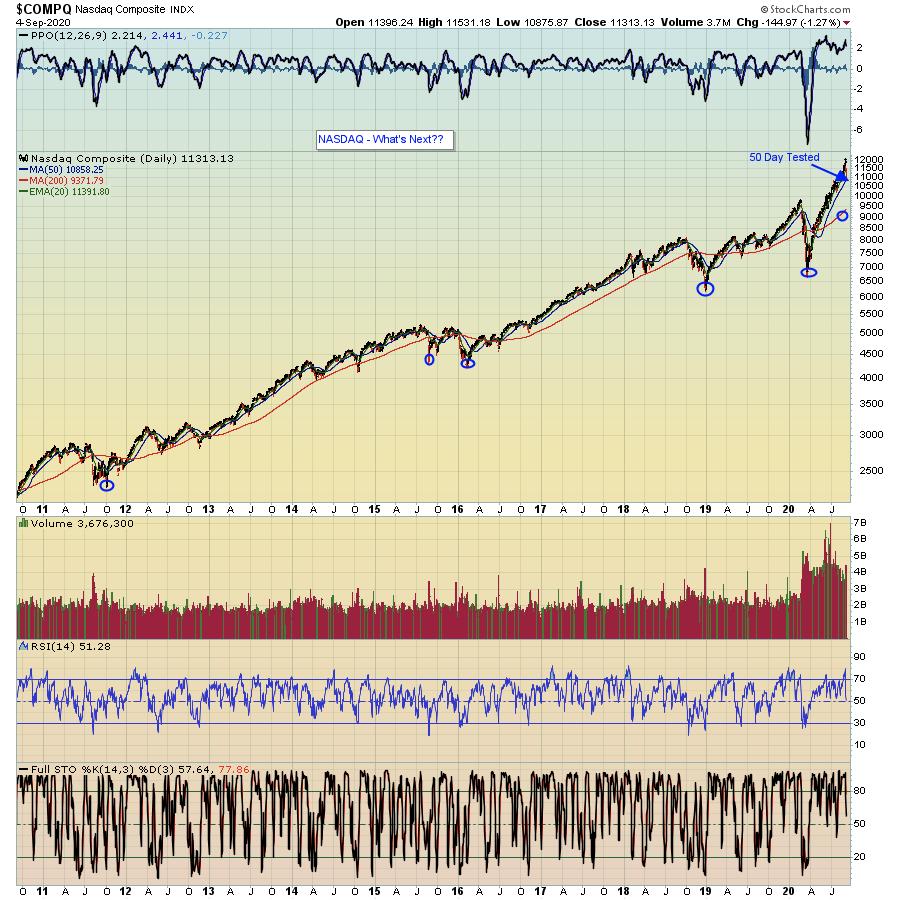
NASDAQ CONTINUES TO LEAD STOCKS LOWER -- AND IS TESTING ITS 50-DAY MOVING AVERAGE

by John Murphy,
Chief Technical Analyst, StockCharts.com
NASDAQ COMPOSITE IS TESTING ITS 50-DAY AVERAGE.. The tech-driven Nasdaq market continues to lead the market lower. Chart 1 shows the Nasdaq Composite Index in the process of testing its 50-day average. That's an important test for it and the rest of the market. Chart 2 shows the...
READ MORE
MEMBERS ONLY

Sector Spotlight: Long/Short Basket Up 8%

by Julius de Kempenaer,
Senior Technical Analyst, StockCharts.com
In this edition of Sector Spotlight, I break down the events of last week's volatile price action and how that translates into the tails on the Relative Rotation Graphs; I then put these price moves into a slightly longer-term perspective. Julius also dives into the Long/Short baskets,...
READ MORE
MEMBERS ONLY

Power Charting TV: A Study of the Current Market

by Bruce Fraser,
Industry-leading "Wyckoffian"
This weeks Power Charting episode sparked interest as it covered current market conditions and also the long term stock market cycle. Roman Bogomazov and I also discussed these topics in our weekly ‘Wyckoff Market Discussion' episode, which can now be viewed on-demand. Roman and I invite you to join...
READ MORE
MEMBERS ONLY

SPY: You Spin Me Right Round

by Arthur Hill,
Chief Technical Strategist, TrendInvestorPro.com
The S&P 500 SPDR (SPY) fell over 2% this week for the biggest weekly decline since June. The long-term trend is still up because SPY remains well above the rising 40-week SMA. However, a big Spinning Top candlestick formed last week and a volatility indicator ticked higher. Spinning...
READ MORE
MEMBERS ONLY

Week Ahead: Staying Above These Levels Crucial for NIFTY; RRG Chart Shows These Sectors Continuing to Outperform

by Milan Vaishnav,
Founder and Technical Analyst, EquityResearch.asia and ChartWizard.ae
In a wide-ranging trading week, the Indian equity markets halted their four-month winning streak. The NIFTY met its important pattern resistance, from which it reacted. Over the past five trading sessions, the NIFTY saw a trading range of close to 500 points. Amid volatile moves, it was a time for...
READ MORE
MEMBERS ONLY
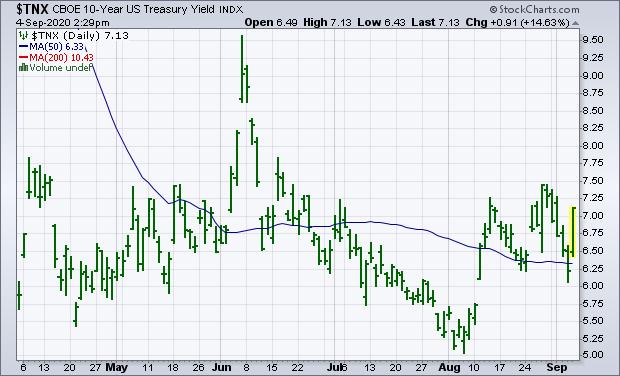
Strong Jobs Report Boosts Bond Yields
by John Murphy,
Chief Technical Analyst, StockCharts.com
This morning's strong jobs report saw a bigger than expected jump in nonfarm payrolls during August and a bigger than expected drop in the unemployment report to 8.4%. That strong combination helped contribute to today's rebound in bond yields. Chart 1 shows the 10-Year Treasury...
READ MORE
MEMBERS ONLY

Can the Markets Recover?

by Mary Ellen McGonagle,
President, MEM Investment Research
In this episode of StockCharts TV'sThe MEM Edge, Mary Ellen reviews last week's sharp selloff and provides a game plan going forward. She also shares bullish charts of companies poised to trade higher after withstanding the market's downward pressure, as well as how to...
READ MORE
MEMBERS ONLY
Many Stocks Just Got Cheaper - Now What?

by John Hopkins,
President and Co-founder, EarningsBeats.com
Anyone who has followed the market like I have through every possible scenario, from the dot-com bubble to 9/11 to the Great Recession to what we've seen the past few days, should have recognized that the market was getting VERY extended. When you start seeing Stochastics near...
READ MORE
MEMBERS ONLY
Did the 50-Day Moving Average Stop the Bleed?
After 2 major sell-off days, the market bounced late Friday off the 50-day moving average. Coincidence?
First, why do we care about the 50-day moving average? The most common inputs for the Moving Average used by traders and market analysts are the 50-, 100- and the 200-DMAs. Knowing a large...
READ MORE
MEMBERS ONLY
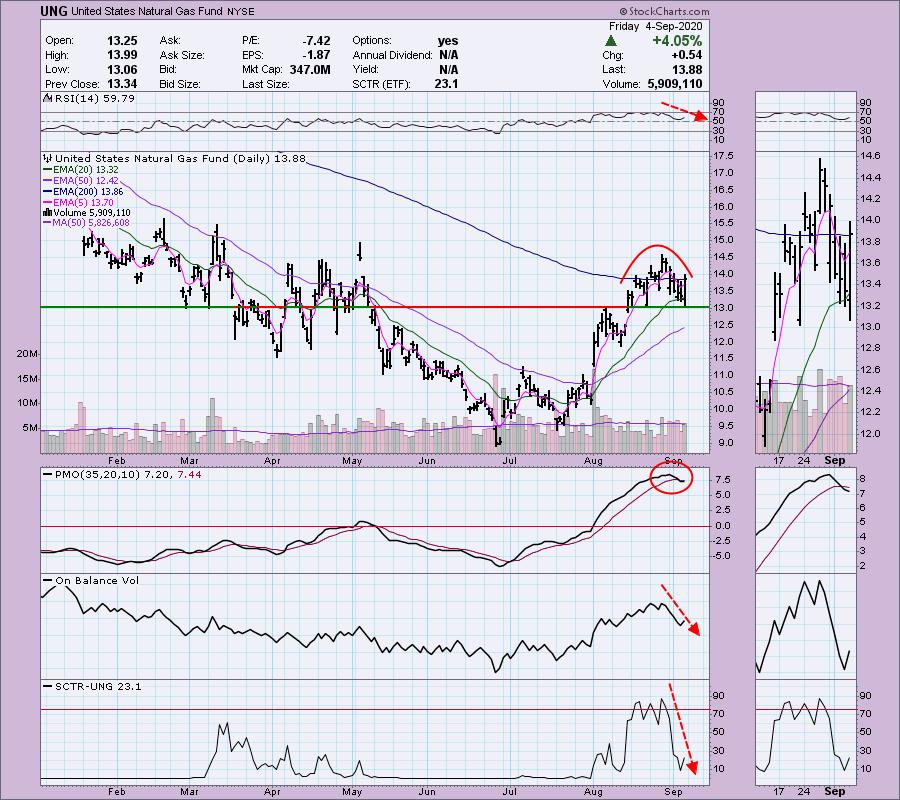
Warning: Natural Gas (UNG) Looking Bearish and THE Sector to Watch!

by Erin Swenlin,
Vice President, DecisionPoint.com
It may seem strange to write a negative review of an ETF after it just made a 4%+ move today, but I wrote to my subscribers earlier this week about the bearish warning signs on Natural Gas (UNG). While admittedly I'm not quite as bearish, given the price...
READ MORE
MEMBERS ONLY

A Healthcare Stock Poised to End its Correction
by Arthur Hill,
Chief Technical Strategist, TrendInvestorPro.com
The Bollinger Band squeeze signals a volatility contraction that can lead to a volatility expansion. But which way? For directional clues, we need to analyze price action and other indicators. Henry Schein caught my eye because the stock has a Bollinger Band squeeze, a bullish chart pattern, an uptrend and...
READ MORE
MEMBERS ONLY

How Not To Let Five Media Frankensteins Devastate Your Portfolio

by Gatis Roze,
Author, "Tensile Trading"
No, this is not a political blog. This is three decades of blood-and-sweat soaked lessons gleaned from investing and following the media. Like condensed milk, it's all boiled down to the five essential "must knows" for you. These are the five Frankensteins that will kill your...
READ MORE
MEMBERS ONLY

STRONG JOBS REPORT BOOSTS BOND YIELDS -- THAT'S HELPING LIFT FINANCIALS -- SOME MONEY MAY ALSO BE ROTATING OUT OF TECH STOCKS INTO CHEAPER FINANCIALS
by John Murphy,
Chief Technical Analyst, StockCharts.com
STRONG JOBS REPORT BOOSTS BOND YIELDS...This morning's strong jobs report saw a bigger than expected jump in nonfarm payrolls during August and a bigger than expected drop in the unemployment report to 8.4%. That strong combination helped contribute to today's rebound in bond yields....
READ MORE
MEMBERS ONLY
September 3, 1929 was the Peak; September 3, 2020 sees the NASDAQ Lose Almost 5%

by Martin Pring,
President, Pring Research
I don't think there is a connection between 1929 and 2020, but the headline seemed too good to pass up. Late last week, I mentioned that September is the weakest month of the year for stocks while October is prone to crashes. "Welcome to the bearish season,...
READ MORE
MEMBERS ONLY

Chartwise Women: Tools to Stay Safe in a Sell-Off
by Mary Ellen McGonagle,
President, MEM Investment Research
by Erin Swenlin,
Vice President, DecisionPoint.com
In this week's edition of Chartwise Women, Erin and Mary Ellen cover what to look for to determine if the markets - or your stocks - have really hit a top. In order to time your exits, you need to know about stops, and the pair share their...
READ MORE
MEMBERS ONLY

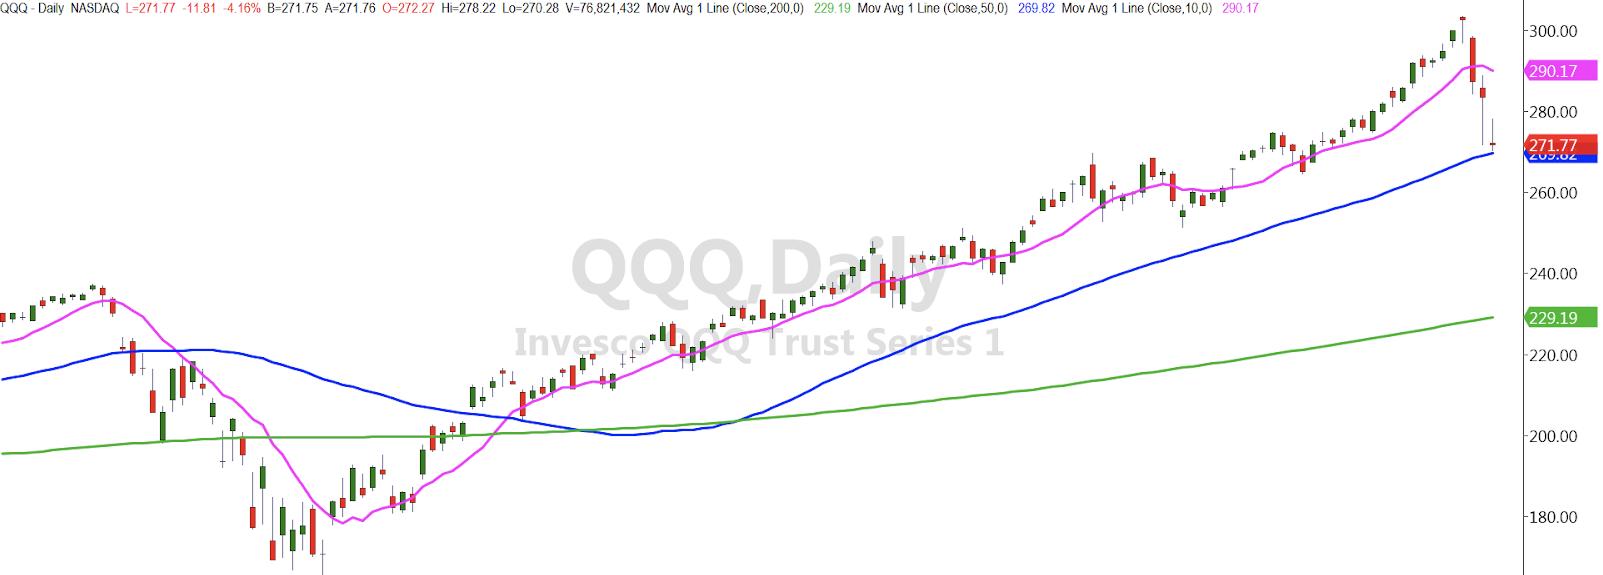
STOCKS HAVE WORST DAY SINCE JUNE 11 -- QQQ IS LEADING IT LOWER ON RISING VOLUME
by John Murphy,
Chief Technical Analyst, StockCharts.com
NASDAQ 100 LEADS MARKET LOWER... The tech-dominated Nasdaq is leading the market lower today for the worst drop since June 11. Today's negative combination of falling prices and rising volume suggests that there's more selling to come. The Candlevolume bars in Chart 1 show the Invesco...
READ MORE
MEMBERS ONLY
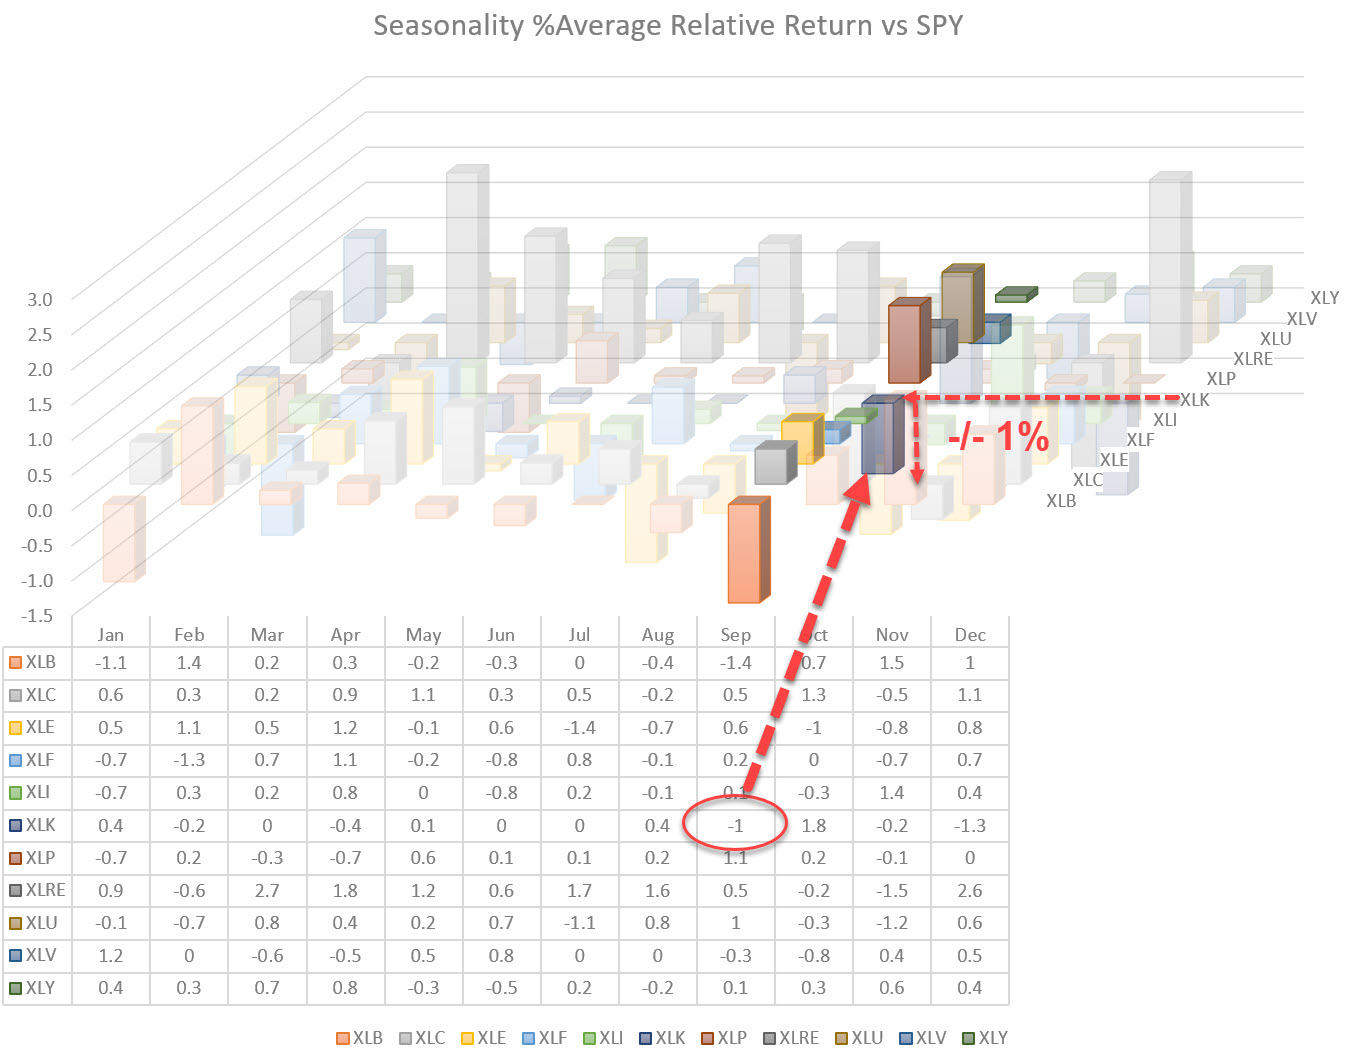
Seasonality Expects a Decline For SPY in September and an Underperformance for Technology
by Julius de Kempenaer,
Senior Technical Analyst, StockCharts.com
Last Tuesday in Sector Spotlight, as well as in my last article of the RRG blog, I discussed seasonality for US sectors. While going over the table showing the average returns per sector per month, my eye fell on another number... the minus-one percent (-1%) for the Technology sector. This...
READ MORE
MEMBERS ONLY

OVERBOUGHT TECHNOLOGY SECTOR STARTS TO WEAKEN -- TODAY'S TECH SELLING IS HAVING A NEGATIVE IMPACT ON THE REST OF THE MARKET
by John Murphy,
Chief Technical Analyst, StockCharts.com
NASDAQ PULLS BACK FROM OVERBOUGHT TERRITORY... It shouldn't come as surprise to read that the Nasdaq has been in overbought territory. So is the technology sector. And both are leading the market lower today. The top box in Chart 1 shows the 14-day RSI line for the Technology...
READ MORE
MEMBERS ONLY

2 Sentiment Indicators Are Suggesting Extreme Caution - BEWARE!

by Tom Bowley,
Chief Market Strategist, EarningsBeats.com
Let me start with the fact that I'm as bullish as they come in the long-term, so everything written here is for short-term traders only. Many times the market ignores short-term sentiment warning signals, so please don't misconstrue anything I'm about to write as...
READ MORE
MEMBERS ONLY

Cryptos - Still the Next Big Thing?

by Dave Landry,
Founder, Sentive Trading, LLC
Right now, we are in a trend and this is a golden opportunity. In this edition of Trading Simplified, Dave discusses methodology in action and includes some additional insight into Darvas. He also explores IPOs, StockChartsACP and cryptocurrencies. There is also follow-up on Mystery Charts and stocks discussed in The...
READ MORE
MEMBERS ONLY

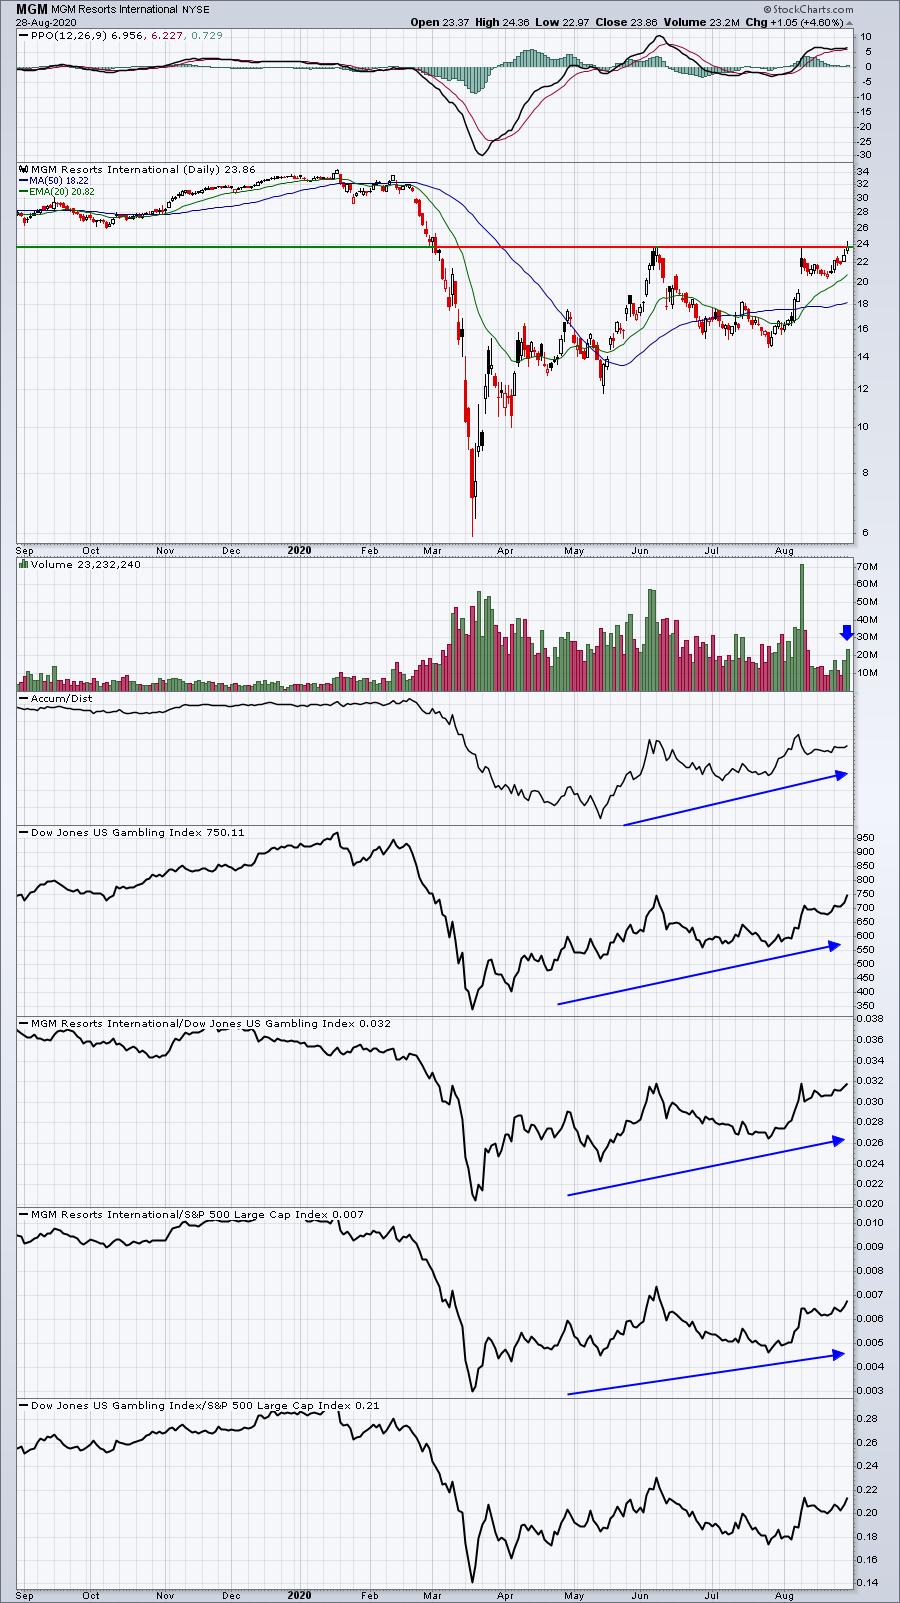
A Rotation into Financials, But is KRE Biting?
As mentioned yesterday, the Big Banks ETF (XLF) and Regional Banks ETF (KRE) are two of the weaker sectors. However, today we saw some money rotate into those sectors, with XLF rising over 1% and KRE rising marginally at .4%. Goldman Sachs (GS) cleared a key moving average.
Now some...
READ MORE
MEMBERS ONLY

TWITTER MAY BE BREAKING OUT -- VERIZON NEARS NEW RECORD
by John Murphy,
Chief Technical Analyst, StockCharts.com
TWITTER CLEARS RESISTANCE... My August 26 message showed our first chart today with the caption that Twitter might be breaking out. Today's action suggests that upside breakout may finally be taking place. Chart 1 shows Twitter (TWTR) climbing more than 2% and trading at the highest level in...
READ MORE
MEMBERS ONLY

Sector Spotlight: Avoid Materials in September
by Julius de Kempenaer,
Senior Technical Analyst, StockCharts.com
In this edition of Sector Spotlight, I look at last week's rotations using daily Relative Rotation Graphs and go over the completed monthly charts for August to catch up on the long-term trends. After the break, I analyze the seasonality for US sectors and look for alignment of...
READ MORE
MEMBERS ONLY
How Did the 3 Major Market Themes for August Do?
First off, a huge thank you to Geoff Bysshe for covering for me so I could have a vacation for 3 weeks!
Before I left, I wrote about 3 major themes to watch continue to emerge - or completely reverse. The first was the focus on the junk bonds and...
READ MORE
MEMBERS ONLY
Best August Since 1986. Now What?

by Geoff Bysshe,
Co-founder and President, MarketGuage.com
This article was originally written on August 31st, 2020.
Today, the SPY ended its best August performance since 1986 with a market message that is well worth paying attention as soon as tomorrow and well into September. Fortunately for me (and you), a lot of pieces of today's...
READ MORE
MEMBERS ONLY

CHEMICALS HELP LEAD MATERIALS HIGHER -- ALBEMARLE AND DOW HOLDINGS HIT SIX MONTH HIGHS -- ALCOA AND NUCOR GAIN MORE GROUND
by John Murphy,
Chief Technical Analyst, StockCharts.com
MATERIALS LEAD MARKET HIGHER... On a strong market day, six sectors are in the black with materials in the lead. Chart 1 shows the Materials Sector SPDR (XLB) gaining 2% today to hit a new record. Its relative strength line in the upper box is bouncing as well after declining...
READ MORE
MEMBERS ONLY

AGRICULURAL COMMODITIES JOIN COMMODITY RALLY -- COFFEE AND SOYBEANS NEAR UPSIDE BREAKOUTS -- LUMBER SETS NEW RECORD
by John Murphy,
Chief Technical Analyst, StockCharts.com
COMMODITY RALLY CONTINUES... Previous messages have pointed out that a two-year low in the U.S. Dollar Index was helping to lift commodity prices. And that's still the case. Chart 1 shows the Invesco Commodity Index (DBC) moving further above its 200-day moving average. Most of those messages,...
READ MORE
MEMBERS ONLY

September Seasonality Points to Sector Rotation from Materials into Communication Services
by Julius de Kempenaer,
Senior Technical Analyst, StockCharts.com
The graph above shows the percentage of months in which sectors have outperformed the S&P 500 in the past. For most sectors, the data go back 20 years, with the exceptions of XLC and XLRE, as these sectors were only introduced more recently and the historical data does...
READ MORE
MEMBERS ONLY

This is Why I'm Not Impressed with FSLR's Near 7 Year Breakout
by Tom Bowley,
Chief Market Strategist, EarningsBeats.com
It's always important to be prepared when a stock has challenged a key price resistance level multiple times and it's testing it again. First of all, if a stock does make a breakout technically, it's normally followed later by the fundamental news that triggered...
READ MORE
MEMBERS ONLY

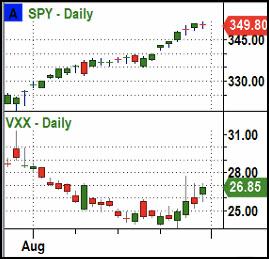
DP Show: What's Up with the VIX?
by Erin Swenlin,
Vice President, DecisionPoint.com
by Carl Swenlin,
President and Founder, DecisionPoint.com
What's up with the VIX and breadth? And what are they telling us about the market this week? A big news item for this edition of DecisionPoint is a New Long-Term PMO BUY signal for the SPX, but the Apple (AAPL) and Tesla (TSLA) splits, along with the...
READ MORE
MEMBERS ONLY

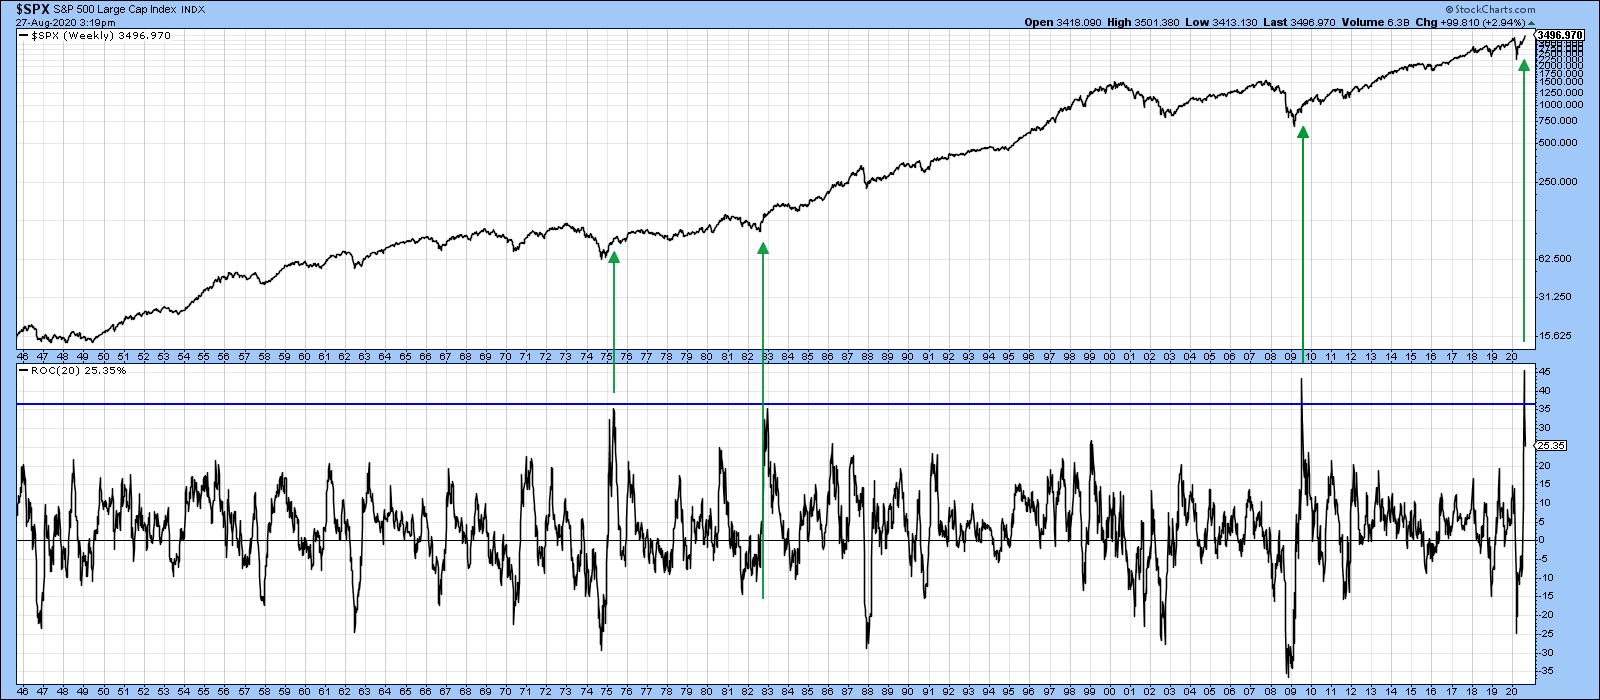
My Daily Five: The Ultimate S&P 500 Chart And Four Strong Setups From This Week's "10 I'm Stalking"

by Grayson Roze,
Chief Strategist, StockCharts.com
It's always a true pleasure to kick off the week by hosting a new episode of "Your Daily Five". I've said it before and I'll say it again – this is without a doubt oneof my favorite shows of the many we'...
READ MORE
MEMBERS ONLY

A Unique Market Indicator for Monday
by Geoff Bysshe,
Co-founder and President, MarketGuage.com
The weekend is the time to step back and look at the Modern Family's weekly trends and inflection points. This week, there are several interesting multi-timeframe patterns developing on the daily and weekly charts; some bullish, others bearish.
Before jumping into the charts, let me remind you about...
READ MORE
MEMBERS ONLY
4 Breakouts Last Week That You Need To See
by Tom Bowley,
Chief Market Strategist, EarningsBeats.com
A secular bull market runs on all cylinders. I'm a believer that we remain in the early stages of a bull market that will likely last another decade or longer. How else can you explain the S&P 500's move to an all-time high in...
READ MORE
MEMBERS ONLY

Trend Composite Turns Fully Bullish for Verizon
by Arthur Hill,
Chief Technical Strategist, TrendInvestorPro.com
Verizon (VZ) participated in the market surge from late March to mid April, but then stumbled with a decline into mid June. This stumble, however, looks like a classic correction and the stock broke out with a strong move over the last six weeks. In addition, the TIP Trend Composite,...
READ MORE
MEMBERS ONLY

Week Ahead: Dollar Deluge May Push Markets Some More; RRG Chart Shows These Broader Indexes in the Leading Quadrant
by Milan Vaishnav,
Founder and Technical Analyst, EquityResearch.asia and ChartWizard.ae
The Indian equity markets continued their unabated liquidity-driven up move and ended with yet another week with gains. The past five days remained less volatile than expected as the NIFTY remained in a defined range of 275-odd points. The directional move, however, remained unidirectional as the Index continued to move...
READ MORE
MEMBERS ONLY
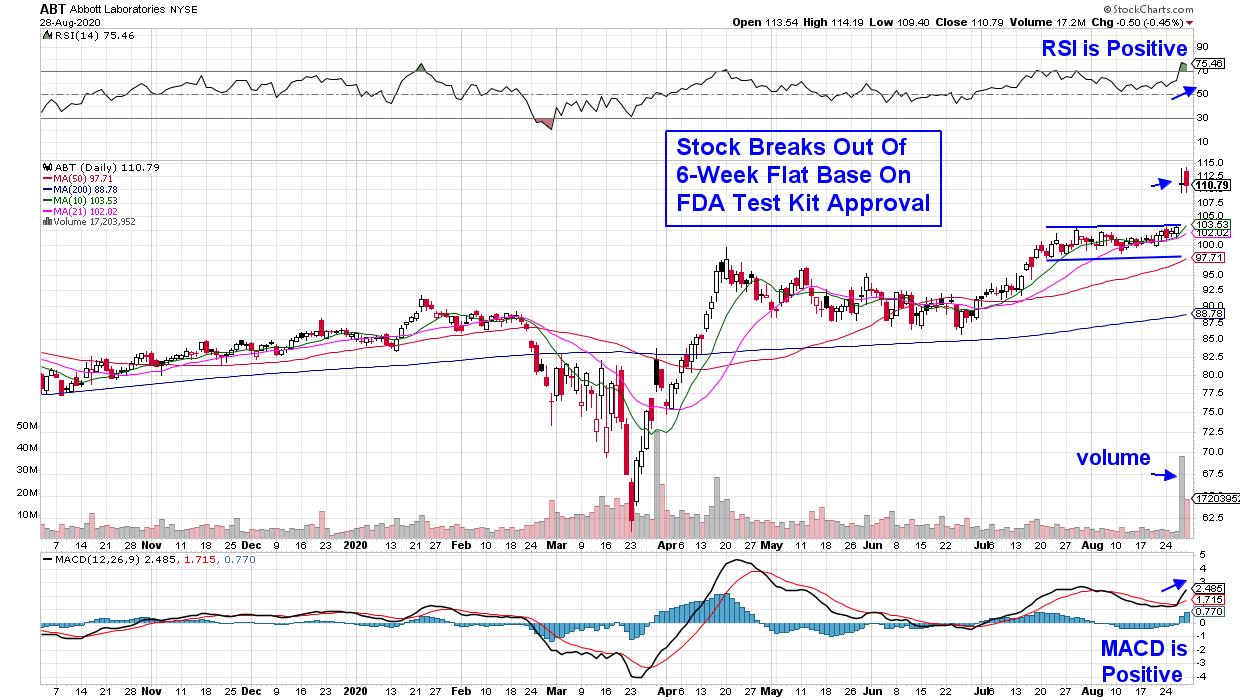
This Game Changing Stock Sparked Highly Bullish Moves In These 2 Candidates
by Mary Ellen McGonagle,
President, MEM Investment Research
Shares of Abbott Laboratories (ABT) jumped 8% Thursday on news that the FDA granted emergency use authorization for their COVID-19 testing kit.
Abbott's test is a game-changer as it is rapid, reliable and affordable and can detect active coronavirus at massive scale. At a cost of $5 and...
READ MORE
MEMBERS ONLY
Eight Charts I Am Watching Closely Right Now
by Martin Pring,
President, Pring Research
Strong Bull Market Indications
We are all aware of the Shakespearian saying "Beware of the Ides of March," which didn't go so well for Julius Caesar. In market folklore, October is the season for crashes and September is the worst-performing month. Welcome to the bearish season!...
READ MORE
MEMBERS ONLY

Explosive Tech Gains - Don't Miss Out!
by Mary Ellen McGonagle,
President, MEM Investment Research
In this episode of StockCharts TV'sThe MEM Edge, Mary Ellen reviews the large gaps up in select Tech stocks and how to trade them going forward. She also uncovers the best ways to play the renewed "recovery rally" as well as top Chinese ADR stocks poised...
READ MORE
