MEMBERS ONLY
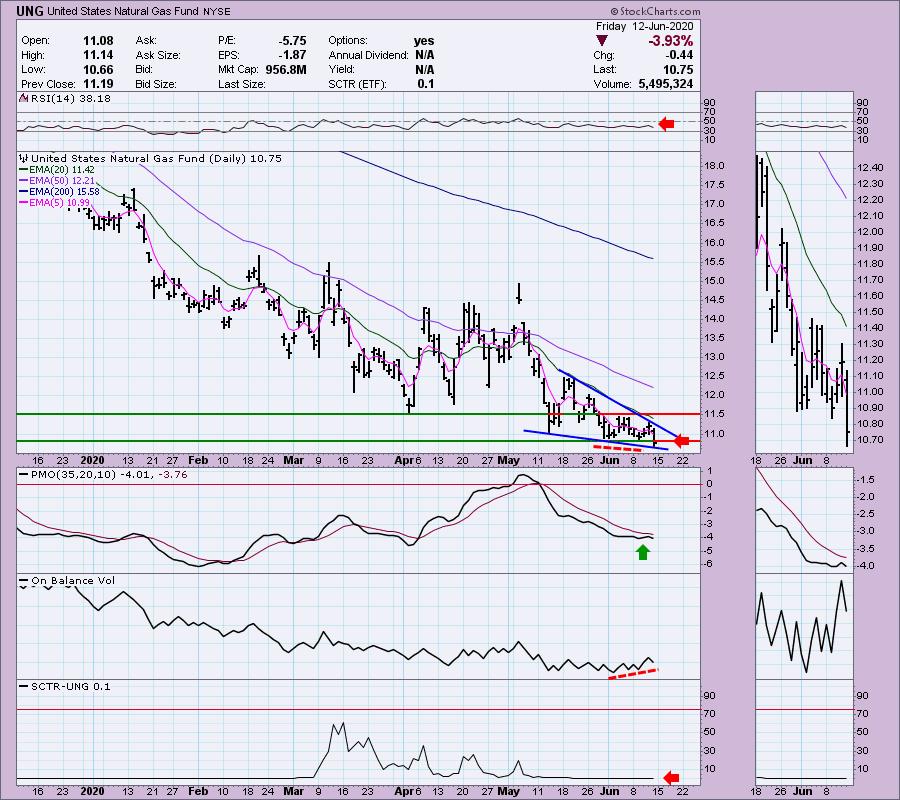
The Bottom of the Chart Isn't Support - UNG Proves the Point

by Erin Swenlin,
Vice President, DecisionPoint.com
I remember hearing (and still hearing) from other analysts that one should remember that the bottom of the chart isn't a support level. This is especially true when you are looking at a stock that has been making new all-time lows. Yesterday, a DecisionPoint Diamonds reader requested I...
READ MORE
MEMBERS ONLY
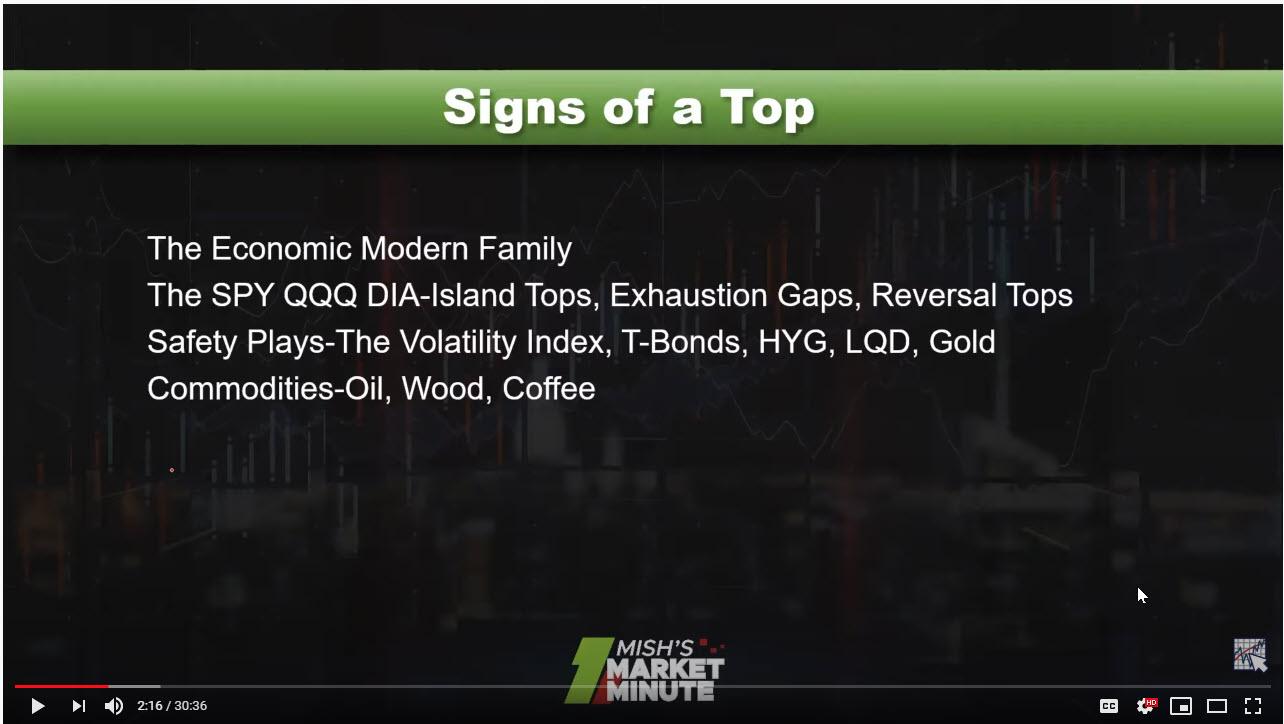
Did the Market Really Top?
After last Thursday's nearly 1900-point decline, I recorded a video for StockChartsTV (at the bottom of the page). Then, on Friday, we saw four distinct trading patterns emerge.
First, many instruments had inside days or traded within the range of Thursday's trading range. Is this surprising?...
READ MORE
MEMBERS ONLY

Stocks and Treasuries: The Yin and Yang of the Markets

by Arthur Hill,
Chief Technical Strategist, TrendInvestorPro.com
The 20+ Yr Treasury Bond ETF (TLT) retreated as stocks advanced from mid April to early June and then popped as stocks dropped this week. Bonds are the natural alternative to stocks and TLT appears to be forming a classic bullish continuation pattern.
Let's first compare performance for...
READ MORE
MEMBERS ONLY
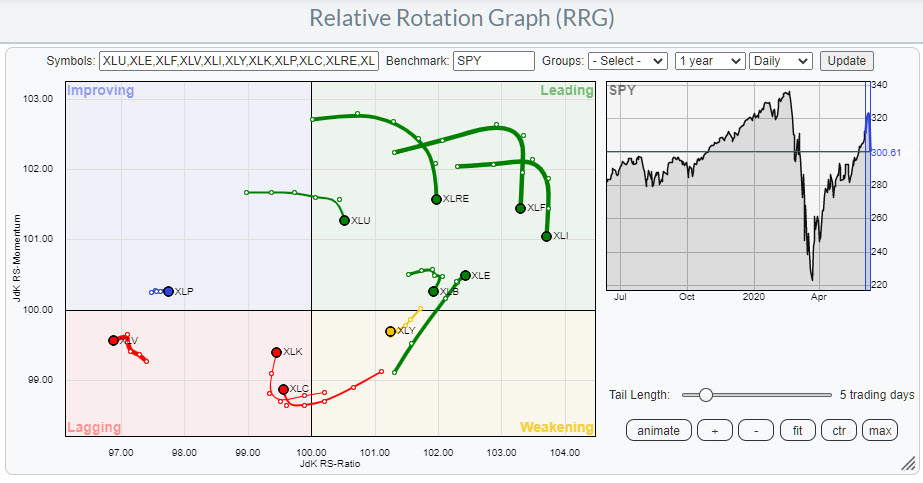
Yesterday's Impact on Sector Rotation

by Julius de Kempenaer,
Senior Technical Analyst, StockCharts.com
Yesterday's (6/11/2020) big drop in the S&P did not cause any weird hooks or unexpected rotations on the Relative Rotation Graph.
If we start off in the leading quadrant, we see that the tails for XLU, XLRE, XLF, XLI and XLB had already started...
READ MORE
MEMBERS ONLY
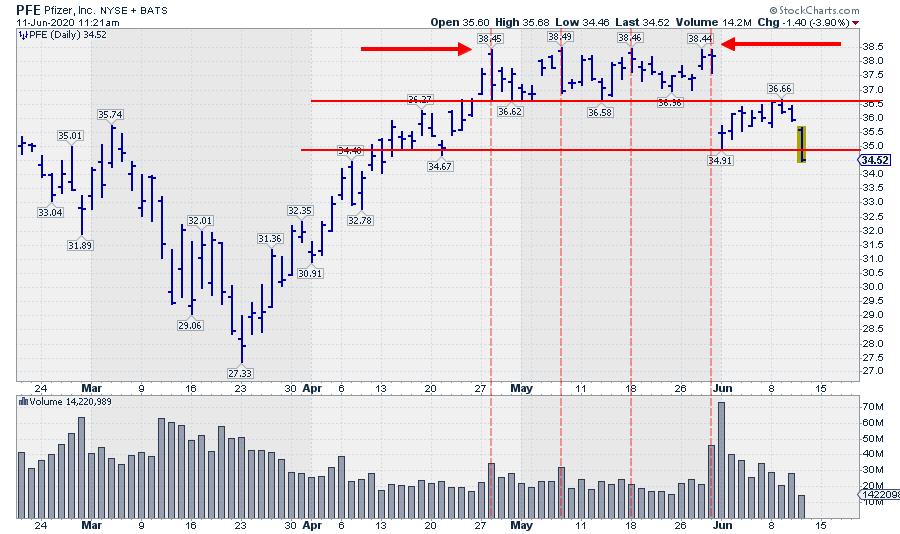
This is What Resistance Looks Like!
by Julius de Kempenaer,
Senior Technical Analyst, StockCharts.com
A lot of (very educated) people want us to believe that the market is a random walk. And you know... Maybe sometimes it is, but not always.
This morning, I ran into the chart of Pfizer (PFE) again. I've been monitoring that chart since I wrote about it...
READ MORE
MEMBERS ONLY

DP Show: Nasdaq 10,000 Dissection Reveals Negative Divergences
by Erin Swenlin,
Vice President, DecisionPoint.com

by Carl Swenlin,
President and Founder, DecisionPoint.com
In this episode of DecisionPoint, with the Nasdaq hitting 10000 on Wednesday, Carl and Erin take a deep dive into exclusive DP indicators for the Nasdaq to reveal some surprising negative divergences. Carl discussed the concept of "single-entry bookkeeping" and the false optimism it can create. Erin finishes...
READ MORE
MEMBERS ONLY
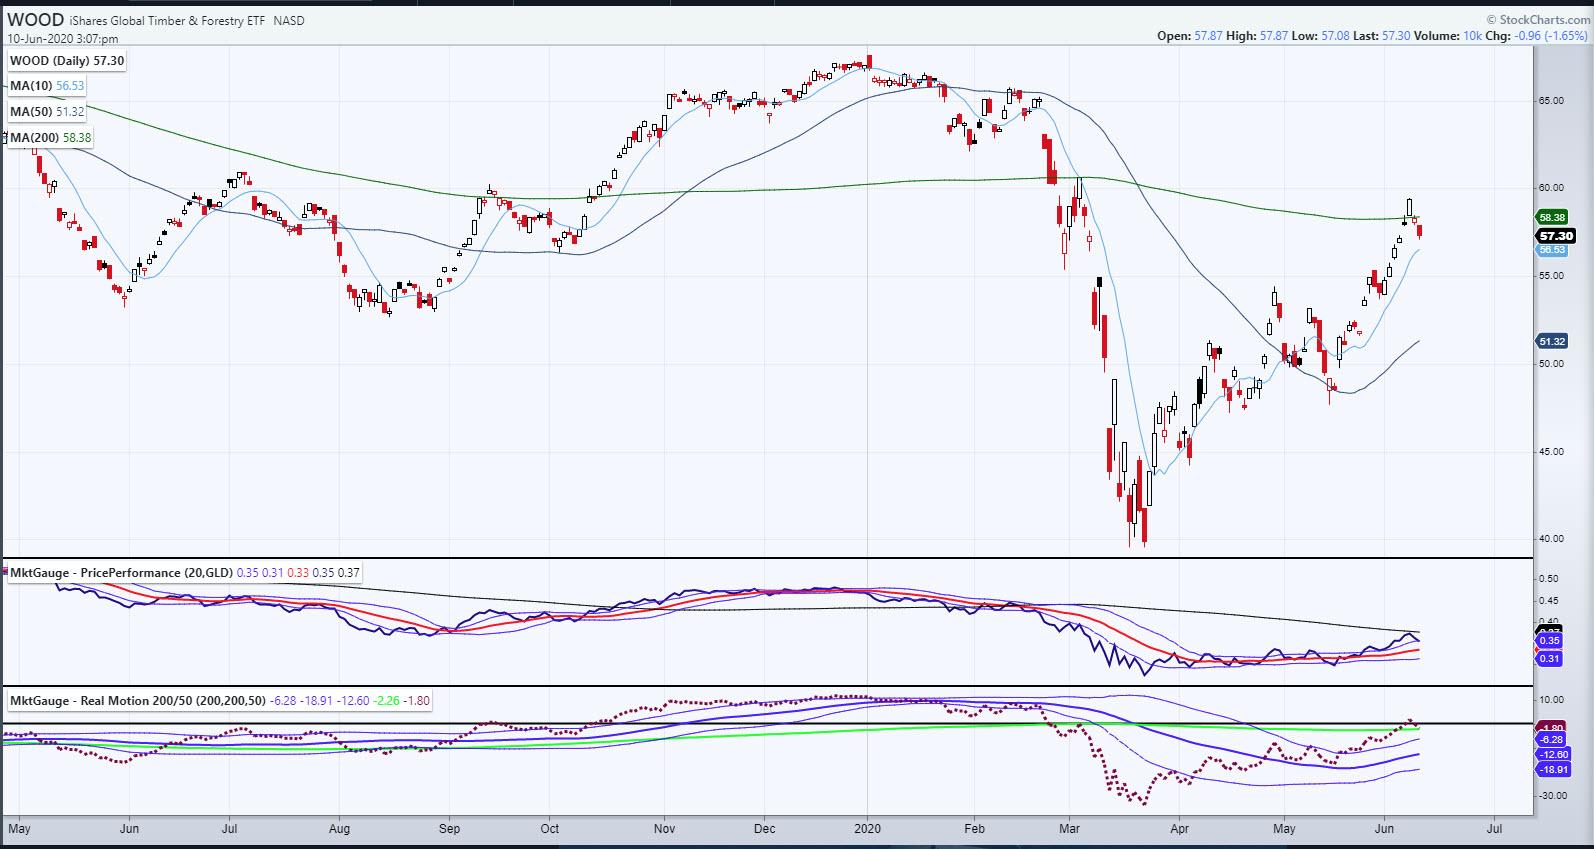
WOOD - One of the Best Lead Indicators
Gold shot up, Bonds (TLT) rallied, oil flew and the economic Modern Family showed its reliability once again.
After the FOMC and the super dovish minutes were released, here is the skinny of the FOMC major points: unlimited stimulus, rates near zero for at least a year and a half,...
READ MORE
MEMBERS ONLY

What's Standing Between You and Success? - Part 2

by Dave Landry,
Founder, Sentive Trading, LLC
Trading is often a challenge, but can be made easier by following a process. In this edition of Trading Simplified, Dave explains the problems you can run in to with your trading, but also provides possible solutions that can help take your trading to the next level.
This video was...
READ MORE
MEMBERS ONLY

New Indicators for Gold Miners Index
by Carl Swenlin,
President and Founder, DecisionPoint.com
(Editor's Note: This is an expanded version of an item in last Friday's DP ALERT WEEKLY WRAP.)
Last week we added some indicators to the Gold Miners Index (GDX) chart. First, Erin really likes the RSI, so she encouraged me to put that on the daily...
READ MORE
MEMBERS ONLY
Sector Spotlight: The Turn of the Tail
by Julius de Kempenaer,
Senior Technical Analyst, StockCharts.com
On this episode of Sector Spotlight, after a quick overview of asset classes and sector rotation, I dive into the mailbag and answer three questions. One of them shows two quantitative studies involving expected returns after a tail turning into a 0-90 degree heading.
This video was originally broadcast on...
READ MORE
MEMBERS ONLY
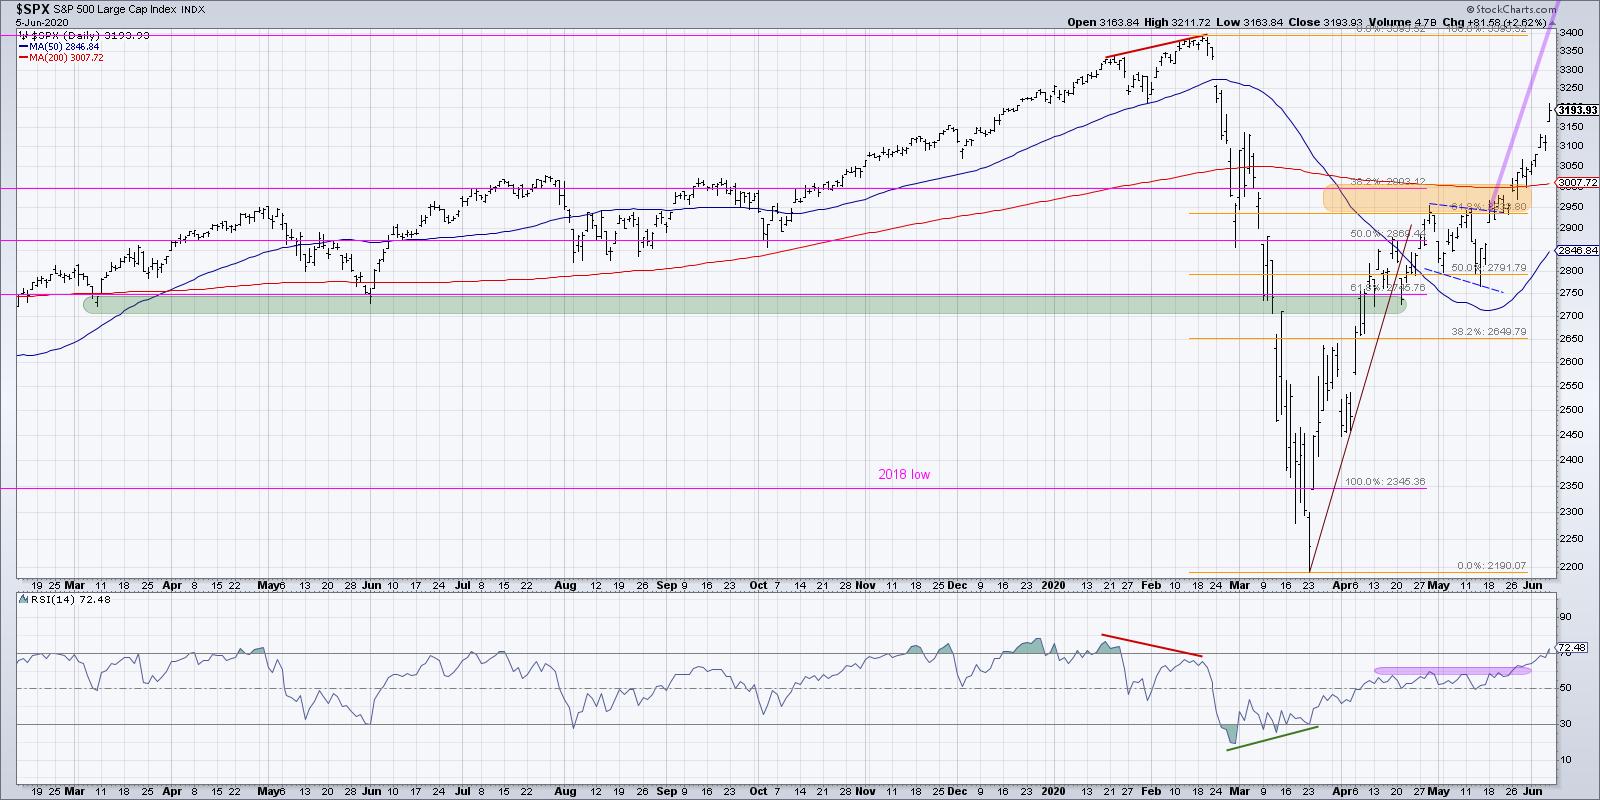
Stocks Overbought... Bonds Oversold... Impending Reversal?

by David Keller,
President and Chief Strategist, Sierra Alpha Research
Every Friday on The Final Bar, I conduct a weekly chart routine called "Wrap the Week" where we review macro charts and how they've evolved over the previous seven days. This week was focused on the unrelenting uptrend in stocks, but a deeper analysis after the...
READ MORE
MEMBERS ONLY

Market Action Confirms the Employment Report

by Martin Pring,
President, Pring Research
* Market Gets a New Lease on Life
* Ten-Day Breadth Ratio Hits Bullish Extreme
* S&P Stocks Above 50-day MA Also Hit a Bullish Extreme
* Can Small-Caps Extend their Sharp Rally?
Usually, when a market rallies sharply and experiences an overbought condition, the probabilities favor corrective activity of some kind....
READ MORE
MEMBERS ONLY

Semiconductors Breaking Out!
by Erin Swenlin,
Vice President, DecisionPoint.com
As I reviewed my scans to write the "DecisionPoint Diamonds" report, I noticed a theme in Technology, particularly in the Semiconductor industry group (SOXX). I zeroed in on my favorites to present in today's DecisionPoint Diamonds report (if you'd like to see those charts,...
READ MORE
MEMBERS ONLY
How Prodigal is Our Prodigal Son Regional Banks?
Are you wondering how bonds, gold, volatility, the S&P 500 and NASDAQ can all run up on the same day? Plus, Beyond Meat, Amazon, cannabis, Tesla and Oil and Gas Exploration partied like they boarded SpaceX!
Well, think of it this way. Stanley Druckenmiller manned up and admitted...
READ MORE
MEMBERS ONLY

Power Charting TV: Special Guest Roman Bogomazov. Wyckoff Market Discussion 200th Episode, An Invitation to Attend.

by Bruce Fraser,
Industry-leading "Wyckoffian"
Roman Bogomazov is this week's special guest on Power Charting. He discusses the current stock market rally and the upcoming 200th episode of the ‘Wyckoff Market Discussion' series. Professor Roman is a leading Wyckoff Method educator, mentoring under and teaching with famed Wyckoffian Hank Pruden. Roman and...
READ MORE
MEMBERS ONLY
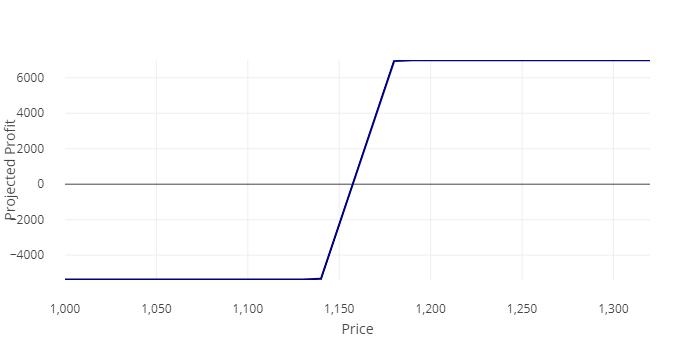
This Pharma Stocks Offers A Potentially Profitable Hedged Option Setup

by Milan Vaishnav,
Founder and Technical Analyst, EquityResearch.asia and ChartWizard.ae
Piramal Enterprises Limited -- PEL.IN
The stock has under-performed the Pharma Index over the past couple of weeks. Against the broader markets as well, the stock has not performed while it stayed in a prolonged sideways consolidation.
Currently, it is just broken out on the upside with greater-than-average volumes....
READ MORE
MEMBERS ONLY

Knowing When to Add Risk and When to Reduce Risk
by Arthur Hill,
Chief Technical Strategist, TrendInvestorPro.com
The S&P 500 is the most widely used benchmark for the US stock market and the 200-day SMA is perhaps the most widely used moving average. These two came together again in late May as the index crossed back above on May 27th. Today we will quantify the...
READ MORE
MEMBERS ONLY
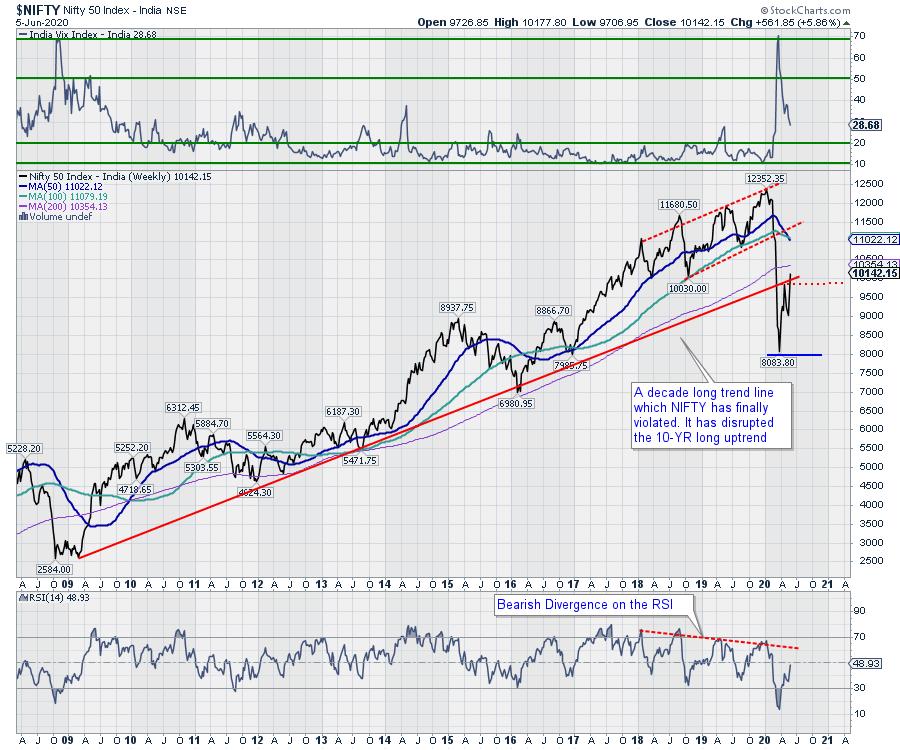
Week Ahead: These Things Happen in a Risk-On Setup: RRG Shows These Sectors Losing Relative Momentum
by Milan Vaishnav,
Founder and Technical Analyst, EquityResearch.asia and ChartWizard.ae
In a yet another week where we witnessed a gush of liquidity continuing to chase the equities, the Indian equity markets saw a buoyant week and ended once again with an up week. The trading range of the week remained wider on the expected lines. The headline index oscillated over...
READ MORE
MEMBERS ONLY
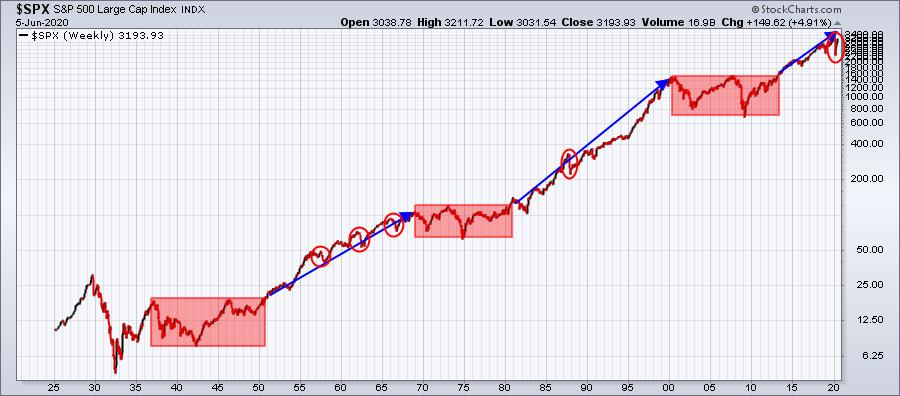
The U.S. Stock Market Is Becoming One Giant Short Squeeze

by Tom Bowley,
Chief Market Strategist, EarningsBeats.com
I've never understood the attraction to short selling, especially in a secular bull market. I get it - March and April didn't really feel like a big time bull market. But it was still part of one. March represented a cyclical bear market in a massive...
READ MORE
MEMBERS ONLY
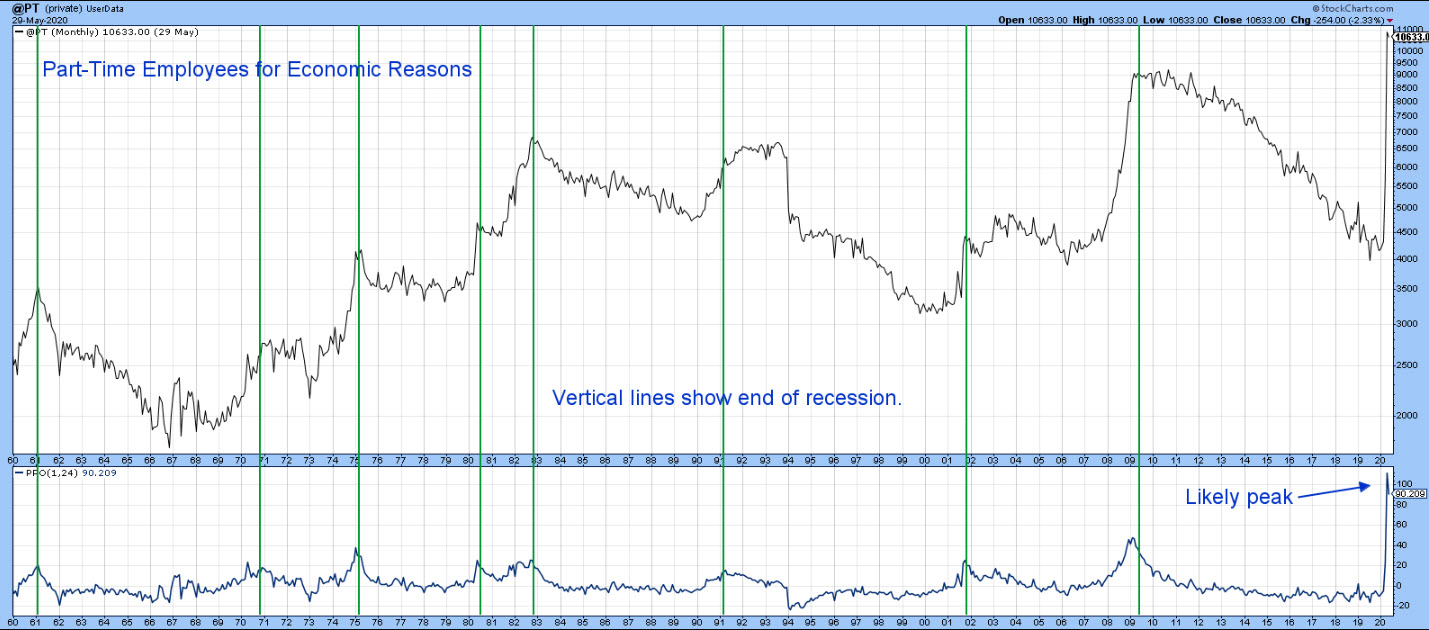
Did the May Employment Report Signal an End to the Recession?
by Martin Pring,
President, Pring Research
Part-Time Employees for Economic Reasons is a leading indicator of the labor market. That's because employers are more inclined to hire and fire temporary workers than permanent ones, where labor laws, contracts, pensions and other impediments get in the way. This indicator has been consistently useful in identifying...
READ MORE
MEMBERS ONLY
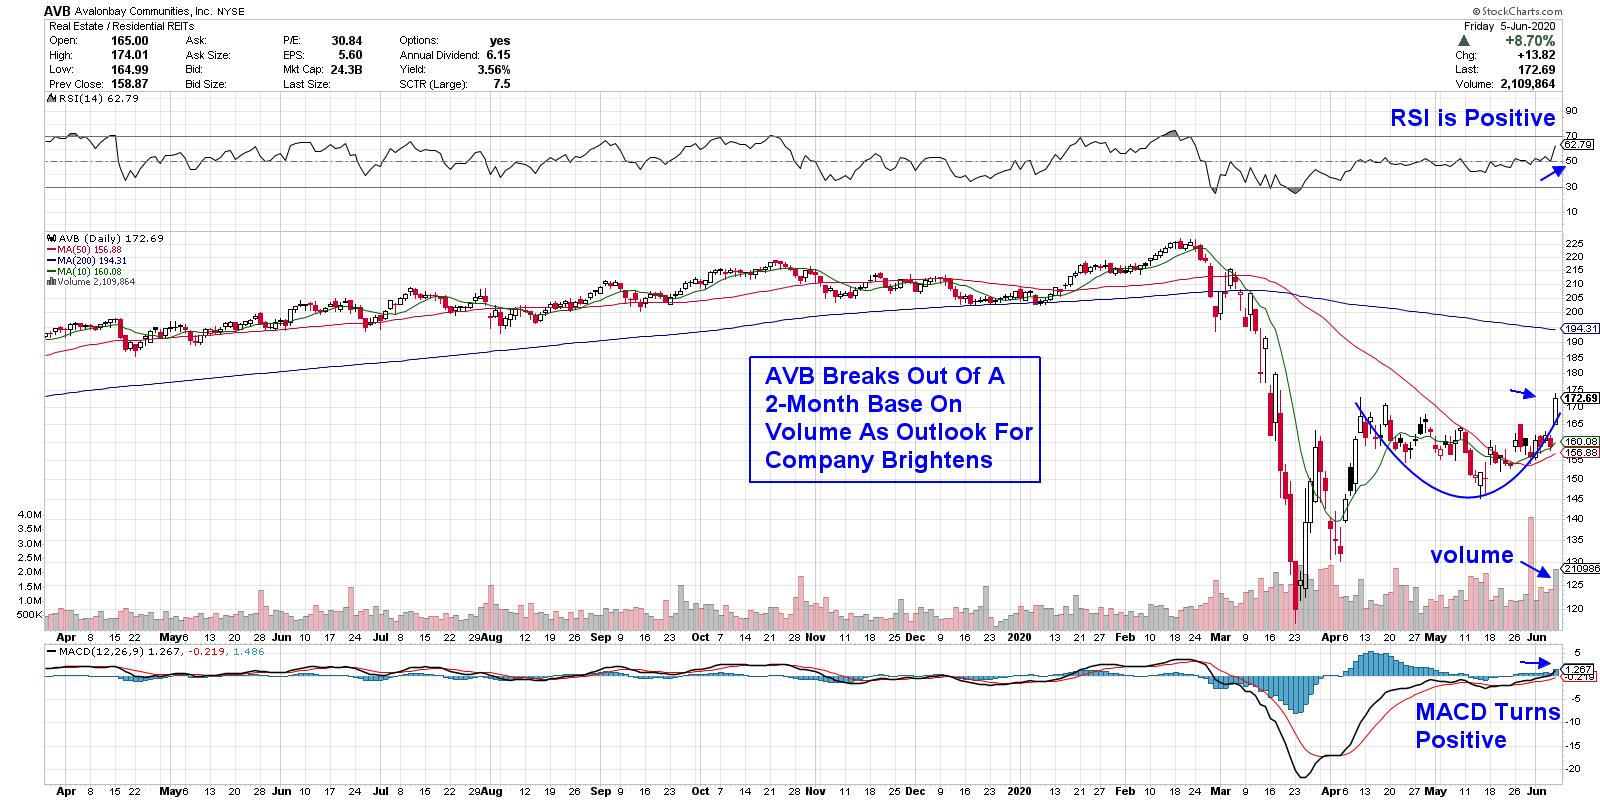
The Outlook is Brightening for These Companies - and Their Stocks are On Sale

by Mary Ellen McGonagle,
President, MEM Investment Research
Extreme uncertainty can really push stocks around, and this historically unprecedented pandemic has certainly proven that.
Take the steep selloff in normally defensive Utility and Real Estate stocks. With the country in a mandated lockdown that initially had no end in sight, these stocks got clobbered, as the need for...
READ MORE
MEMBERS ONLY
Stocks Overbought, Bonds Oversold (Almost)
by David Keller,
President and Chief Strategist, Sierra Alpha Research
Every Friday on The Final Bar,I conduct a weekly chart routine called "Wrap the Week" where we review macro charts and how they've evolved over the previous seven days. This week was focused on the unrelenting uptrend in stocks, but a deeper analysis after the...
READ MORE
MEMBERS ONLY

Did the May Employment Report Signal an End to the Recession?
by Martin Pring,
President, Pring Research
Part-Time Employees for Economic Reasons is a leading indicator of the labor market. That's because employers are more inclined to hire and fire temporary workers than permanent ones, where labor laws, contracts, pensions and other impediments get in the way. This indicator has been consistently useful in identifying...
READ MORE
MEMBERS ONLY

Can This Strength in the Markets Continue?
by Mary Ellen McGonagle,
President, MEM Investment Research
In this episode of StockCharts TV'sThe MEM Edge, Mary Ellen reviews the status of the markets and what this week's action reveals. She also shares insights into how to handle the explosive moves in select stocks and the best way to tell when the near-term uptrend...
READ MORE
MEMBERS ONLY

What Does a Market Topping Pattern Look Like?
I love this photo. If you see it right side up, it looks like a piece of deadwood coming out of the tree trunk. Upside down, it looks like the head of a bird.
(Okay, maybe a somewhat prehistoric bird, but a bird nonetheless.)
The point is it reminds me...
READ MORE
MEMBERS ONLY

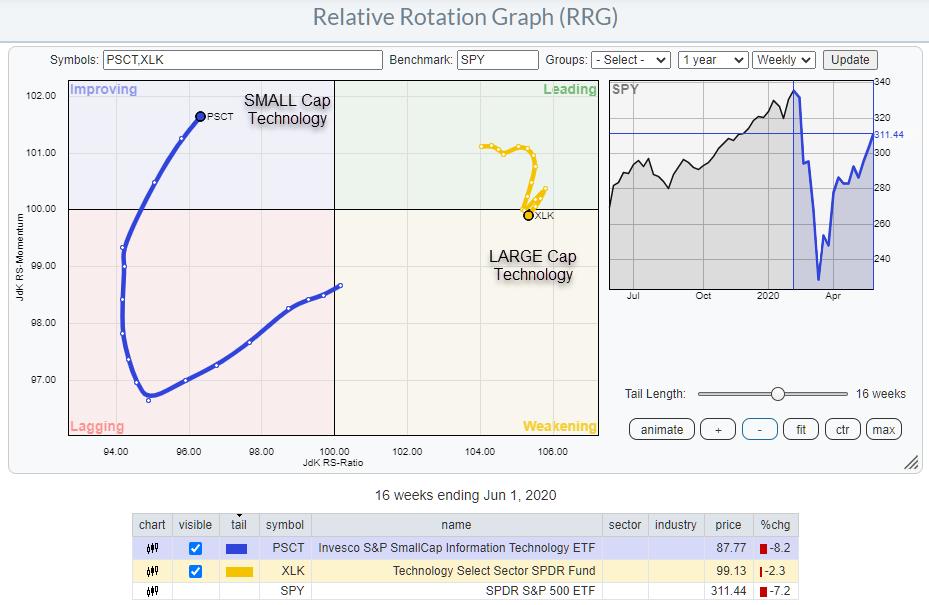
Smaller Stocks Lead at Bottoms. - JJM
by Julius de Kempenaer,
Senior Technical Analyst, StockCharts.com
The title for this article is a quote from John Murphy's book Trading with Intermarket Analysis. And I couldn't help but think of it when I was watching the Relative Rotation Graph that shows the rotation for different segments of market capitalization.
The most well-known RRG...
READ MORE
MEMBERS ONLY
Volatility Index - Did it Bottom?
In my last blog, we looked at the volatility index.
Ahead of a weekend where more protests both peaceful and violent could happen, VIX could help us see how much fear might come back into the market. Another potential fear factor is that, with all the gathering of folks in...
READ MORE
MEMBERS ONLY
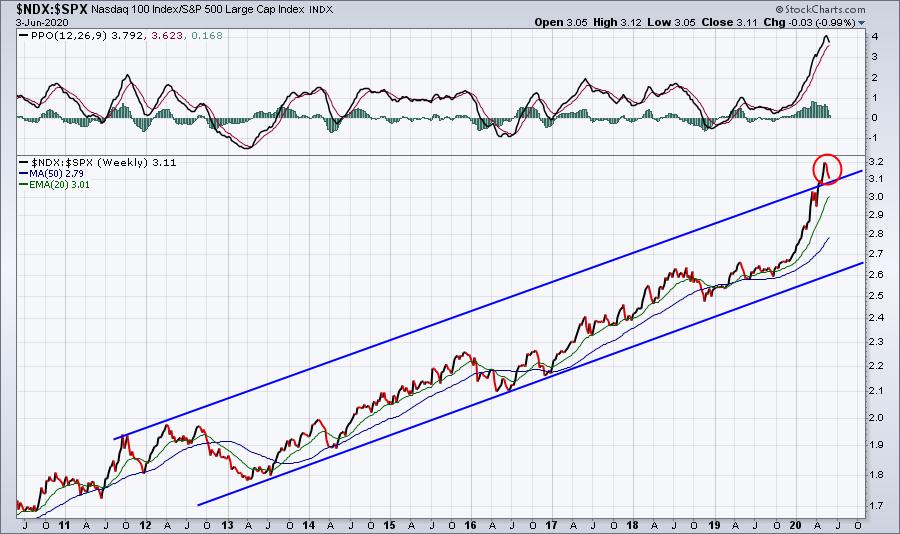
Time to Sell MSFT and AAPL?
by Julius de Kempenaer,
Senior Technical Analyst, StockCharts.com
The recovery of the Technology sector out of the March low has been in line with the S&P 500, only 1.5% better. With its strong (out)performance in the run up to the February peak and the less disastrous decline into March, XLK remained at the right...
READ MORE
MEMBERS ONLY

DP Show: Today's Market Eerily Similar to Bear Market Prequel
by Erin Swenlin,
Vice President, DecisionPoint.com
by Carl Swenlin,
President and Founder, DecisionPoint.com
In this episode of DecisionPoint, Carl and Erin begin by analyzing the day's market, after which Carl discusses the similarities between this rally and the rally into the bear market crash. They discuss confirmations and non-confirmations on indicators and perform a thorough review of the sectors, including Silver...
READ MORE
MEMBERS ONLY
Major Rotation Is Taking Place; Short-Term Traders Beware
by Tom Bowley,
Chief Market Strategist, EarningsBeats.com
It's been a shocking rebound to many, but I believe this party is just getting started. Fortunately, we were able to see the increase in the Volatility Index ($VIX) in late-February as an appropriate warning signal and then quickly realized that much of the selling was nothing more...
READ MORE
MEMBERS ONLY
2 Blogs, 2 Reasons for Caution: Volatility Index!
If you did not get a chance to read my blog on the 1960s from June 2nd, please consider doing so.
Just when the market is hitting euphoric conditions, any expansion of the protests, violence or the number of COVID-19 cases could unravel the market quickly. The Volatility Index, VIX,...
READ MORE
MEMBERS ONLY
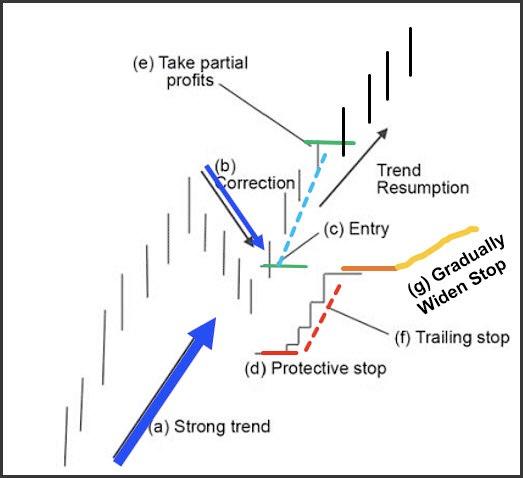
Random Thoughts: Why Following the Trading Plan is Hard
by Dave Landry,
Founder, Sentive Trading, LLC
Trading is hard. Done right, it will force you to do a lot of unnatural things and it will make you feel uneasy. Embracing this from both a physiological and a psychological aspect is key. Let's explore this further, with a focus on what happens in your brain...
READ MORE
MEMBERS ONLY

What's Standing Between You and Success?
by Dave Landry,
Founder, Sentive Trading, LLC
In this edition of Trading Simplified, Dave discusses how going in with an open mind can help lead you to longer-term success in trading once this crazy market gets back to "normal." He presents ways you can go from being a trader "for now" to being...
READ MORE
MEMBERS ONLY

Sector Spotlight: Seasonality Suggests XLV over XLF for June
by Julius de Kempenaer,
Senior Technical Analyst, StockCharts.com
On this episode of Sector Spotlight, I take a look at the longer-term picture for asset Classes and sectors using monthly bar-charts, then show how sometimes a shift to a line chart may give you even more insight. After this, I move on to combining the current RRG rotations with...
READ MORE
MEMBERS ONLY

Commodities Reach Important Breakout Points, Part II
by Martin Pring,
President, Pring Research
* The Gold/CRB Ratio as a Commodity Indicator
* Close Correlation between Canadian/Australian Dollars and Commodities
* The Stock Market Votes for Commodities
* Short-Term Breakout Underway?
The Gold/CRB Ratio as a Commodity Indicator
A couple of weeks ago, I wrote an article on commodities suggesting that conditions were falling into...
READ MORE
MEMBERS ONLY

Seasonality Prefers Health Care over Financials in June
by Julius de Kempenaer,
Senior Technical Analyst, StockCharts.com
In this week's episode of Sector Spotlight (Tuesday 10.30-11.00am ET), I ran out of time to review outstanding pair-trades so I am writing them up here in this article.
Monitoring (pair trade) ideas and how to properly communicate and track them remains an ongoing concern. Let...
READ MORE
MEMBERS ONLY

The Art of Uncovering an Ideal Buy Point
by Mary Ellen McGonagle,
President, MEM Investment Research
Oftentimes, as an exceptionally strong stock continues to outperform the broader markets, it's hard to not get excited and jump on board as the stock advances to new highs. Believe me, as an expert in capturing momentum stocks on their way to outperforming the broader markets, I'...
READ MORE
MEMBERS ONLY
The Economic Modern Family - Time to Prune in June?
Now that "sell in May" did not work out so well for the bears, what will June hold for both the bulls and the bears?
Since the price lows that were established in late March, it's been easy pickings for so many areas of the market....
READ MORE
MEMBERS ONLY
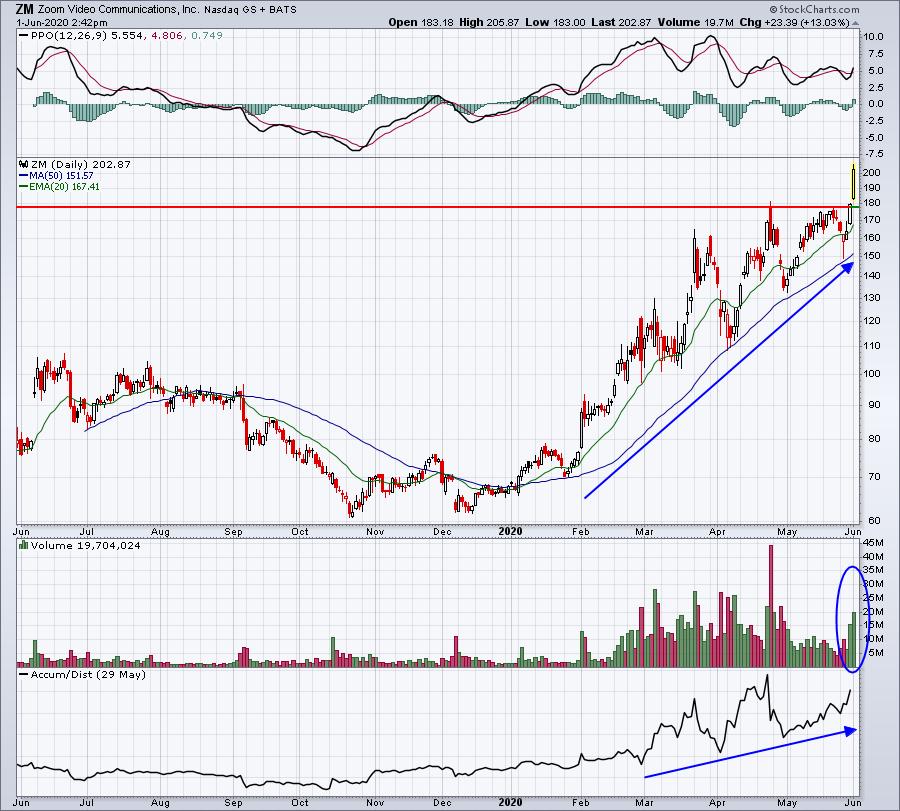
The Bulls Have Spoken, Now Will Earnings Confirm?
by Tom Bowley,
Chief Market Strategist, EarningsBeats.com
One of my favorite stocks throughout this pandemic has been Zoom Video Communications (ZM). It's been wildly volatile, but also extremely profitable - if you can hang on through all the ebbs and flows. Bulls' patience is currently being rewarded as ZM absolutely flies into its earnings...
READ MORE
MEMBERS ONLY

"10 I'm Stalking" - Top Charts and Intriguing Trades (Week of June 1st, 2020)

by Grayson Roze,
Chief Strategist, StockCharts.com
Every weekend, my "Sunday Portfolio Review"ends with the same rigorous search process. With my market evaluation and portfolio analysis routines complete, I turn my attention to the discovery phase.
This is the fun part. I sit down with all the results of the scans I've...
READ MORE
