MEMBERS ONLY
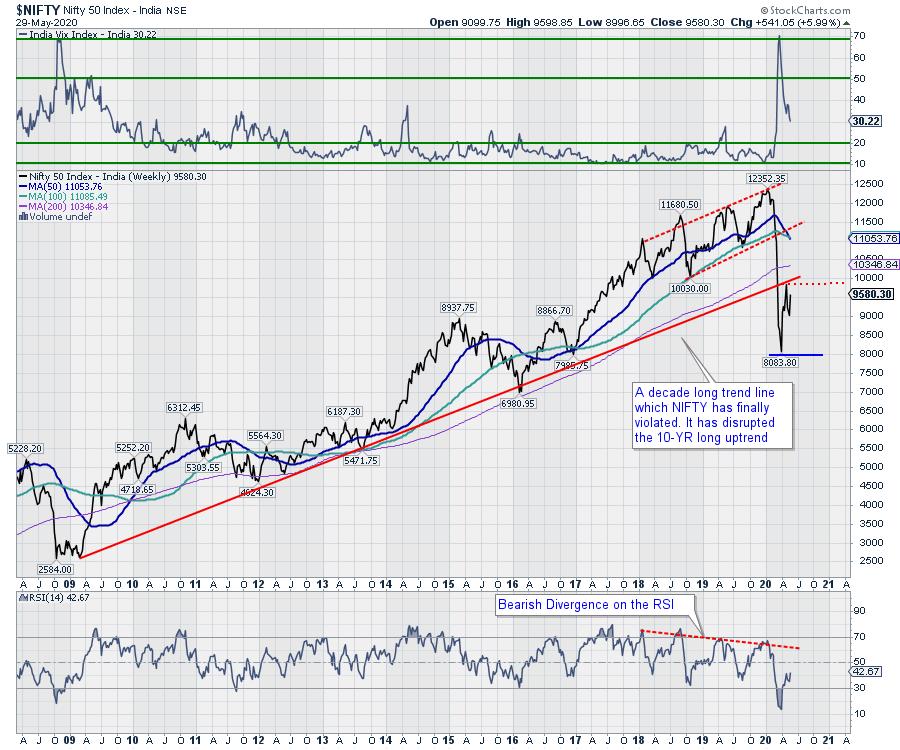
Week Ahead: NIFTY Moves Towards Major Resistance Zone; RRG Shows Diminishing Outperformance From these Sectors

by Milan Vaishnav,
Founder and Technical Analyst, EquityResearch.asia and ChartWizard.ae
The previous week remained contrary to expectations; instead of staying within ranged movement, it was a wide-ranging one with the Index ending with robust gains. The NIFTY saw a 600-point wide trading range, much broader than expected. The NIFTY pulled back from the low point and finished on a strong...
READ MORE
MEMBERS ONLY

Bullish Stocks for the Post-Pandemic Economy

by Mary Ellen McGonagle,
President, MEM Investment Research
In this episode of StockCharts TV'sThe MEM Edge,Mary Ellen shares stocks seeing a big pickup in product demand as consumers prepare for the "new normal." She also highlights areas poised to trade higher after reporting explosive growth during the current lockdown.
This video was originally...
READ MORE
MEMBERS ONLY
Reader Question: "Why Look at Weekly Charts?"

by Erin Swenlin,
Vice President, DecisionPoint.com
I love getting email from my readers and this particular email was great. He felt like he was asking a ridiculous question, but it is a common one that I don't think is asked out loud. This reader asked the question in the context of my DP Diamonds...
READ MORE
MEMBERS ONLY

A Different Market Pattern
Pre-pandemic, once the Trump administration took office, we saw a new pattern emerge.
Before the world went on lockdown, the market moved up and down (with some autonomously strong exceptions in tech), based on headlines from the President himself. But, during the pandemic, Powell became the "Headline Mover-in-Chief."...
READ MORE
MEMBERS ONLY
Nasdaq Closes a Major Gap

by Martin Pring,
President, Pring Research
March Was a Really Strong Bottom
Tuesday's action looks bullish on the surface, but may signal the end of the rally. I emphasized the word "may" not because I am trying to hedge my bets, but more because the March bottom, by historical standards, was a...
READ MORE
MEMBERS ONLY
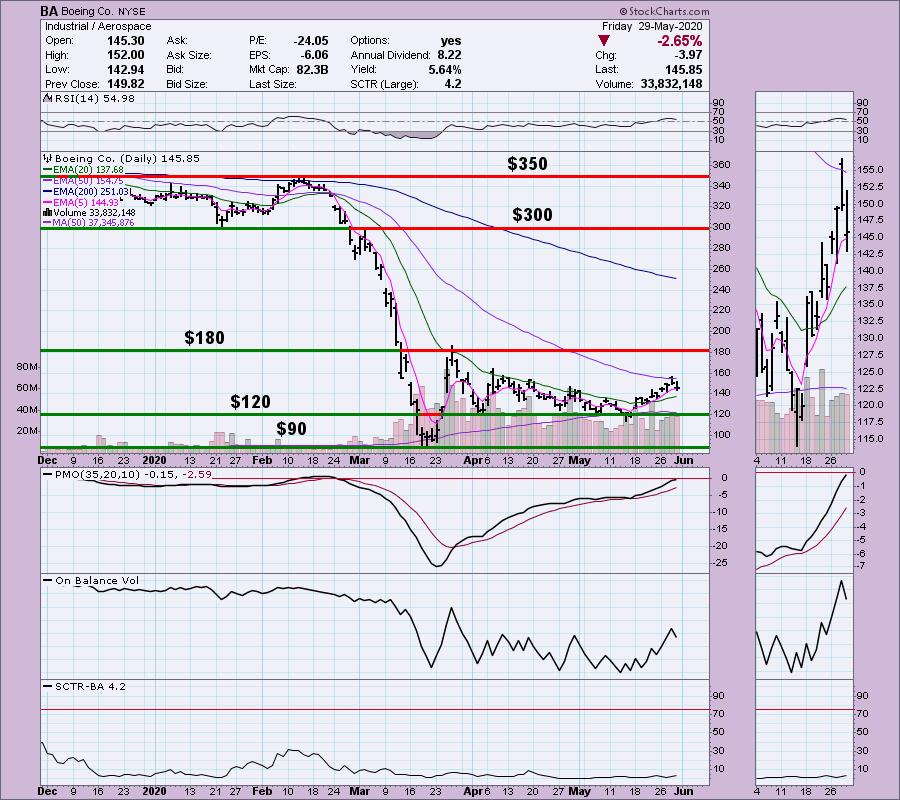
Identifying Stocks with High Short Interest Can Put $'s in Your Pocket!

by John Hopkins,
President and Co-founder, EarningsBeats.com
When looking for solid long trading candidates, one of the things astute traders look for are those stocks with high short interest. In other words, those stocks that traders are heavily betting against. Why, you might ask? Because if you can identify companies with a high percentage of short interest...
READ MORE
MEMBERS ONLY

This Technician's Confession: There's One Essential Fundamental Indicator I've Embraced For Decades

by Gatis Roze,
Author, "Tensile Trading"
I've acknowledged in numerous previous blogs and in our book that I'm not exclusively a 100% pure chartist. I know... blasphemy!
Yes, I use fundamentals. I need fundamentals, I won't trade without fundamentals. But the key is that I'm neither a fundamentalist...
READ MORE
MEMBERS ONLY
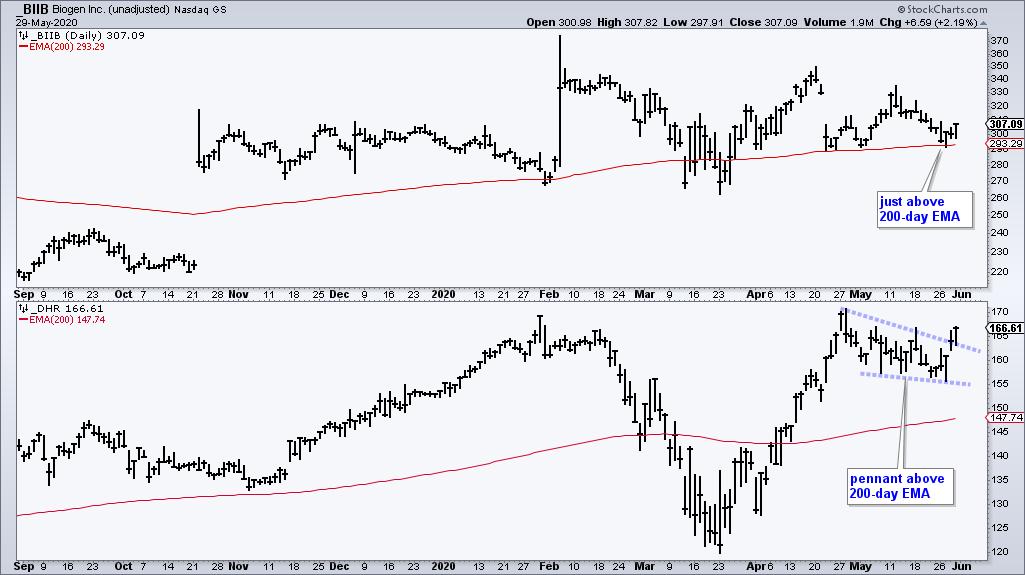
A Bullish Continuation Pattern for a Sector with Strong Breadth

by Arthur Hill,
Chief Technical Strategist, TrendInvestorPro.com
Chartists can separate the leading sectors from the lagging sectors by sorting with various breadth indicators. The 200-day EMA is a long-term trend indicator that can also be used as a breadth indicator. A stock is in an uptrend when above the 200-day EMA and in a downtrend below. The...
READ MORE
MEMBERS ONLY
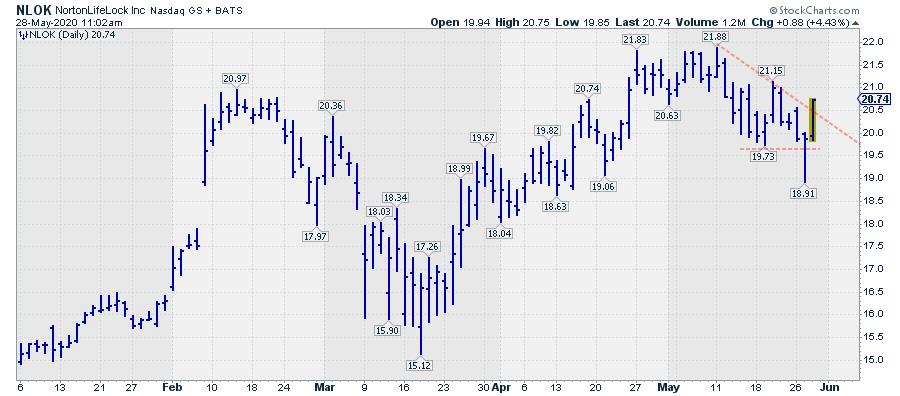
Is NortonLifeLock-ing In a New Low?

by Julius de Kempenaer,
Senior Technical Analyst, StockCharts.com
One of my alerts on StockCharts.com is based on the "Turtle Soup" Strategy, which was described by Larry Connors and Linda Raschke in their book Street Smarts in 1996!!
I like this setup because it looks for entries around potential tops and bottoms, and is therefore a...
READ MORE
MEMBERS ONLY

DP Show: How to Choose the Best Indicators
by Erin Swenlin,
Vice President, DecisionPoint.com

by Carl Swenlin,
President and Founder, DecisionPoint.com
In this episode of DecisionPoint, following a discussion of current market conditions, Carl discusses the importance of choosing the right indicators for your charts and explains his rationale for including the indicators that DecisionPoint uses regularly. Carl also discusses the concept of bear markets and bear market rallies. Erin finishes...
READ MORE
MEMBERS ONLY
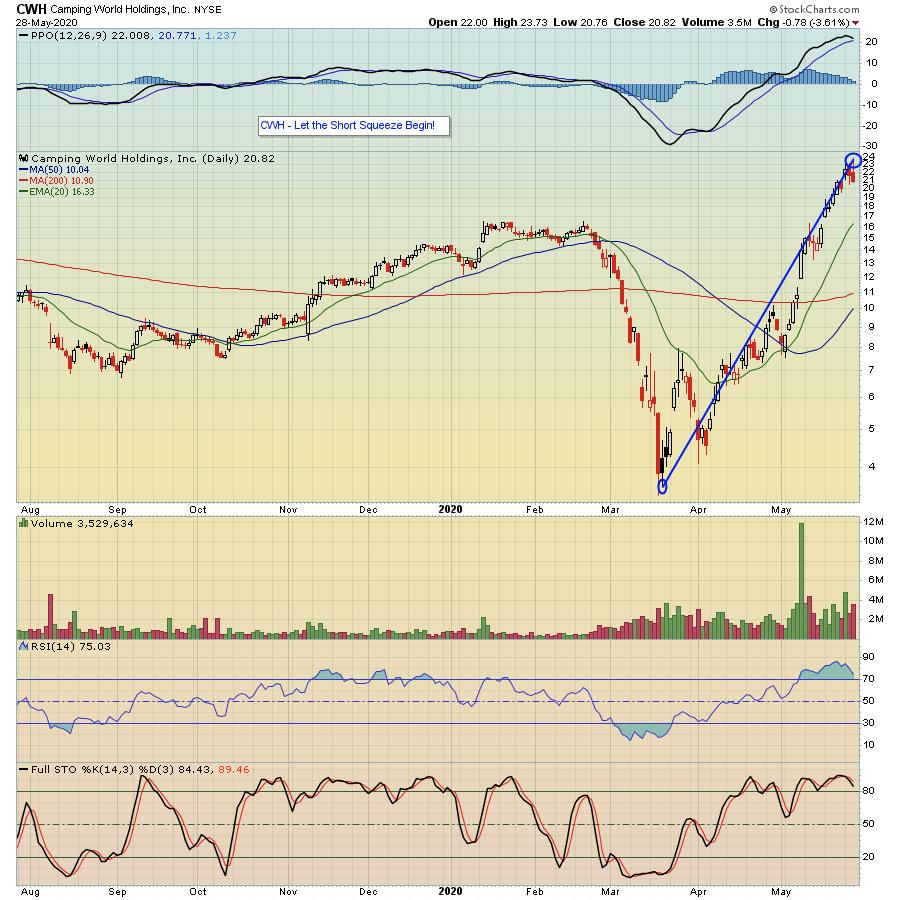
Latest Short Squeeze Call Is Strangling The Bears

by Tom Bowley,
Chief Market Strategist, EarningsBeats.com
In developing our Short Squeeze ChartList, which is a fancy name for doing our homework and organizing potentially explosive stocks into one ChartList for our members, we were looking for companies that traders are betting against. When traders believe a company is overpriced, for whatever reason, they sell that stock...
READ MORE
MEMBERS ONLY

Lots of Instruments Launched - and Almost Launched - Today
By the time you read this, NASA will have canceled its scheduled launch to send the first humans in space in nearly a decade. Regardless, SpaceX's Crew Dragon Capsule, with Bob Benhken and Doug Hurley (astronauts) aboard, represents a great era for the USA. Hopefully, with a successful...
READ MORE
MEMBERS ONLY

Sector Spotlight: Your View Depends on Your Timeframe
by Julius de Kempenaer,
Senior Technical Analyst, StockCharts.com
On this episode of Sector Spotlight, I review the current rotations for asset classes and sectors. In addition, I explain how your investment horizon and timeframe is crucial in determining how you view the markets.
This video was originally broadcast on May 26th, 2020. Click anywhere on the Sector Spotlight...
READ MORE
MEMBERS ONLY

S&P Fails at its 200-Day MA and NASDAQ Closes a Major Gap
by Martin Pring,
President, Pring Research
* March Was a Really Strong Bottom
* NASDAQ Closes a Gap
* S&P Fails at its 200-Day MA
* Conclusion
March Was a Really Strong Bottom
Tuesday's action looks bullish on the surface, but may signal the end of the rally. I emphasized the word "may" not...
READ MORE
MEMBERS ONLY
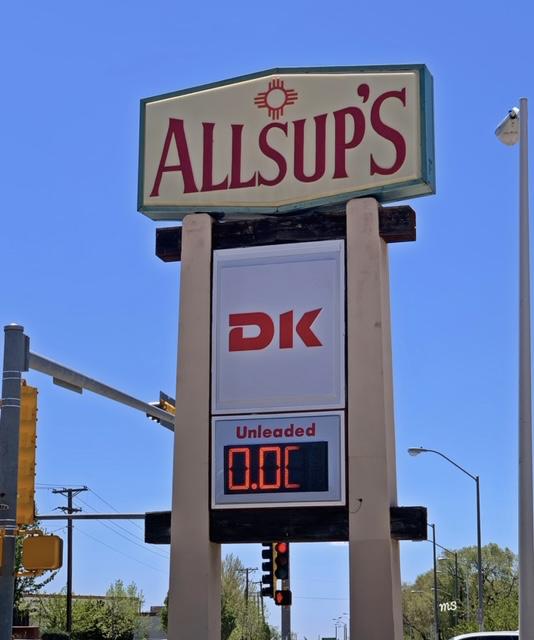
Oil & Gas
I knew that this picture would become one for the history textbooks!
A while back, we pondered whether the worst of the oil market debacle was over. Currently, that depends on a lot of "ifs":
* If OPEC adheres to its 9.7 million barrels a day.
* If Russia...
READ MORE
MEMBERS ONLY

Trillion Dollar Stocks at the Bottom of the Pile
by Carl Swenlin,
President and Founder, DecisionPoint.com
On a day when the Dow was up +529.95 points, I thought it was odd that it's two giant components, Apple (AAPL) and Micrsoft (MSFT), finished the day at a loss and at the bottom of the list sorted by percent change. Maybe this is just a...
READ MORE
MEMBERS ONLY
Limited Time Offer on Consumer Discretionary

by David Keller,
President and Chief Strategist, Sierra Alpha Research
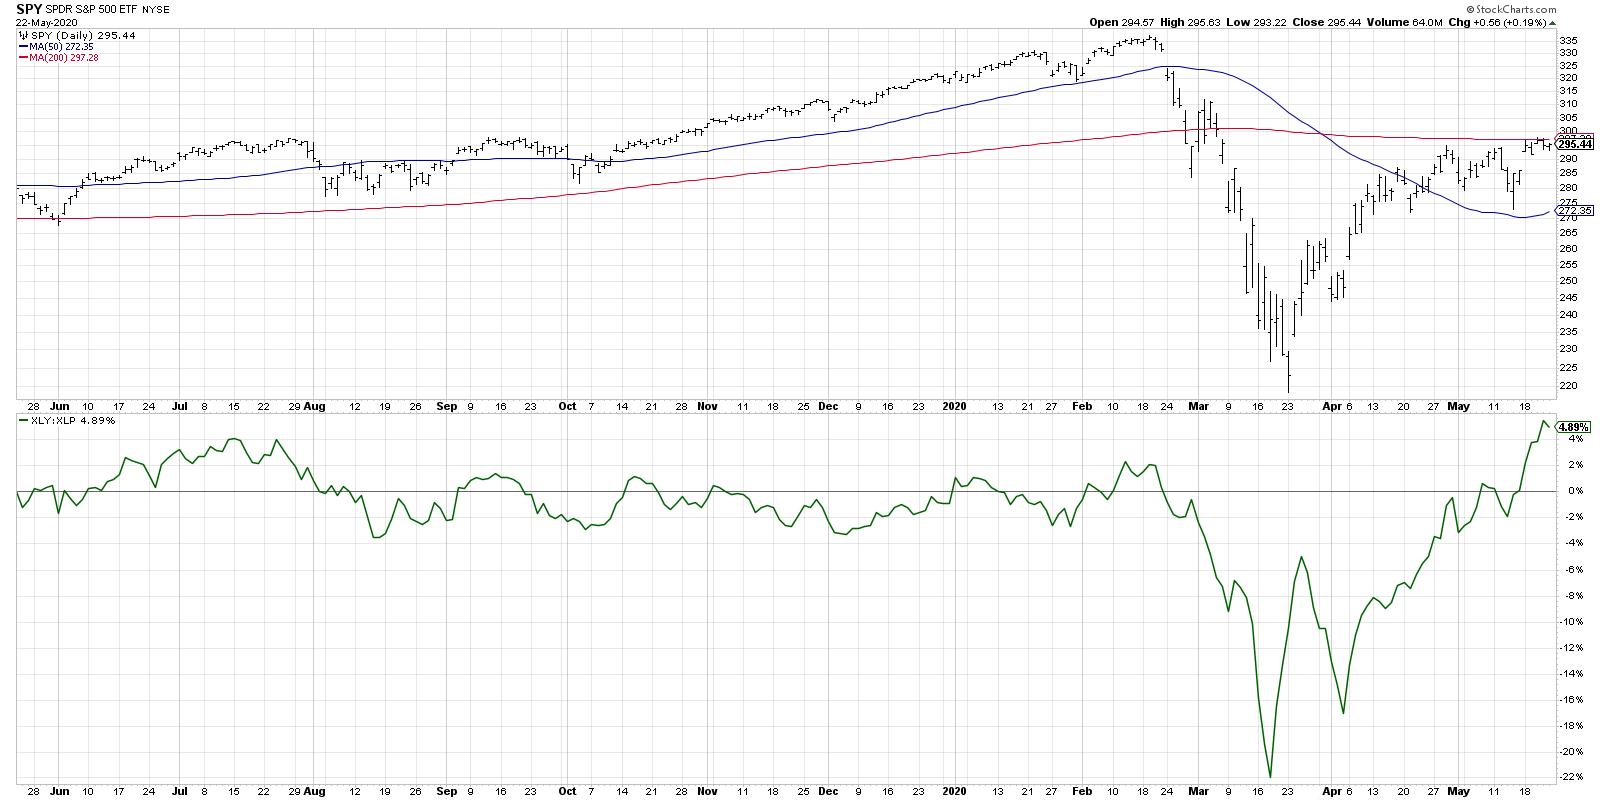
One of my favorite ratios to track offense vs. defense within the equity markets is the Consumer Discretionary sector (XLY) divided by the Consumer Staples sector (XLP). But a look under the hood shares narrow leadership and questionable upside.
Below, we see the S&P 500 ETF along with...
READ MORE
MEMBERS ONLY

An Exceptional Bear Market

by Greg Morris,
Veteran Technical Analyst, Investor, and Author
We think it is a good time to review bear markets, since we just had one, or are still in one, depending on the definition you choose to use. It is generally accepted that a bear market occurs when the stock market is down at least 20% from recent highs....
READ MORE
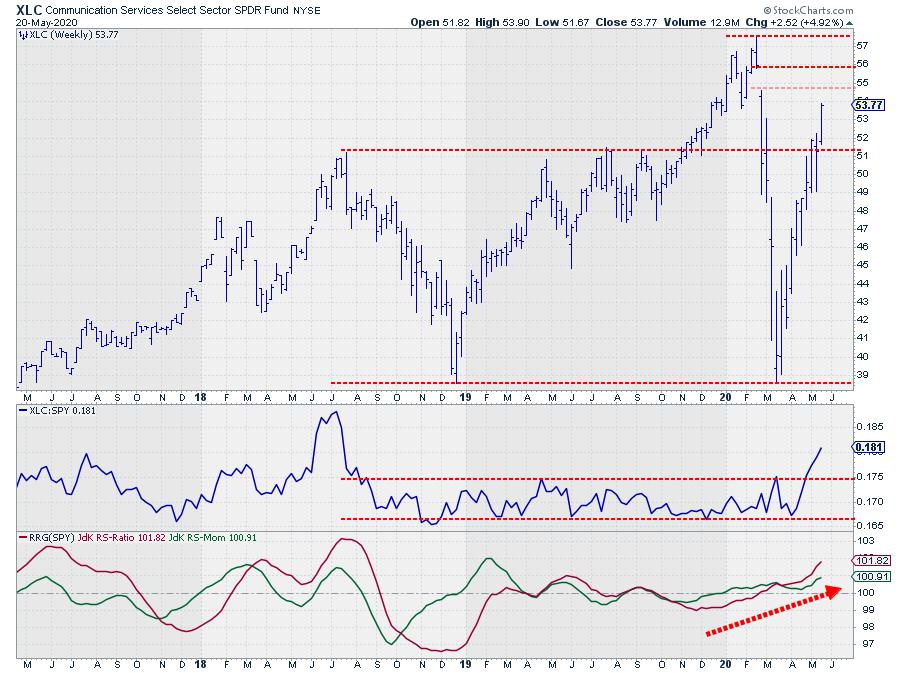
MEMBERS ONLY

Facebook On its Way to $290
by Julius de Kempenaer,
Senior Technical Analyst, StockCharts.com
Communication is key...
The Communication Services started to come alive again after a dull period, at least in relative terms.
Recently, I wrote about the sector here in a Don't Ignore This Chart article ("Is Everybody Calling and Texting or What?"). In addition, in the first...
READ MORE
MEMBERS ONLY

"10 I'm Stalking" - Top Charts and Intriguing Trades (Week of May 25, 2020)

by Grayson Roze,
Chief Strategist, StockCharts.com
As you may well know, I talk a lot about my weekly routine. More specifically, I talk a lot about my "Sunday Portfolio Review". I've said it before and I'll say it again – my weekend review is the most important part of my investing...
READ MORE
MEMBERS ONLY

Work Area Ahead

by Bruce Fraser,
Industry-leading "Wyckoffian"
The worldwide COVID-19 lockdown has produced massive unemployment trends. In the U.S. unemployment is moving rapidly toward the 20% level. Sheltering-in-Place has established many new societal trends. Some of these trends we have explored as the ‘Stay-at-Home Economy' theme. Here we will discern some of the new work...
READ MORE
MEMBERS ONLY

Quantifying the QQQ Effect on SPY
by Arthur Hill,
Chief Technical Strategist, TrendInvestorPro.com
We all know that many stocks in the Nasdaq 100 ETF (QQQ) are also part of the S&P 500 SPDR (SPY). In addition, it is clear that these QQQ stocks affect the performance of SPY. But how much exactly? Today we will answer that question and compare performance...
READ MORE
MEMBERS ONLY
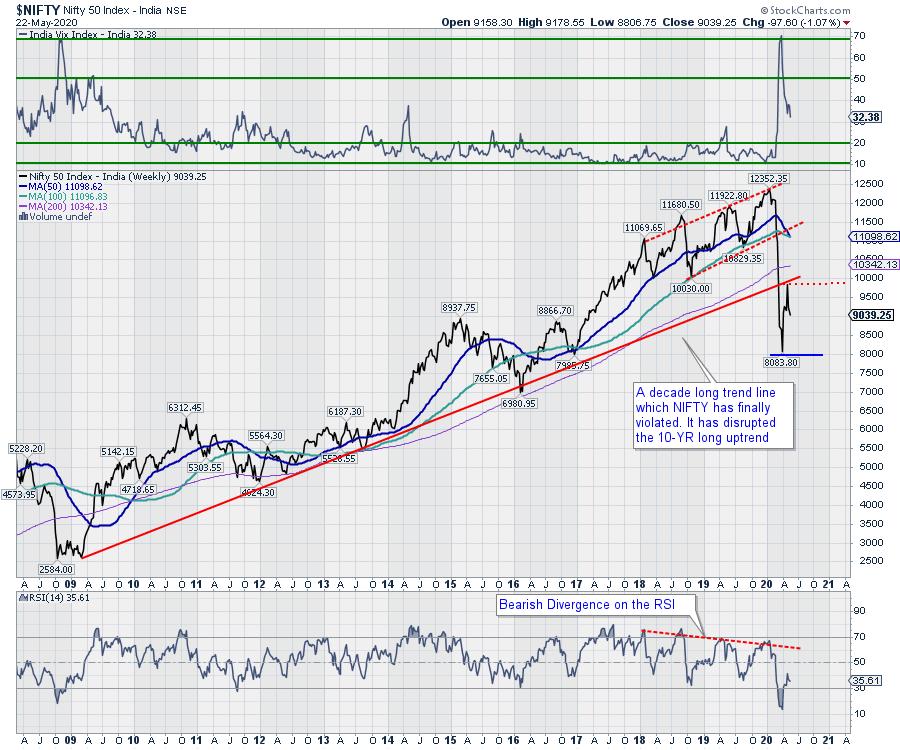
Week Ahead: NIFTY May See Ranged Movements; RRG Chart Tells This Sector May Offer Maximum Alpha
by Milan Vaishnav,
Founder and Technical Analyst, EquityResearch.asia and ChartWizard.ae
Markets ended a week that continued to play out much on the expected lines, except for the fact that the volatility was much less than what was expected. Also, the markets continued to display lack of directional bias throughout the week. Despite making a sharply lower top and lower bottom...
READ MORE
MEMBERS ONLY
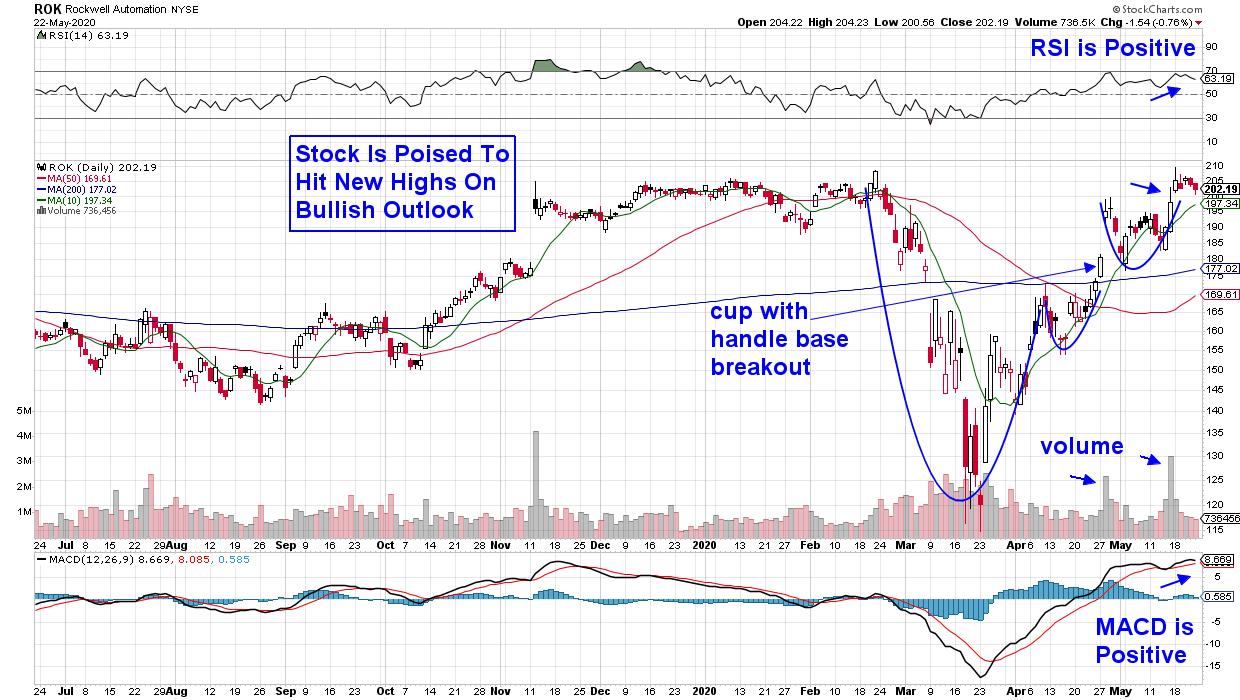
One Area That's Due To Grow In The Post-Pandemic Economy
by Mary Ellen McGonagle,
President, MEM Investment Research
The unforeseen usefulness of robots during the current global lockdown has kicked up interest in an already-growing area of the markets. Companies have poured billions of dollars into the development of technology to create all kinds of robots, designed to help with deliveries, transportation and manufacturing, and demand has never...
READ MORE
MEMBERS ONLY
Limited-Time Offer on Consumer Discretionary
by David Keller,
President and Chief Strategist, Sierra Alpha Research
One of my favorite ratios to track offense vs. defense within the equity markets is the Consumer Discretionary sector (XLY) divided by the Consumer Staples sector (XLP). But a look under the hood shares narrow leadership and questionable upside.
Below, we see the S&P 500 ETF along with...
READ MORE
MEMBERS ONLY
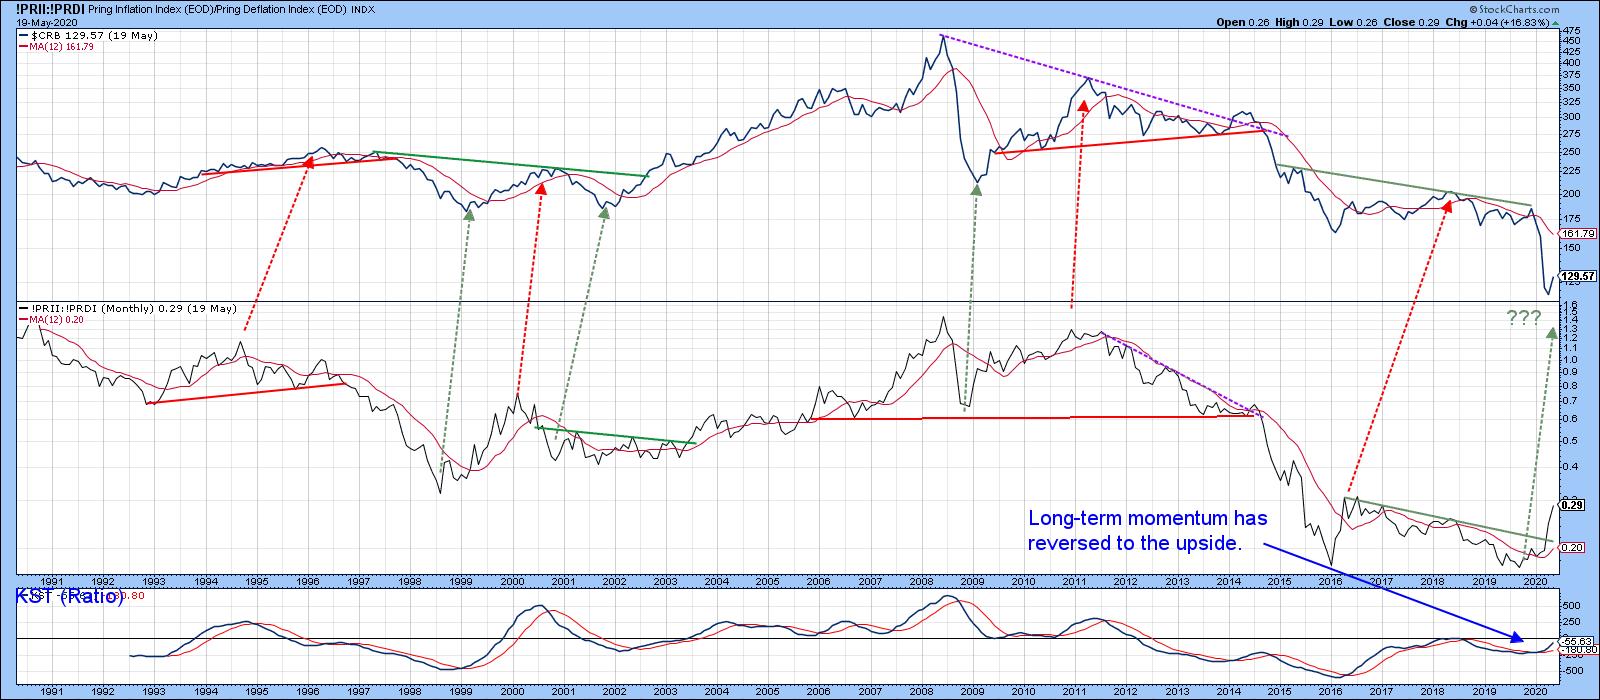
Commodity Indexes Reach Important Breakout Points
by Martin Pring,
President, Pring Research
The Stock Market is Forecasting Higher Commodity Prices
[One big] thing going positive for commodities is my Inflation/Deflation ratio. This series pits equities sensitive to swings in commodity prices, such as natural resource stocks, to those that do better when interest rates are falling, such as utilities, consumer staples,...
READ MORE
MEMBERS ONLY

New Buys Amid Sector Rotation
by Mary Ellen McGonagle,
President, MEM Investment Research
In this episode of StockCharts TV's The MEM Edge, Mary Ellen reviews new areas that are turning bullish and the best way to get in front of positive candidates. She also uncovered how to trade the powerful moves in stocks that gap up.
This video was originally recorded...
READ MORE
MEMBERS ONLY

Virtually Travel the World and Make Money! (+Video)
I have spent most of the time in 2020 analyzing, writing and speaking about the US markets and commodities. Therefore, I thought it time to explore the International ETF Country Funds.
I have vetted them for you.
In the latest presentation I did for my show on StockCharts TV, I...
READ MORE
MEMBERS ONLY
How I Scan ChartLists For High Profit Trades
by Tom Bowley,
Chief Market Strategist, EarningsBeats.com
I have a routine that I've implemented where I typically review market action around 10:00am ET, 30 minutes after the market has opened. It's not at all unusual to see uptrending stocks down in the morning, so running scans at about that 30-minute mark can...
READ MORE
MEMBERS ONLY

Sector BETA Can Help You with General Market Direction
by Julius de Kempenaer,
Senior Technical Analyst, StockCharts.com
Some time ago, I started to play around with BETA as a metric to gauge risk appetite for sectors, then went from there to the general market. If you search for BETA in ChartSchool you will find this entry:
Beta: A measure of a security's systematic or market...
READ MORE
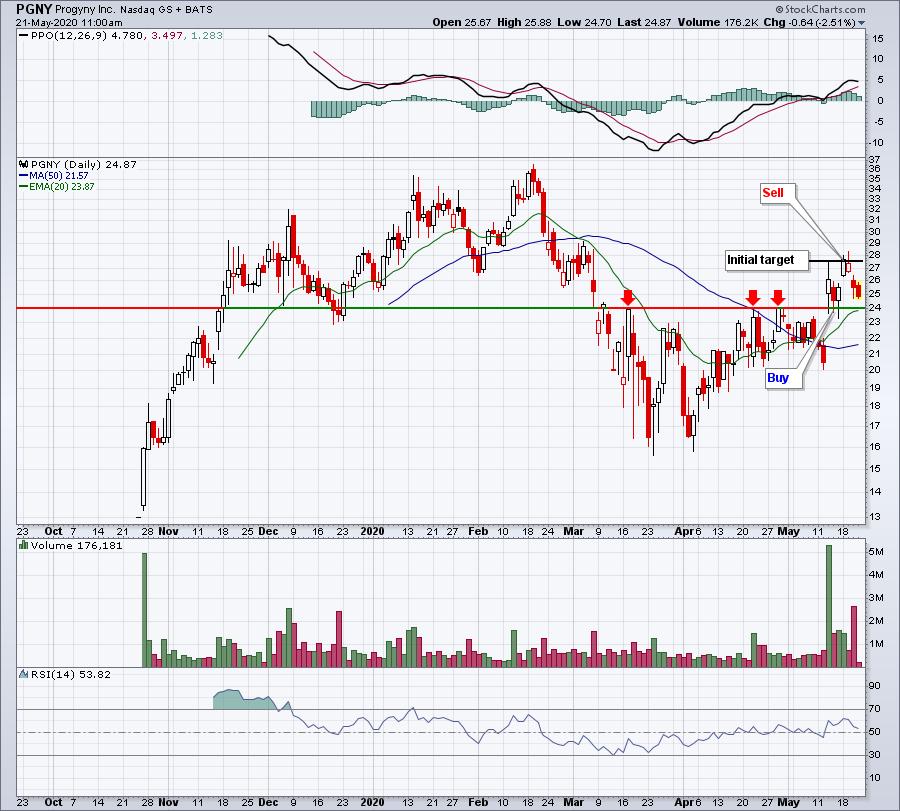
MEMBERS ONLY
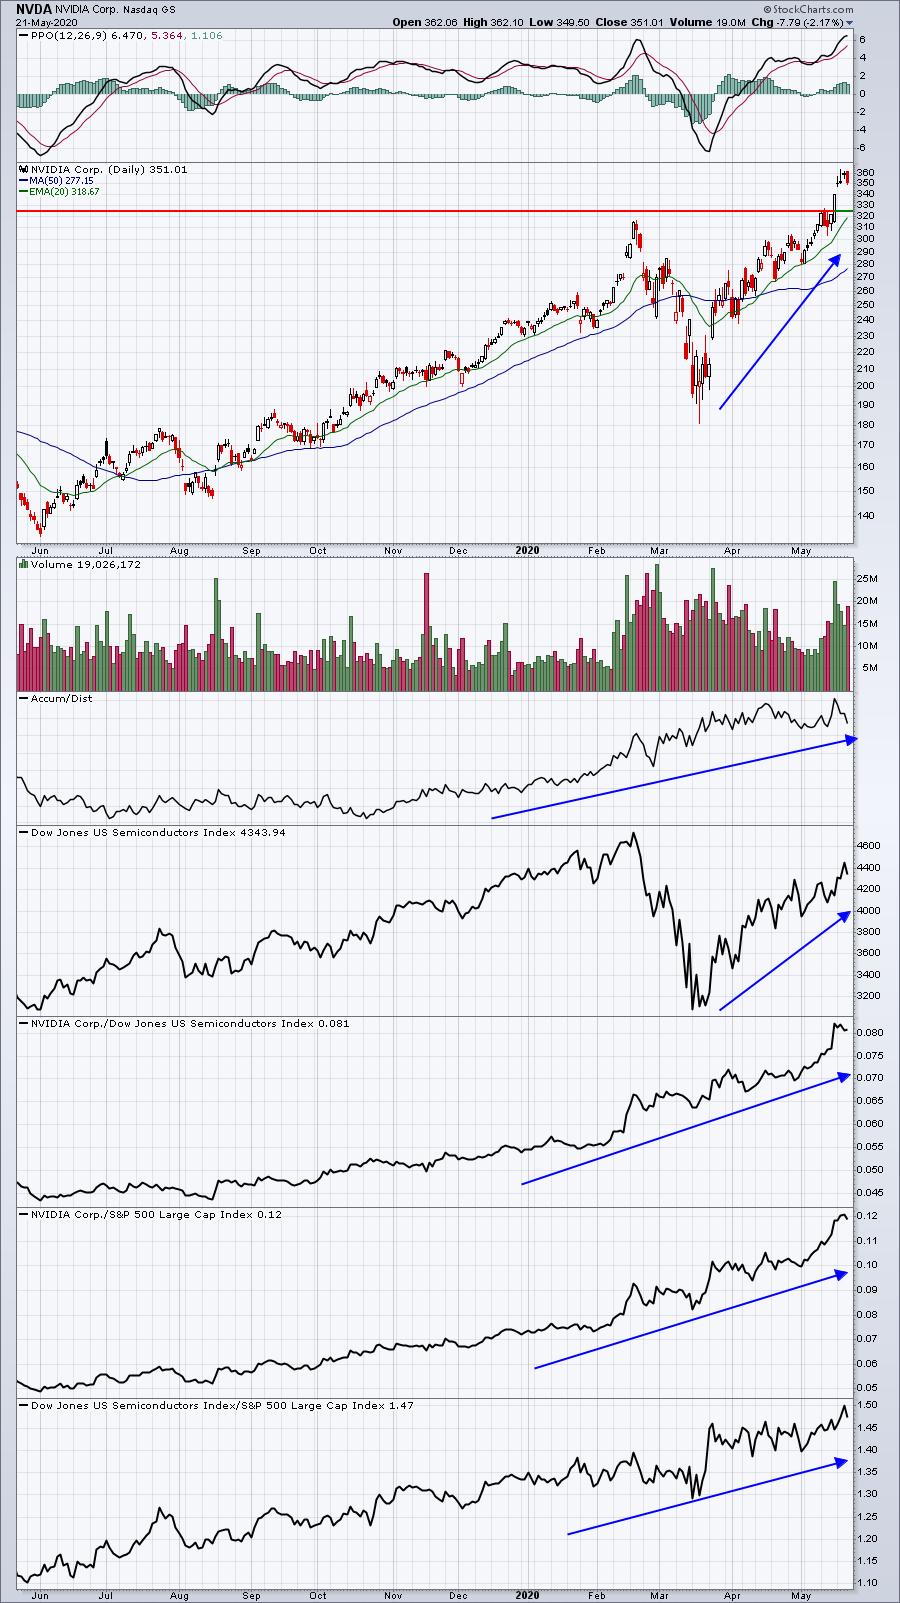
NVDA Blows Away Estimates - Exactly What Wall Street Expected
by Tom Bowley,
Chief Market Strategist, EarningsBeats.com
Last night, after the closing bell, NVIDIA Corp (NVDA) did what Wall Street expected - it blew the doors off its earnings. Revenues were reported at $3,080.00 vs. its consensus estimate of $2,995.27 and EPS came in ahead of expectations at $1.80 vs. $1.69....
READ MORE
MEMBERS ONLY
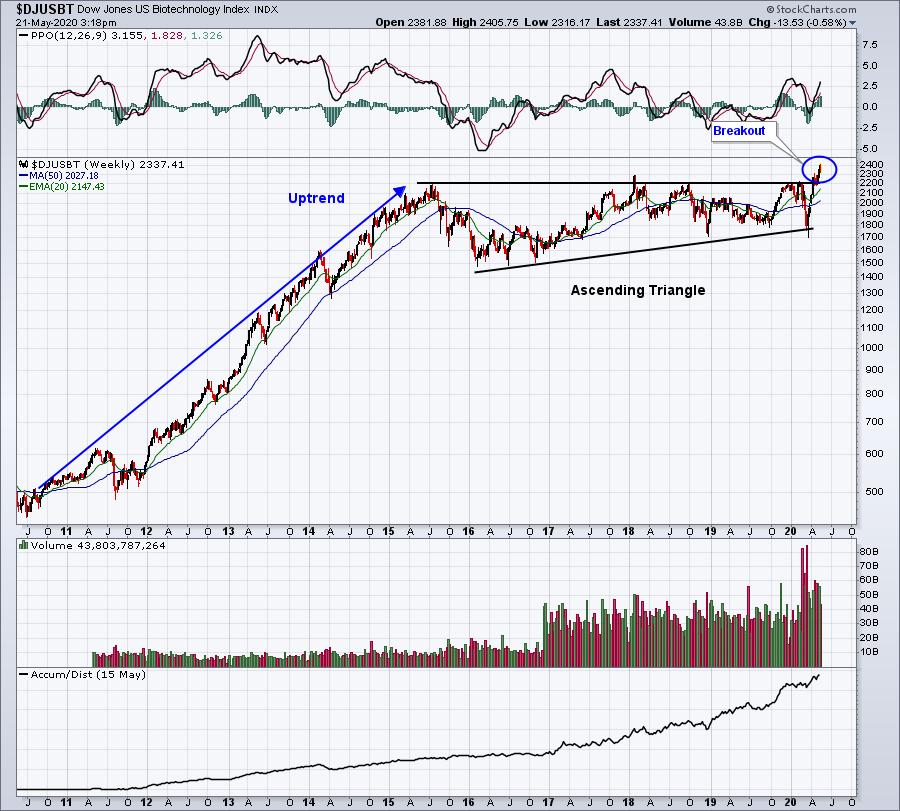
I See An Index Breaking Out, But How Do I Find An ETF That Tracks It?
by Tom Bowley,
Chief Market Strategist, EarningsBeats.com
I review a lot of the Dow Jones industry indices, but one problem is that you cannot trade an index. Naturally, I receive plenty of questions like "how can I benefit from semiconductors if the Dow Jones U.S. Semiconductor Index ($DJUSSC) is breaking out? Obviously, one way would...
READ MORE
MEMBERS ONLY

Commodity Indexes Reach Important Breakout Points
by Martin Pring,
President, Pring Research
* Gold Has Done its Work as a Leading Commodity Indicator
* The Stock Market is Forecasting Higher Commodity Prices
* Commodities on the Verge of a Breakout
* Oil VIX Signals a Major Bottom in Oil Prices
Three weeks ago, I raised the question as to whether commodities had begun to embark on...
READ MORE
MEMBERS ONLY

APPAREL RETAILERS LEAD XLY HIGHER -- AIRLINES ARE HOLDING TRANSPORTS BACK -- STRONGER RAILS AND TRUCKERS ARE A VOTE OF CONFIDENCE IN THE U.S. ECONOMY

by John Murphy,
Chief Technical Analyst, StockCharts.com
APPAREL RETAILERS LEAD XLY HIGHER... Chart 1 shows the Consumer Discretionary SPDR (XLY) trading at the highest level in three months and north of its 200-day average. The XLY/SPX relative strength ratio in the upper box is also rising. Apparel retailers are leading the XLY higher. Chart 2 shows...
READ MORE
MEMBERS ONLY

DP Show: Can the Market Continue Up, Up, Up?
by Erin Swenlin,
Vice President, DecisionPoint.com
by Carl Swenlin,
President and Founder, DecisionPoint.com
In this episode of DecisionPoint, Erin and Carl begin the show with a lively discussion of current market conditions after yet another breakout on Wednesday. Should investors expect even higher prices? Looking at exclusive DecisionPoint.com indicators, Carl and Erin have the answers! Carl examines SPX earnings and compares the...
READ MORE
MEMBERS ONLY
Is Everybody Calling and Texting or What?
by Julius de Kempenaer,
Senior Technical Analyst, StockCharts.com
Communication Services seem to be in high demand, looking at the price chart for XLC.
After the March crash - or was it "just a dip," with hindsight? - XLC rapidly bounced back with a vengeance. I have annotated the chart above with some horizontal support and resistance...
READ MORE
MEMBERS ONLY

Masks Off - Or is That Risk Off?
Tuesday night, we reminisced that, on February 5th, I wrote in a blog, "Although the last couple of days brought back euphoria into the market, with volatility hanging tough, one should be prepared for anything."
That sentiment remains true right now.
With volatility holding recent lows while NASDAQ...
READ MORE
MEMBERS ONLY

Unfolding the Onion Layers of Trading Psychology

by Dave Landry,
Founder, Sentive Trading, LLC
In this edition of Trading Simplified, Dave gives a quick market update, then continues sharing the Trading Rules he uses to peel back the onion layers of trading psychology. These including being brutally honest with yourself, being process-oriented and completing postmortems of your trades.
This video was originally broadcast on...
READ MORE
MEMBERS ONLY

STOCKS HAVE ANOTHER STRONG DAY -- S&P 500 NEARS TEST OF 200-DAY AVERAGE -- ALL ELEVEN SECTORS ARE GAINING -- SMALLER STOCKS SHOW STRONG GAINS
by John Murphy,
Chief Technical Analyst, StockCharts.com
STOCKS CONTINUE RALLY MODE... Stock prices are trading sharply higher again today. Chart 1 shows the Nasdaq Composite Index ($COMPQ) trading at a three month high. Chart 2 shows the S&P 500 nearing a test of its 200-day moving average. Chart 3 shows the Dow Industrials nearing a...
READ MORE
MEMBERS ONLY
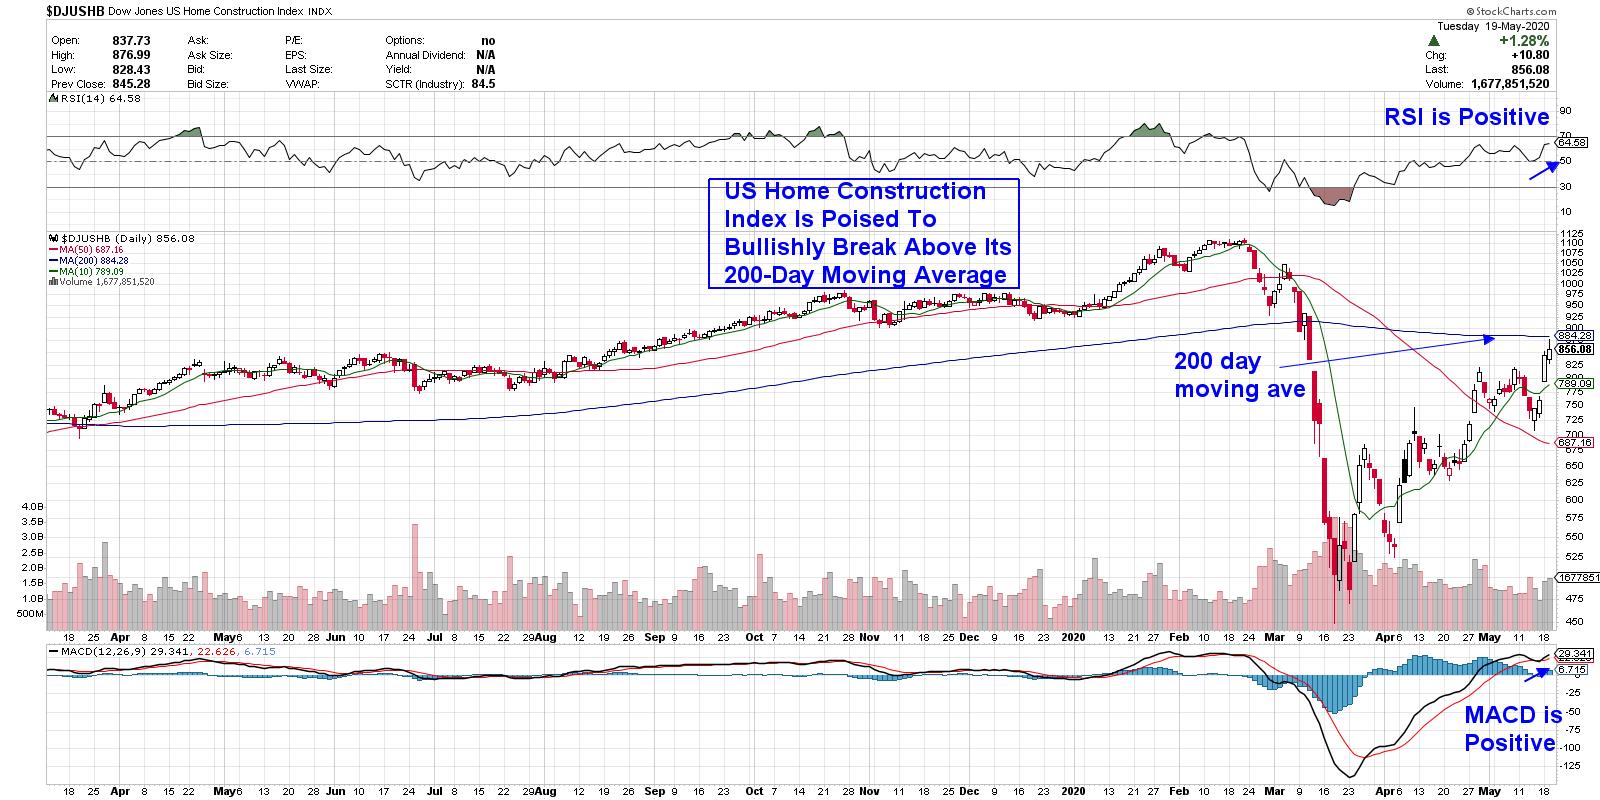
Stocks In This Group are Showing Bullish Momentum After Reporting Surprising Strength
by Mary Ellen McGonagle,
President, MEM Investment Research
While the fallout from COVID-19 is hitting home builders hard, analysts feel they could come out of this crisis less damaged than other industries.
On Tuesday, the Commerce Department reported that construction on new homes fell 30% in April as the sudden collapse in the economy weighed heavily. With unemployment...
READ MORE
