MEMBERS ONLY
STUNNING Results in Any Market

by John Hopkins,
President and Co-founder, EarningsBeats.com
When you stop to think about the overall environment we've all been working in these past few months, it's amazing to think there are some stocks that are at their all-time highs. Of course, whenever there is a crisis, there are stocks that benefit. This...
READ MORE
MEMBERS ONLY
Historic Market Divergence - What Should You Trade? (+ Video)
Stanley Druckenmiller recently came out and said that the market has never been this disconnected from reality - and that the risk/reward has never been this bad.
In an article, a journalist synthesized Ray Dalio's thoughts and research on the state of currencies and the debt crisis. This...
READ MORE
MEMBERS ONLY

Is The Bullish Bias Back in the Markets?

by Mary Ellen McGonagle,
President, MEM Investment Research
In this episode of StockCharts TV's The MEM Edge, Mary Ellen reviews the broader markets while highlighting specific areas that are poised to trade higher. She also follows up on stocks that have gapped up and the best way to take advantage as well as top stocks due...
READ MORE
MEMBERS ONLY
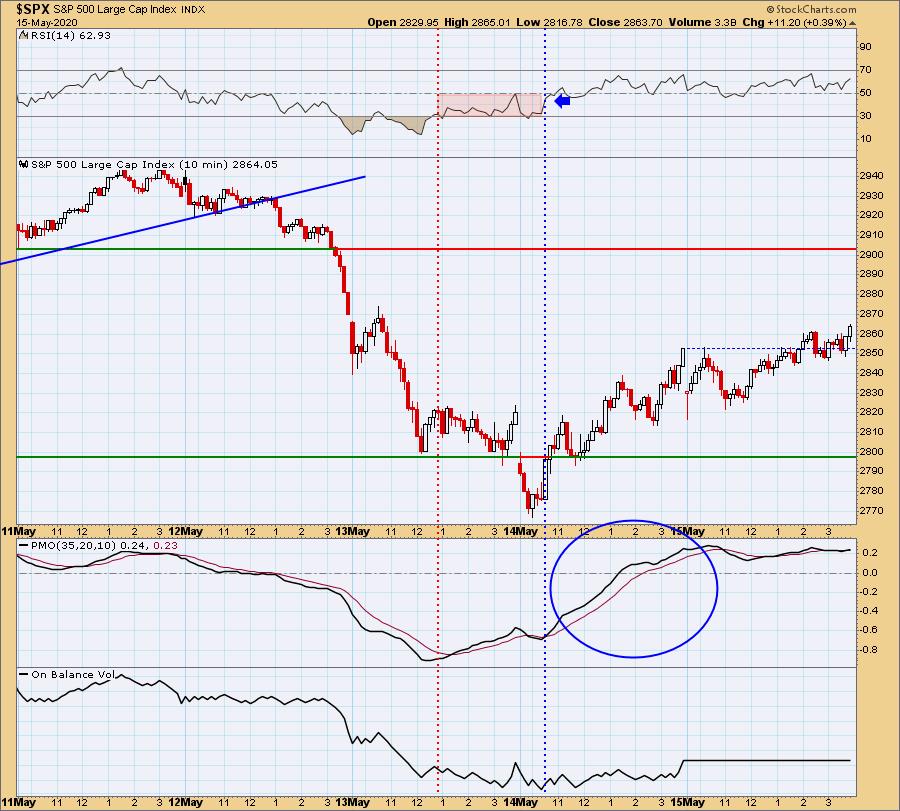
How To Catch Mid-Day Market Reversals

by Erin Swenlin,
Vice President, DecisionPoint.com
I received an email after trading on Wednesday 5/14 that included a great question about catching mid-day reversals:
"I struggle the most in days like today (5/14) where the market goes one way and then it changes direction. How do you identify when that is happening?...
READ MORE
MEMBERS ONLY
Timing the S&P 500 Using the Bullish Percent Index

by Arthur Hill,
Chief Technical Strategist, TrendInvestorPro.com
StockCharts calculates and publishes the Bullish Percent Indexes for several major indexes and sectors. Just search for the term $BP to find them because all the symbols begin with these three characters. These indicators are not part of my breadth models for broad market timing, but I do follow them,...
READ MORE
MEMBERS ONLY

STOCK INDEXES STABILIZE -- FINANCIALS REBOUND -- BANK INDEX TESTS MARCH LOW

by John Murphy,
Chief Technical Analyst, StockCharts.com
STOCK INDEXES STABILIZE NEAR SUPPORT... After a weak start this morning, major stock indexes are stabilizing near some short-term support levels. Chart 1 shows the Dow Industrials finding support at its 50-day moving average and its mid-April intraday low at 22900. Chart 2 shows the S&...
READ MORE
MEMBERS ONLY

This Health Care Stock Only Needs to Break Resistance

by Julius de Kempenaer,
Senior Technical Analyst, StockCharts.com
Inside the Health Care sector, IDXX is one of the stocks that stands out in a positive way.
Since mid-2019, IDXX has been bouncing against resistance around $290, but never managed to get to a clear break. The peak that was set in the week beginning 2/19 was...
READ MORE
MEMBERS ONLY

DP Show: Selling Exhaustion or Initiation?
by Erin Swenlin,
Vice President, DecisionPoint.com

by Carl Swenlin,
President and Founder, DecisionPoint.com
In this episode of DecisionPoint, after looking at the latest DP signal scoreboards, Carl and Erin discuss the recent deep dive in prices on the 10-minute bar chart and the implications shorter-term. A look at the bigger picture shows the very negative configuration of the indicators. Many parallels...
READ MORE
MEMBERS ONLY
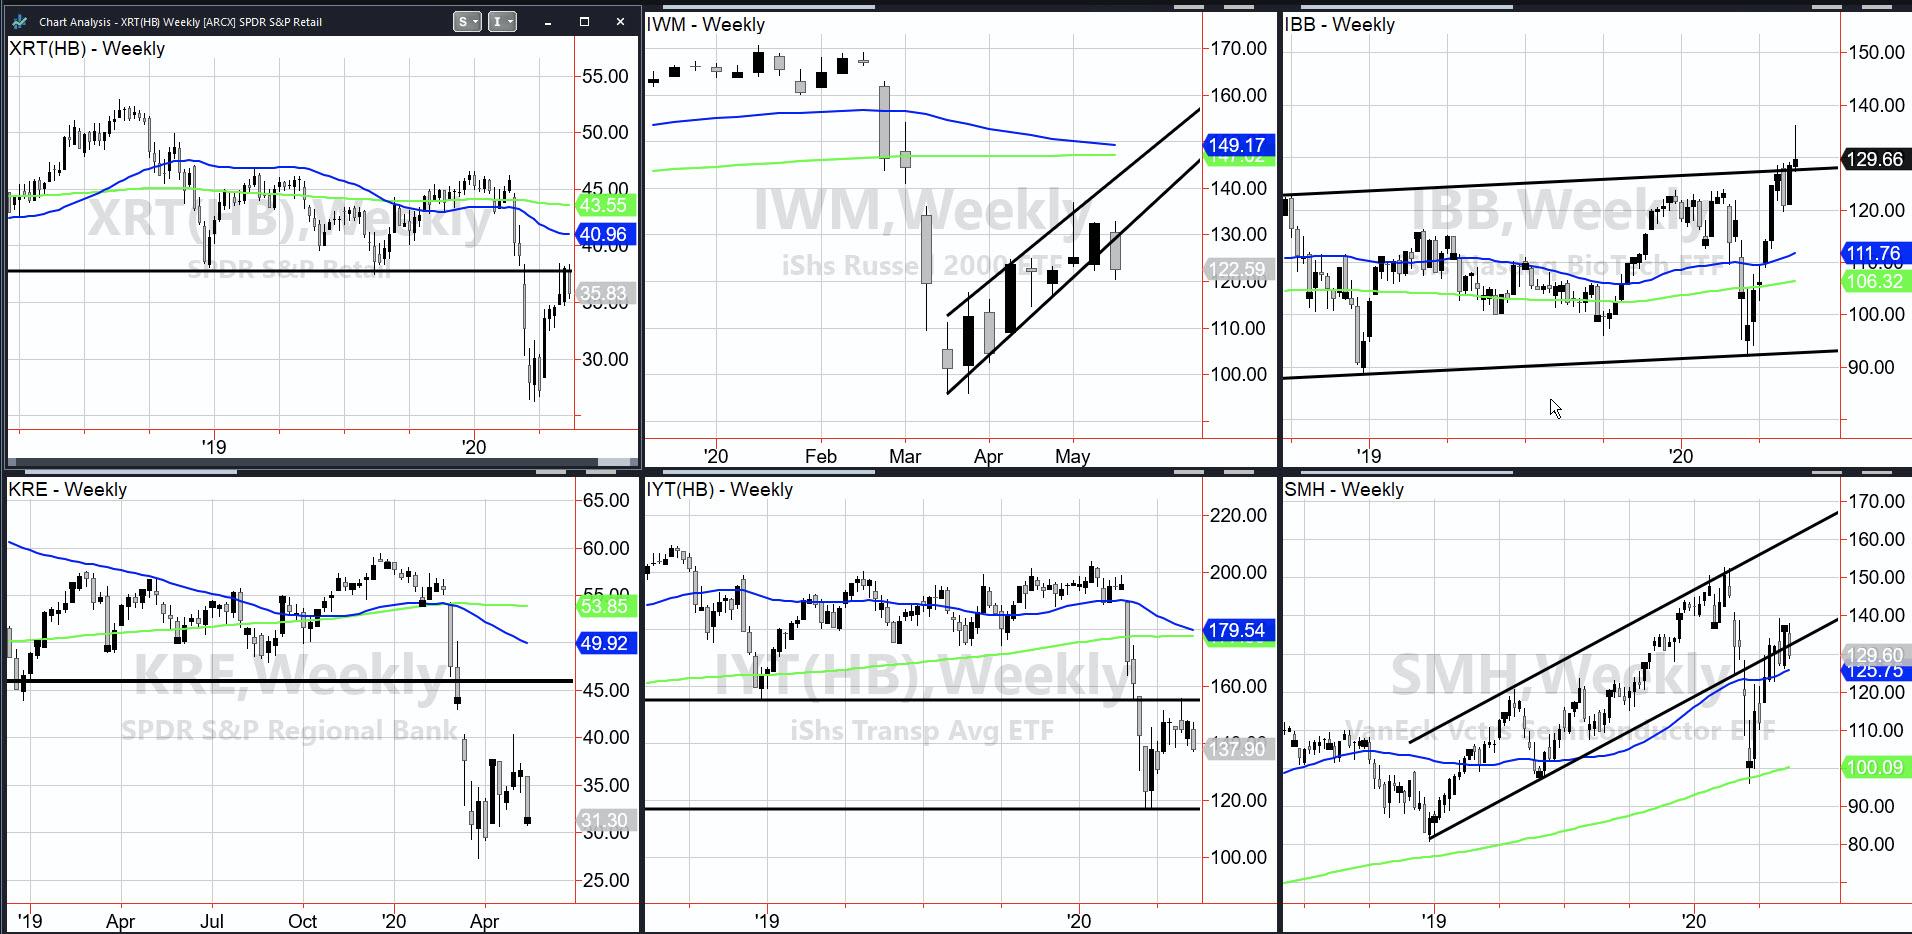
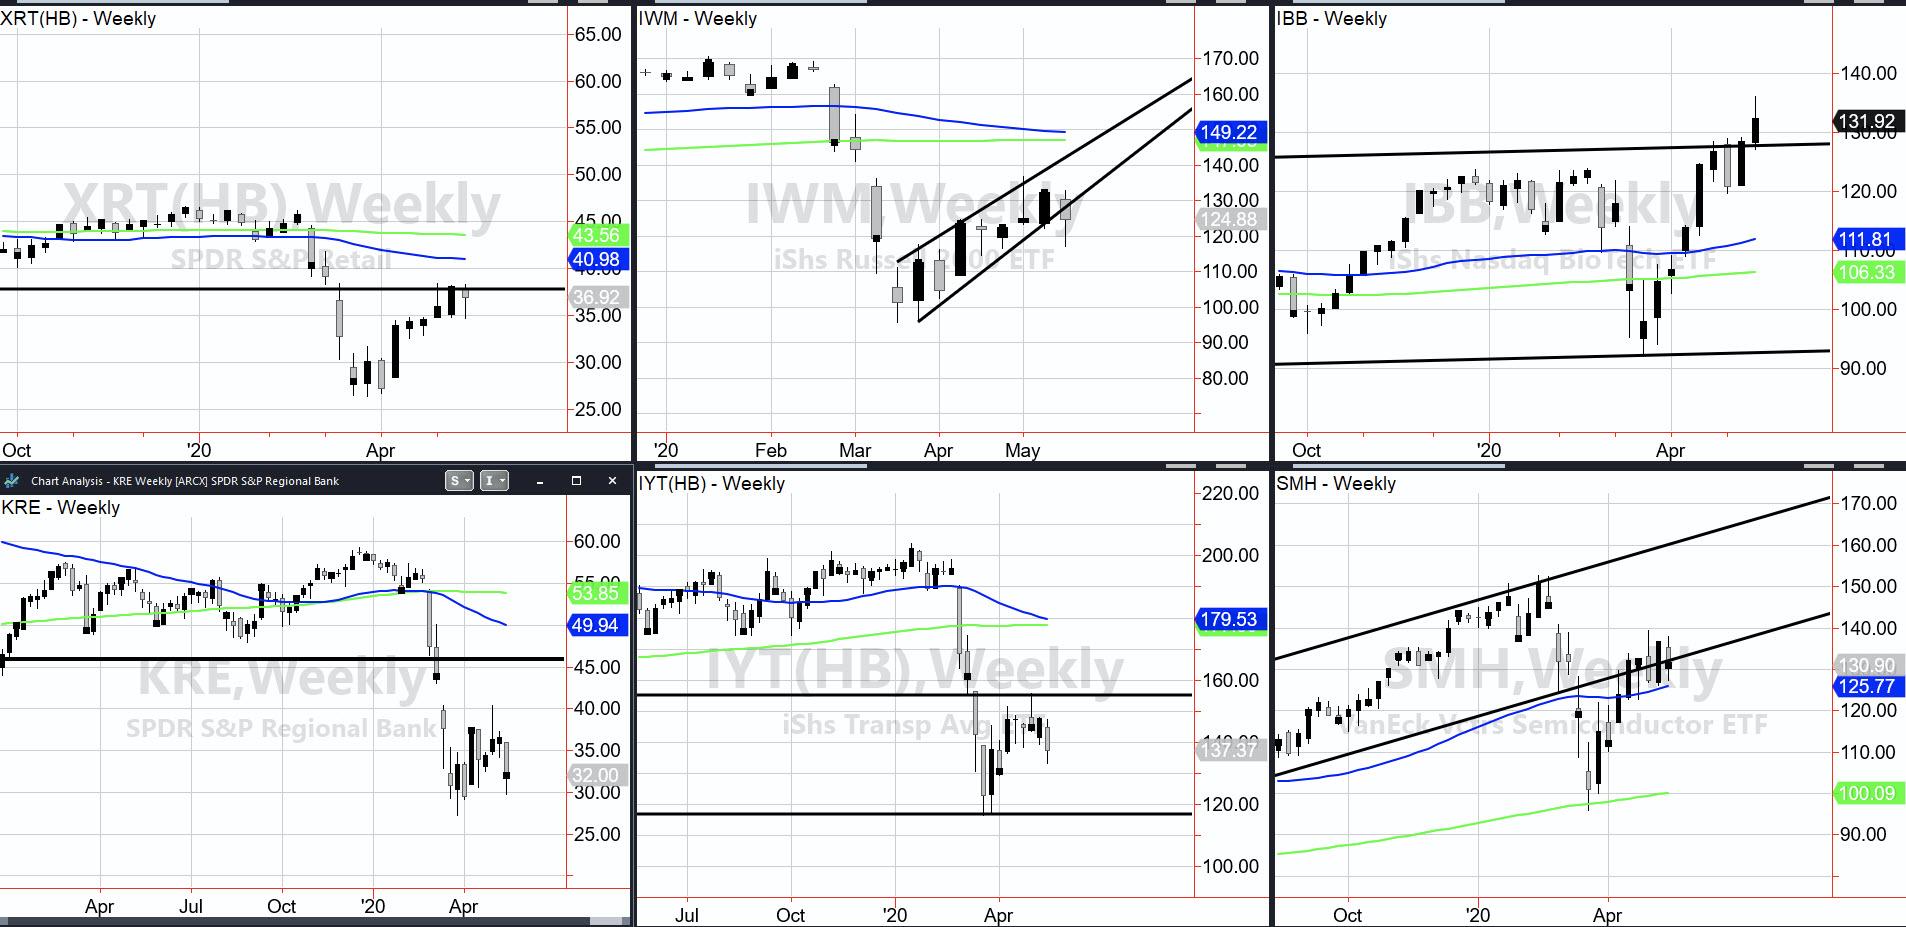
Checking in with the Economic Modern Family
Last night, I wrote about the compression in the weekly gold chart. Today, gold closed green, but did not take out 162 (GLD) or the top of last week's trading range high.
This is super exciting to watch unfold. Will it clear? And, if so, how far can...
READ MORE
MEMBERS ONLY

S&P Struggling Below Its 200-Day MA; Watch Those Financials!

by Martin Pring,
President, Pring Research
Last week, I pointed out that the S&P Composite, despite the strong rally off the March low, had failed to touch an overbought condition. That presented a problem, since a security that is unable to reach an overstretched reading is usually suffering from some kind of a bear...
READ MORE
MEMBERS ONLY

Special Note: These 3 Charts Show Why You Should Choose NIFTY Next 50 over Small-Caps

by Milan Vaishnav,
Founder and Technical Analyst, EquityResearch.asia and ChartWizard.ae
The global equity markets have seen the mother of all volatile times during the first five-and-a-half months of the year 2020. From the peak of early 2020, the key equity markets saw a sharp decline of over 35% in most cases. Following those lows, the stocks have...
READ MORE
MEMBERS ONLY

Indicators Don't Indicate, They Illustrate

by Dave Landry,
Founder, Sentive Trading, LLC
In this edition of Trading Simplified, Dave gives a quick Bear Market Update, then moves on to indicators. He explains why he likes to call indicators "illustrators" and introduces you to some new Landry indicators that are coming to the StockCharts Advanced Charting Platform (ACP).
This video was...
READ MORE
MEMBERS ONLY

NASDAQ 100 Just Tested Big Short-Term Resistance

by Tom Bowley,
Chief Market Strategist, EarningsBeats.com
Impulsive selling gripped the market yesterday afternoon for the first time in quite awhile and it came on the heels of a few warnings signs that I passed on to EarningsBeats.com members earlier this week. First, the accumulation/distribution line, which has been a HUGE friend of the bulls...
READ MORE
MEMBERS ONLY

STOCKS START THE DAY UNDER PRESSURE -- SMALL CAPS ARE LEADING THE DECLINE -- SO ARE FINANCIALS AND INDUSTRIALS
by John Murphy,
Chief Technical Analyst, StockCharts.com
DOW AND S&P 500 WEAKEN... Stock prices are continuing the pullback that began yesterday afternoon. And some short-term support levels may soon be tested. Chart 1 shows the Dow Industrials slipping below their 20-day average (green line) and in position to test their early May low...
READ MORE
MEMBERS ONLY
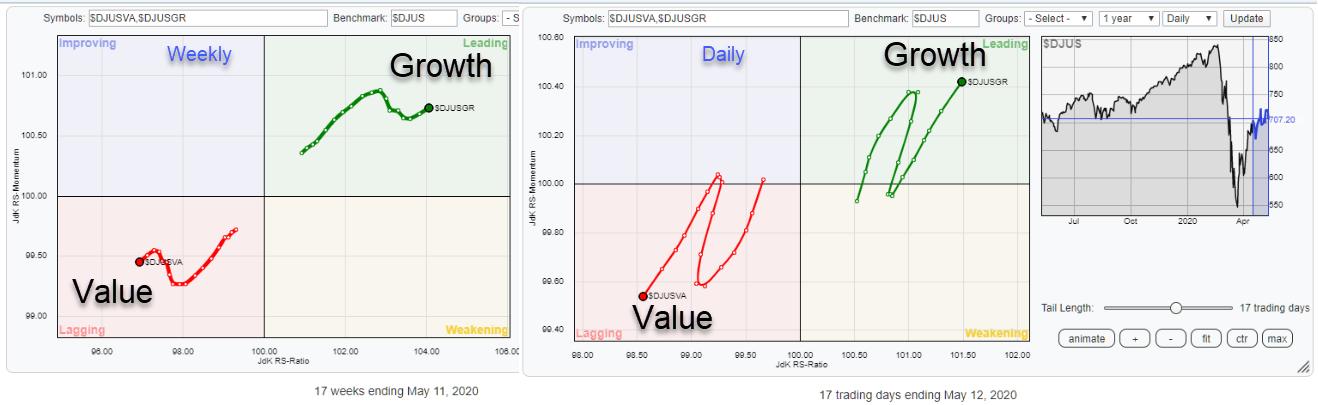
Have You Seen That Small-Cap Growth Stocks are Picking Up Momentum?
by Julius de Kempenaer,
Senior Technical Analyst, StockCharts.com
Growth-Value is a pre-defined group on the RRG page, showing the relative rotation for the Dow Jones Growth Index vs. Dow Jones Value Index, using the Dow Jones US index as the benchmark.
The last crossover for Value into the leading quadrant, and Growth into lagging, happened in...
READ MORE
MEMBERS ONLY

What is Compression? Four Inside Weeks in GLD
Compression is defined as the decrease in volume of any object or substance resulting from applied stress. Compression may be undergone by solids, liquids, and gases and by living systems.
And, apparently, by gold.
What is the applied stress in gold? First off, too many bears. Second, a relatively strong...
READ MORE
MEMBERS ONLY
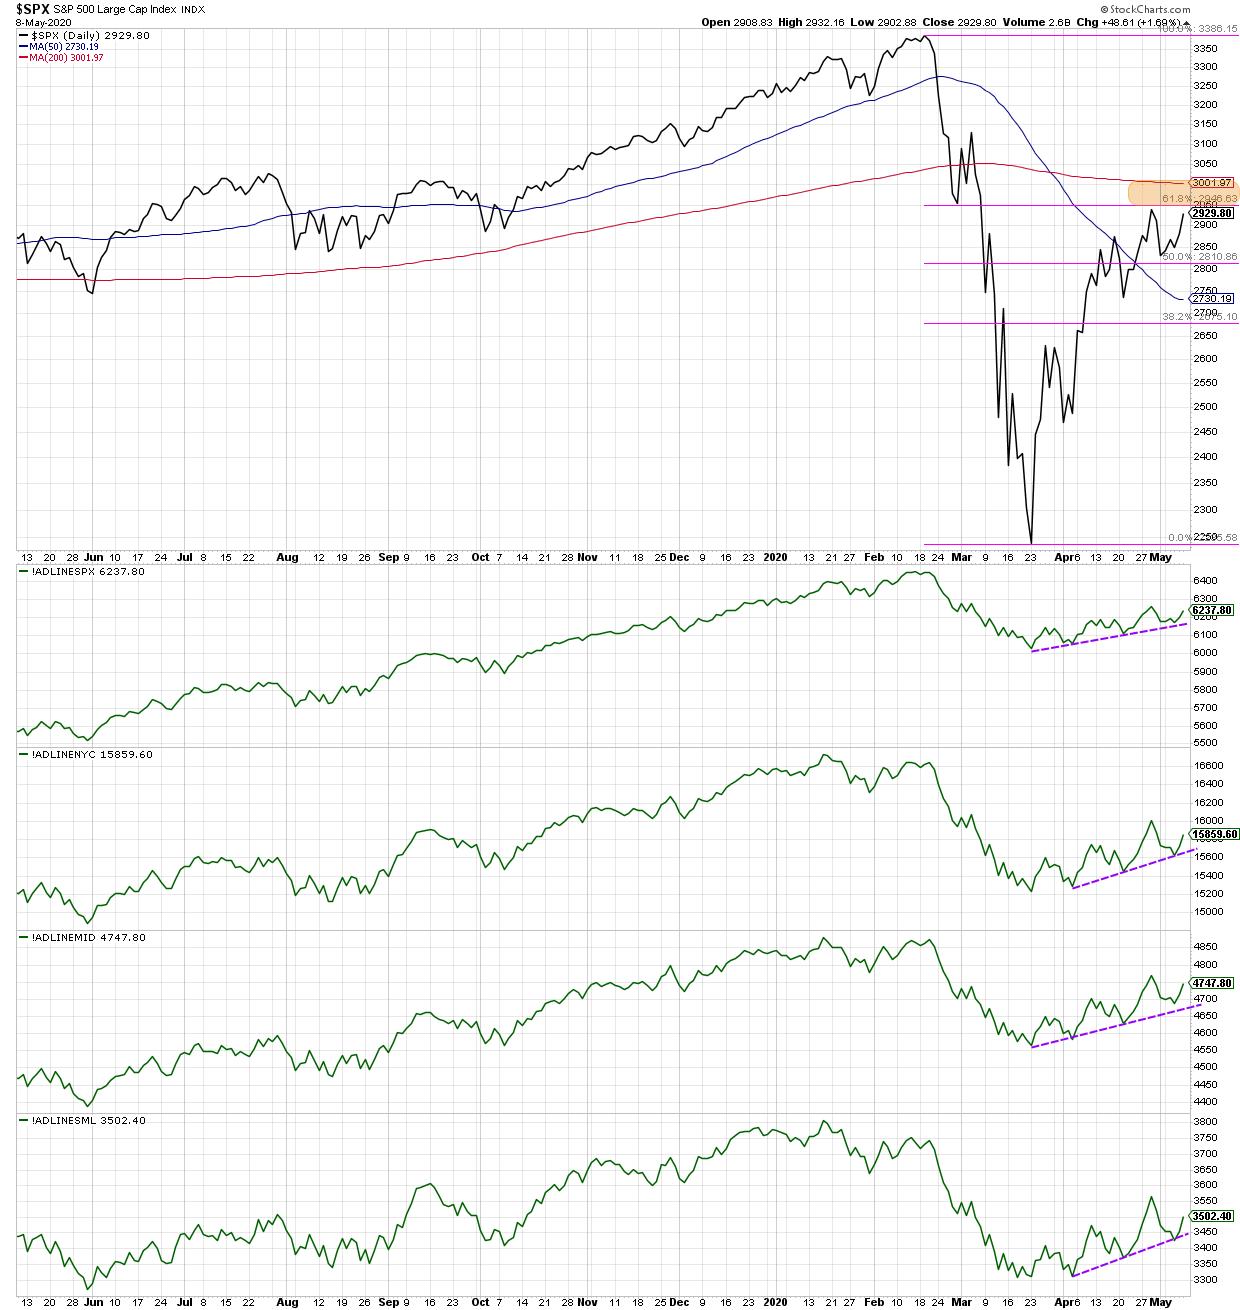
Breadth Improves as Bear Market Rally Exhausts

by David Keller,
President and Chief Strategist, Sierra Alpha Research
Most of my guests in recent weeks on The Final Barhave embraced the "we're due for a pullback" thesis. From the very bullish (S&P 3600) to the quite bearish (S&P 2000) and everyone in between, it seems most people feel that the...
READ MORE
MEMBERS ONLY

One for the Bears and One for the Bulls
by Carl Swenlin,
President and Founder, DecisionPoint.com
FOR THE BEARS . . .
This chart tracks the price of the individual S&P 500 component stocks relative to their 20EMA, 50EMA, and 200EMA. As price approaches the level of a prior top, I look for the indicators to make a lower top, which is a negative divergence. Such divergences...
READ MORE
MEMBERS ONLY

My Daily Five: Changing Tides In The S&P Groups, VTI At Key Price Levels, Breadth Improving and Offense Leading

by Grayson Roze,
Chief Strategist, StockCharts.com
What a way to start the week! Yesterday afternoon, I had the pleasure of hosting "Your Daily Five", our latest series on StockCharts TV where we bring you a concise, action-packed daily rundown of the five most important charts that you need to be watching. Weekdays at...
READ MORE
MEMBERS ONLY

Sector Spotlight: Tops and Flops in Technology
by Julius de Kempenaer,
Senior Technical Analyst, StockCharts.com
On this episode of Sector Spotlight, I highlight the Technology sector and picks some Tops and Flops that are worth keeping an eye on using RRG. In the second part of the show, I answers a question from the Mailbag and suggest a new pair trade idea.
This video was...
READ MORE
MEMBERS ONLY

How Daily and Weekly RRGs Are Aligned
by Julius de Kempenaer,
Senior Technical Analyst, StockCharts.com
This article appeared in the Chartwatchers newsletter last weekend (5/9) but as it touches on one of the core interpretation basics for Relative Rotation Graphs I wanted to have it in the RRG-blog as well. So in case you missed this weekend's newsletter, here is your...
READ MORE
MEMBERS ONLY

Seeing A Short Squeeze Unfold Presents Huge Opportunities; Add This One To Your Watch List
by Tom Bowley,
Chief Market Strategist, EarningsBeats.com
One thing that this pandemic has caused - and few would disagree - is an inordinate amount of fear. An easy way to depict this is simply to look at the Volatility Index ($VIX) and the equity only put call ratio ($CPCE). When these two spike, it's a definitive sign...
READ MORE
MEMBERS ONLY
A Bullish Long-Term Shift Just Took Place in This Important Area of the Markets
by Mary Ellen McGonagle,
President, MEM Investment Research
A major group in the markets turned long-term bullish today, and I've been on the lookout for it for quite some time. The reason for my keen interest is that the stocks in this group currently began exhibiting characteristics that were very common to a period just...
READ MORE
MEMBERS ONLY
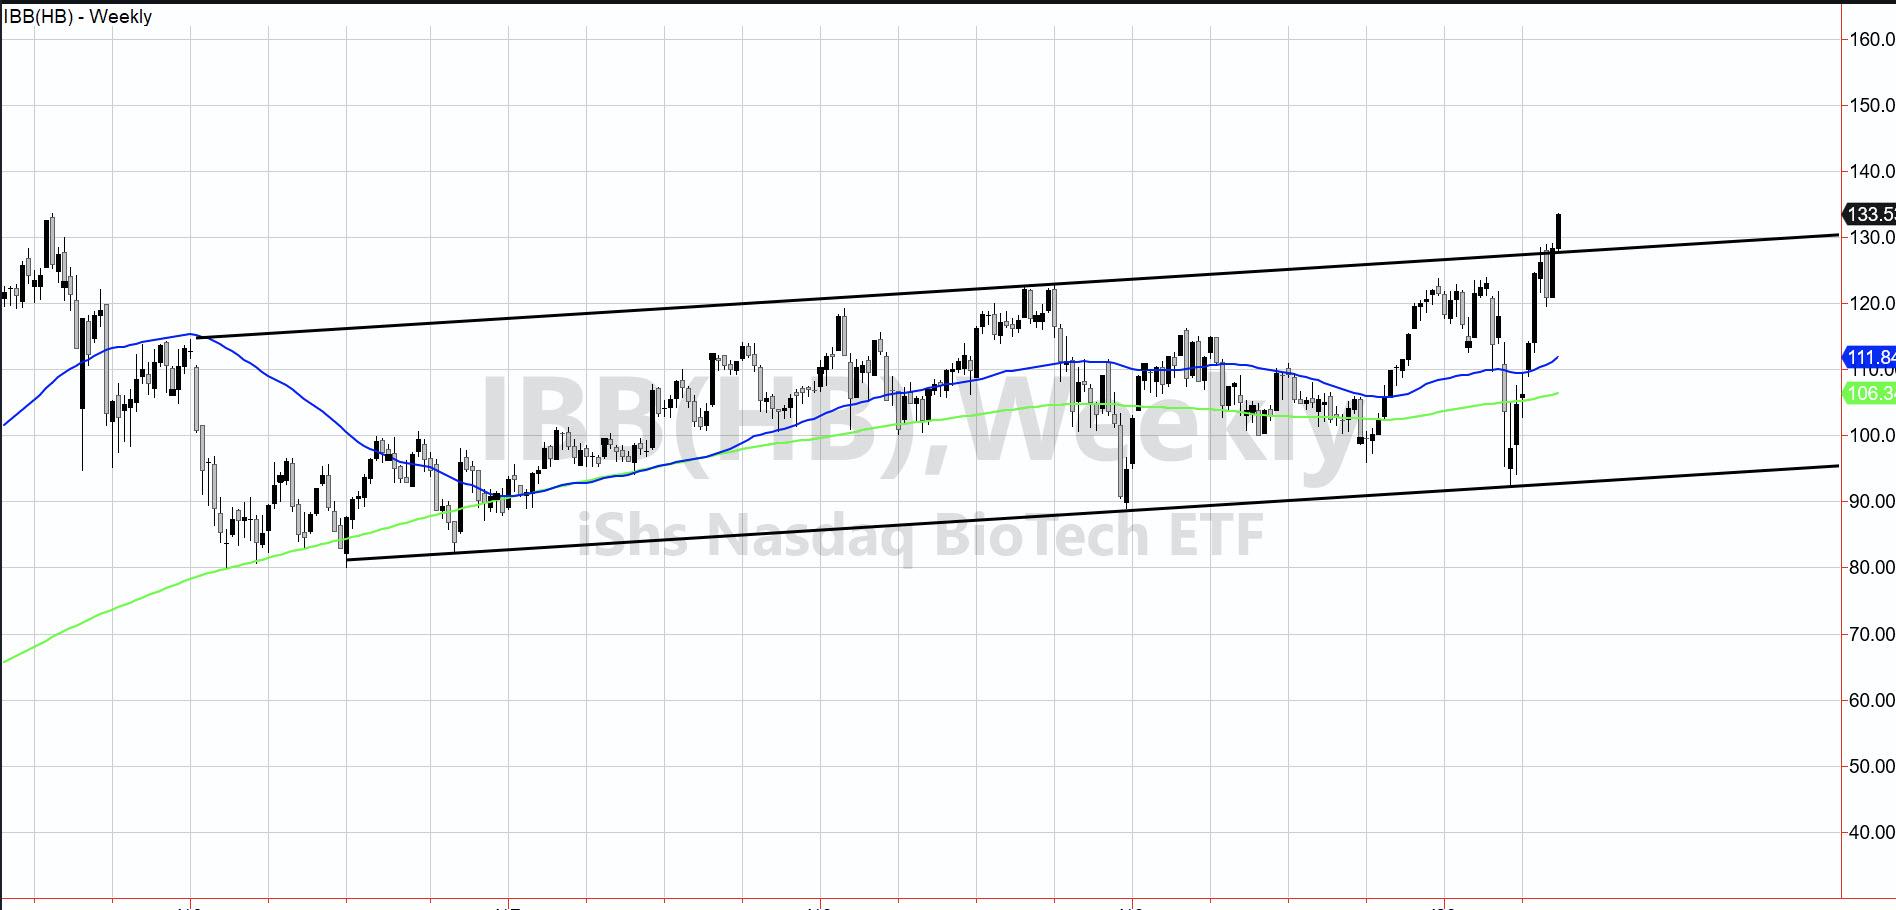
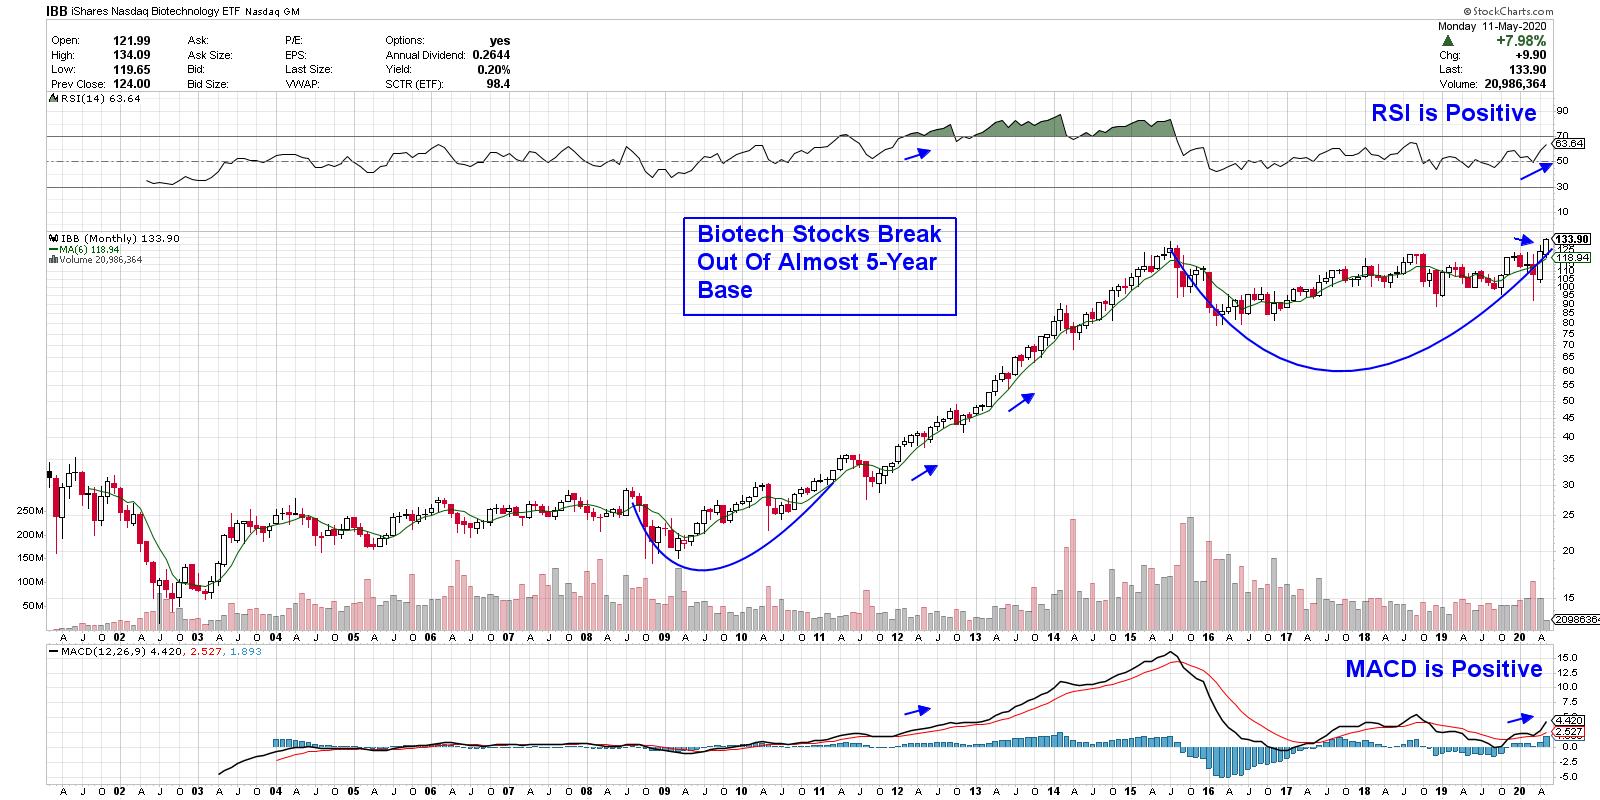
Biotechnology Sector Rocks to All-Time Highs
A week ago, I wrote a blog article titled "The Beauty of the Biotechnology ETF Channel."I began by writing, "If there is one area to watch should the market have another run up, it is Biotechnology (IBB).
"The channel lines that are perfectly parallel, going...
READ MORE
MEMBERS ONLY

NASDAQ TURNS POSITIVE FOR YEAR -- S&P 500 MAY RETEST APRIL HIGH -- USING SCTR LINES TO RANK SECTORS
by John Murphy,
Chief Technical Analyst, StockCharts.com
STOCKS RALLY ON BAD ECONOMIC NEWS... Last weekend's message suggested that the spring rally in stocks may have peaked. Judging from this week's strong price action, that doesn't appear to be the case. Stock prices have shown remarkable resilience in the face of very...
READ MORE
MEMBERS ONLY

Limit Your Trading Universe To This Group Of Stocks
by Tom Bowley,
Chief Market Strategist, EarningsBeats.com
I've run into multiple friends of late, socially-distanced of course, who keep asking me, "Aren't the airlines a great value now?" Ugh. Really? What business can you think of that (a) has lost 95% of its customers AND (b) has little hope of...
READ MORE
MEMBERS ONLY

Week Ahead: NIFTY Marks Important Technical Event; RRG Chart Shows Key Sectors Continuing to Lag
by Milan Vaishnav,
Founder and Technical Analyst, EquityResearch.asia and ChartWizard.ae
The markets fared much along the expected lines over the past five sessions. In the previous weekly note, we had mentioned that if the NIFTY failed to move past the previous week's high, it might end up forming a lower top for itself. Things turned out on the...
READ MORE
MEMBERS ONLY

Strong April Seasonality Gives Way to May and June
by Arthur Hill,
Chief Technical Strategist, TrendInvestorPro.com
When it comes to analysis and trading signals, seasonality is behind price action in the pecking order of importance. In general, seasonal patterns carry most weight when they jibe with the underlying trend. For example, bullish seasonal patterns in an uptrend can provide a tailwind. Nevertheless, price action is still...
READ MORE
MEMBERS ONLY
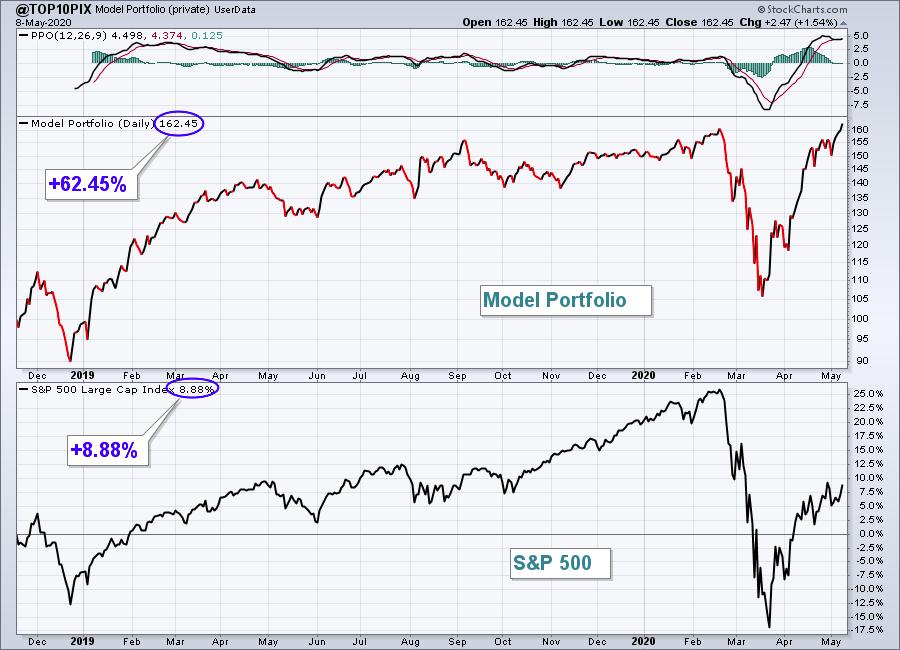
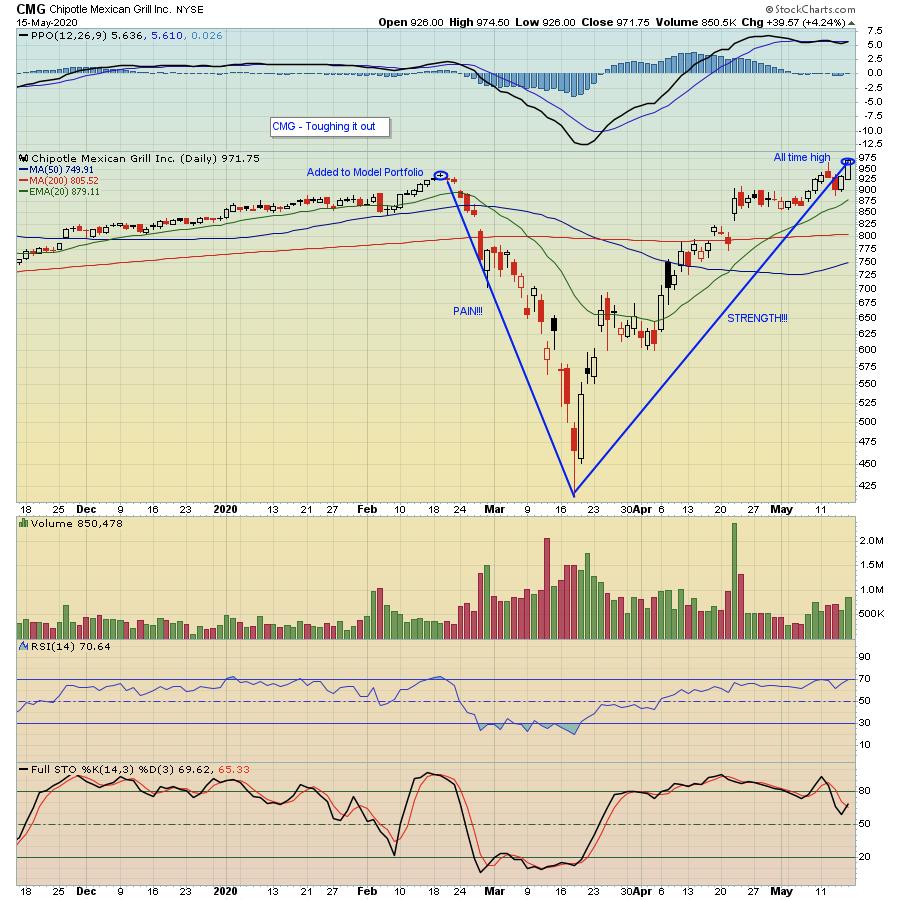
My Model Portfolio Hit an All-Time High Friday - Here are its 10 Component Stocks
by Tom Bowley,
Chief Market Strategist, EarningsBeats.com
The S&P 500 closed at an all-time high on February 19, 2020 when it reached 3386.15. At its Friday close of 2929.80, the benchmark index remained 456.35 points, or 13.48%, shy of that high. February 19th was also the date that I announced...
READ MORE
MEMBERS ONLY
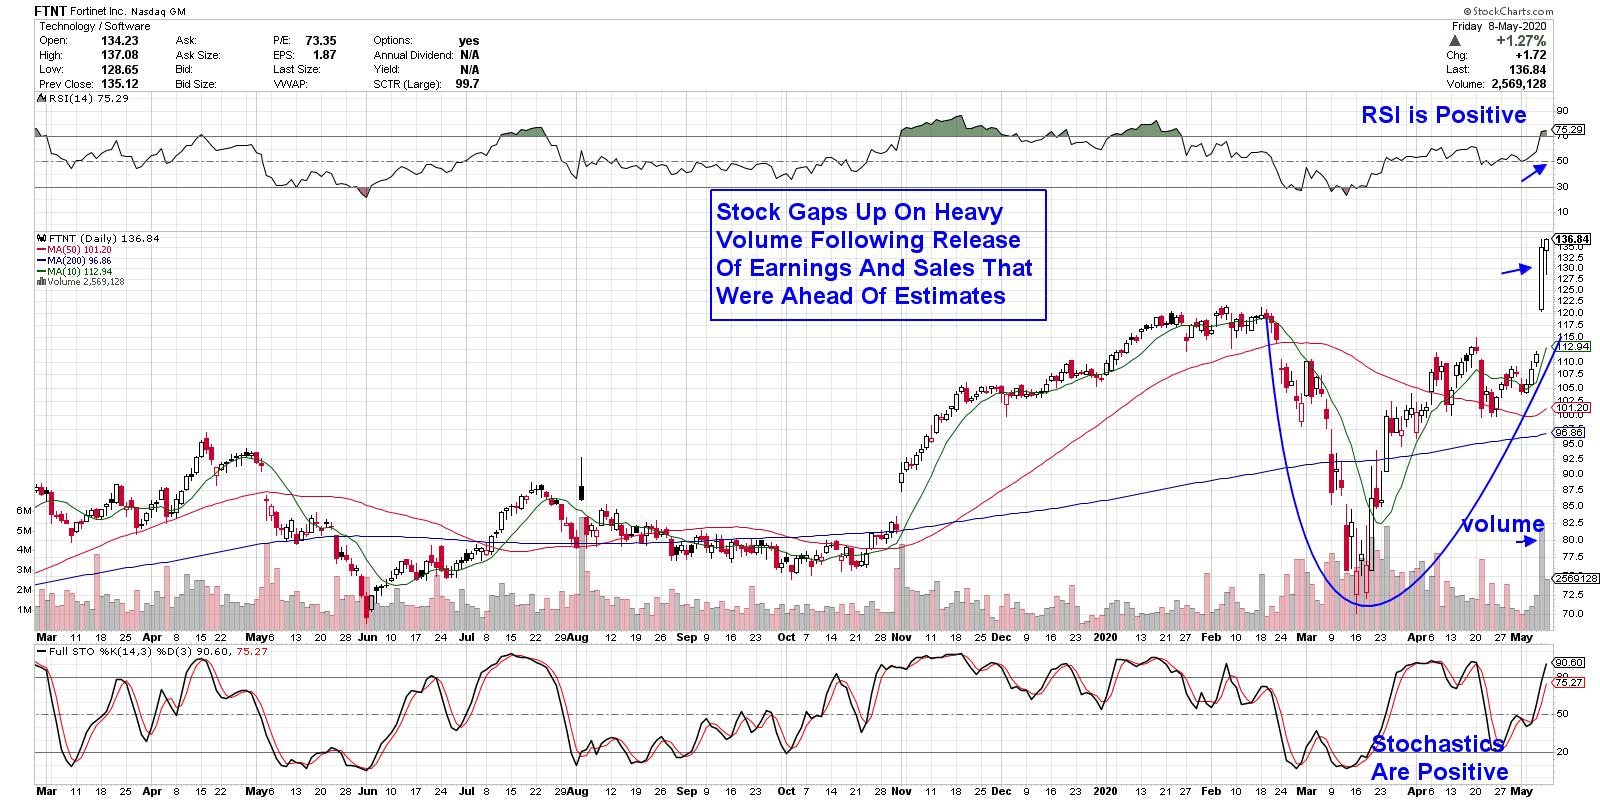
Three Traits that Will Tell You Your Stock is Poised To Trade Much Higher
by Mary Ellen McGonagle,
President, MEM Investment Research
It's been quite a week for the markets, as a gradual reopening from a global lockdown has investors hopeful that economic damage from the pandemic might be stemmed.
And while the S&P 500 posted a healthy gain for the week, it's the Tech-heavy...
READ MORE
MEMBERS ONLY
Breadth Improves as Uptrend Persists
by David Keller,
President and Chief Strategist, Sierra Alpha Research
Most of my guests in recent weeks on The Final Barhave embraced the "we're due for a pullback" thesis. From the very bullish (S&P 3600) to the quite bearish (S&P 2000) and everyone in between, it seems most people feel that the...
READ MORE
MEMBERS ONLY

How to Take Advantage of Global Paradigm Shifts
by Mary Ellen McGonagle,
President, MEM Investment Research
In this episode of StockCharts TV'sThe MEM Edge, Mary Ellen reviews outperforming growth areas of the market. She also shares ways to easily spot money flows into newer areas and the characteristics that point to further upside.
This video was originally recorded on May 7th, 2020. Click on...
READ MORE
MEMBERS ONLY
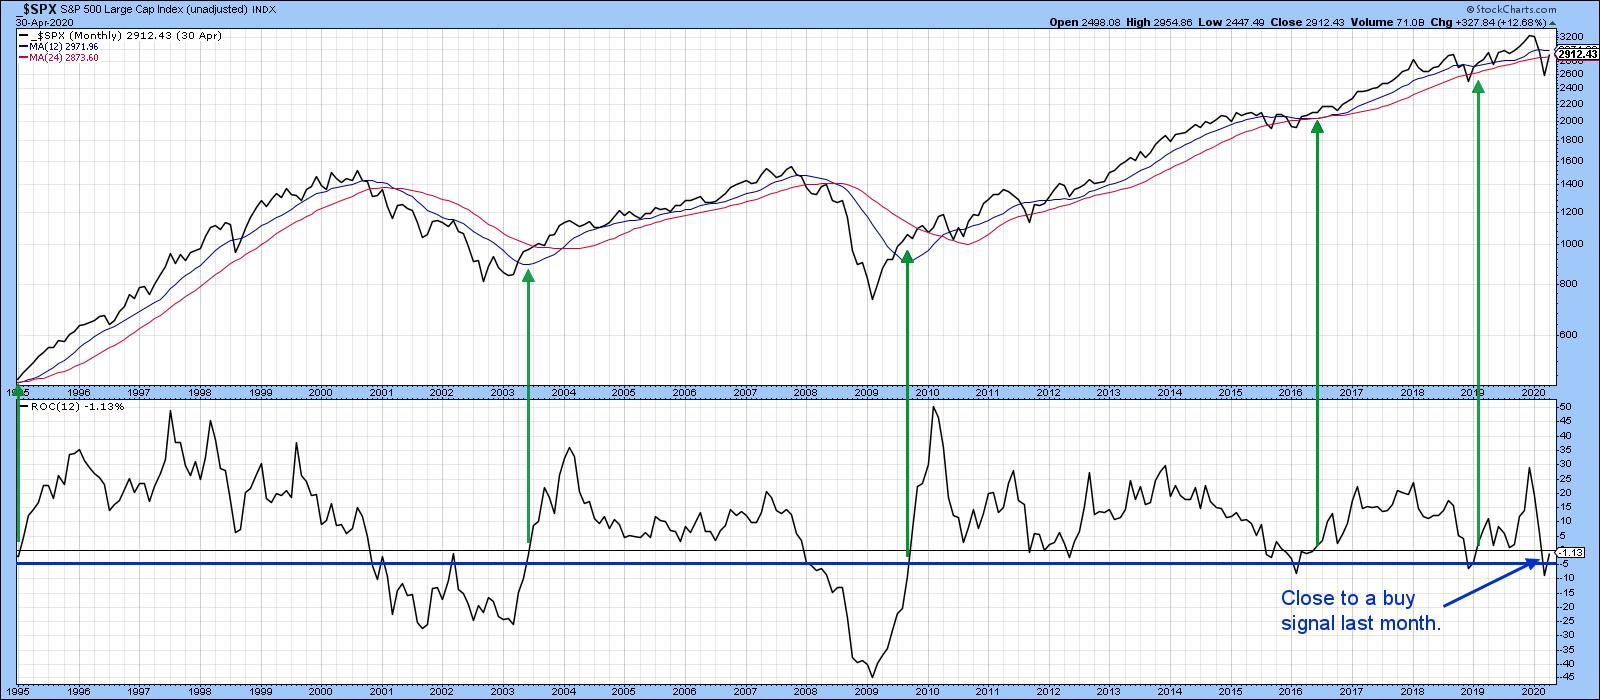
This Reliable Long-Term Indicator Could Go Bullish at the End of the Month
by Martin Pring,
President, Pring Research
Sixty-Five Year Record of Success
One of my favorite long-term indicators involves the 12-month ROC of the S&P Composite falling below the -5% level and subsequently rallying back above zero. This approach is shown in Chart 1, which illustrates the period from 1995 through April...
READ MORE
MEMBERS ONLY

Why the Bullish Dollar Theory is Wrong (+ Video)
Maybe I just love a contrarian view.
My Dollar theory differs from so many analysts. First, I know that the traditional relationship between the Dollar, commodities and the stock market holds for a while, then completely shifts according to each economic cycle. I have experienced it during my trading career...
READ MORE
MEMBERS ONLY
The Alignment of Daily and Weekly Relative Rotation Graphs
by Julius de Kempenaer,
Senior Technical Analyst, StockCharts.com
Sometimes it is unclear how daily and weekly RRGs align with each other.
Just to be clear, this is not the same as the difference between daily and weekly RRGs. With regard to that difference, there is a ChartSchool article that explains it in detail.
What we are talking about...
READ MORE
MEMBERS ONLY

CONSUMER DISCRETIONARY SPDR MAY BE NEXT TO CHALLENGE 200-DAY LINE -- EBAY IS ONE OF ITS BEST PERFORMERS -- SO ARE CHIPOTLE, TRACTOR SUPPLY, AND ROLLINS -- AND HOME IMPROVEMENT STOCKS
by John Murphy,
Chief Technical Analyst, StockCharts.com
CONSUMER DISCRETIONARY SPDR NEARS 200-DAY LINE... Yesterday's message showed the Communication Services SPDR (XLC) trying to clear its 200-day moving average which it has done. The next in line may be consumer cyclicals. Chart 1 shows the Consumer Discretionary SPDR (XLY) nearing a test of its...
READ MORE
MEMBERS ONLY

This Reliable Long-Term Indicator Could Go Bullish at the End of the Month
by Martin Pring,
President, Pring Research
Sixty-Five Year Record of Success
One of my favorite long-term indicators involves the 12-month ROC of the S&P Composite falling below the -5% level and subsequently rallying back above zero. This approach is shown in Chart 1, which illustrates the period from 1995 through April...
READ MORE
MEMBERS ONLY

COMMUNICATION SPDR STILL TESTING 200-DAY LINE -- INTERNET STOCKS ARE LEADING IT HIGHER -- USING SCTR RANKINGS TO FIND STOCK LEADERS
by John Murphy,
Chief Technical Analyst, StockCharts.com
XLC CONTINUES TO TEST 200-DAY LINE... Tuesday's message showed the Communication Services SPDR (XLC) challenging its 200-day moving average. Chart 1 shows that test still in progress. Its relative strength line in the lower box has also been rising. Internet stocks are the main driver behind...
READ MORE
MEMBERS ONLY

PFE For The Win?
by Julius de Kempenaer,
Senior Technical Analyst, StockCharts.com
The above chart shows the daily and weekly tails for PFE overlaid on the same Relative Rotation Graph.
And before you ask... NO, you cannot do this on the site. I did need to be a little bit creative with cutting-copying-pasting-etc. But I thought it was worth...
READ MORE
MEMBERS ONLY

DP Show: 20% of SPX Stocks May Be Cut Next Year
by Erin Swenlin,
Vice President, DecisionPoint.com
by Carl Swenlin,
President and Founder, DecisionPoint.com
In this episode of DecisionPoint, Carl and Erin's topic of the day was bankruptcy and the S&P 500. They discuss the difference between Chapter 11 and Chapter 7 bankruptcies and how that could affect the make up of the S&P 500. They discussed the...
READ MORE