MEMBERS ONLY

DecisionPoint Daily Diamonds - Industrials and Healthcare

by Erin Swenlin,
Vice President, DecisionPoint.com
Today I used my general Price Momentum Oscillator (PMO) scan to find my "diamonds in the rough." As it turned out, there were only ten results, which tells me that it may not be the best time to take on new longs. However, these stocks are showing some...
READ MORE
MEMBERS ONLY

TRANSPORTATION STOCKS MOVE INTO HIGHER GEAR -- DOW TRANSPORTS NEAR TEST OF MAJOR RESISTANCE LINE -- CH ROBINSON AND JB HUNT ARE TRUCK LEADERS -- KIRBY CORP IS MARINE TRANSPORTATION LEADER -- UTILITIES AND REITS LOSE GROUND ON RISING BOND YIELDS

by John Murphy,
Chief Technical Analyst, StockCharts.com
DOW TRANSPORTS NEAR TEST OF OVERHEAD RESISTANCE...After lagging behind the rest of the market for most of the past year, transportation stocks are starting to show new life. Chart 1 shows the Dow Jones Transportation Average surging more than 1% today to the highest level in more than a...
READ MORE
MEMBERS ONLY
Bifurcated Action Draws Sellers In Leading Industries

by Tom Bowley,
Chief Market Strategist, EarningsBeats.com
Market Recap for Monday, September 9, 2019
Monday's action was odd, mixed and bifurcated. The small cap Russell 2000 ($RUT) had a very strong day, rising 1.27%, while the NASDAQ, another aggressive index, fell 0.19%. The Dow Jones finished with a slight gain, but the S&...
READ MORE
MEMBERS ONLY
DecisionPoint Daily Diamonds - "Carl's Scan"
by Erin Swenlin,
Vice President, DecisionPoint.com
Welcome to the "DecisionPoint Daily Diamonds", a newsletter in which we highlight five "diamonds in the rough," taken from the results of one of my DecisionPoint scans. Remember, these are not recommendations to buy or sell, but stocks that I found interesting. The objective is to...
READ MORE
MEMBERS ONLY

ENERGY AND FINANCIALS JUMP ON FLAT MARKET DAY -- RISING OIL PRICE LIFTS OIL SERVICE STOCKS -- HIGHER BOND YIELDS PUSH BANK STOCKS SHARPLY HIGHER -- STRONGER FINANCIAL STOCKS HELP BOOST SMALL CAPS -- RUSSELL 2000 INDEX CLOSES ABOVE ITS 200-DAY LINE
by John Murphy,
Chief Technical Analyst, StockCharts.com
RISING OIL PRICE BOOSTS ENERGY STOCKS...A jump in crude oil helped make energy the strongest sector on a generally flat market day. Chart 1 shows the Energy SPDR (XLE) climbing 2% to the highest level in a month (on rising volume), and showing upside leadership for the the first...
READ MORE
MEMBERS ONLY

Commodities May Be Down, But Are They Out?

by Martin Pring,
President, Pring Research
* Long-Term Commodity Technicals are Finely Balanced
* Gold Leads Commodities
* Commodities Rise and Fall with Confidence
* Short-Term Technicals are Encouraging
* Platinum Breaking Out
Commodities have been losing ground recently, but the latest data suggest that they may be in the process of turning around. If so, that could be important for...
READ MORE
MEMBERS ONLY
Using Scan and RRG for Bottom Fishing

by Julius de Kempenaer,
Senior Technical Analyst, StockCharts.com
One of the most frequently asked questions I receive, with regard to Relative Rotation Graphs on StockCharts.com, is if and how the scan engine can be used to scan for certain events on an RRG.
Well, the answer is you can NOT - not yet, anyway. It's...
READ MORE
MEMBERS ONLY
My Monday Trade Setup Features A Leader In Software
by Tom Bowley,
Chief Market Strategist, EarningsBeats.com
Special Event Today!
This is probably the most excited that I've been for an event ever. I honestly believe that the lineup of products and services that we've put together at EarningsBeats.com will benefit thousands of followers/subscribers across the globe. After spending 20 years...
READ MORE
MEMBERS ONLY
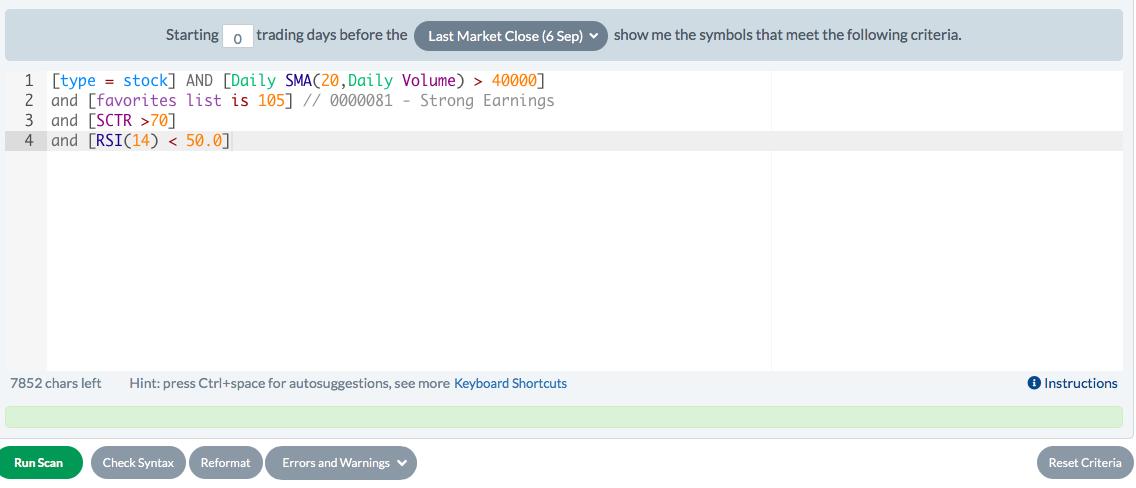
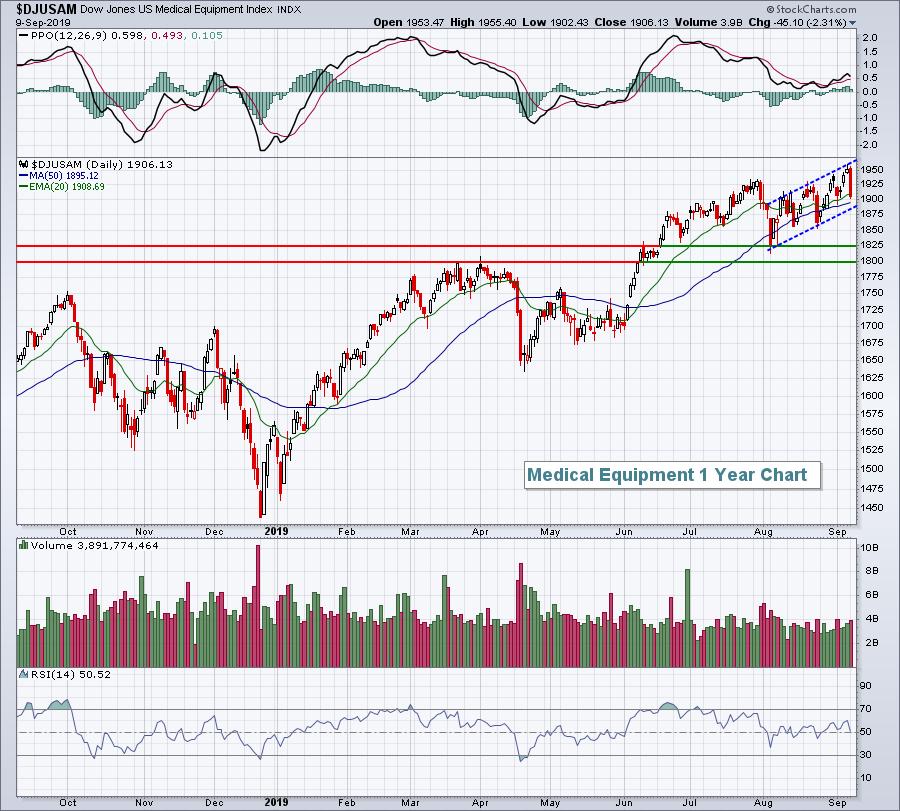
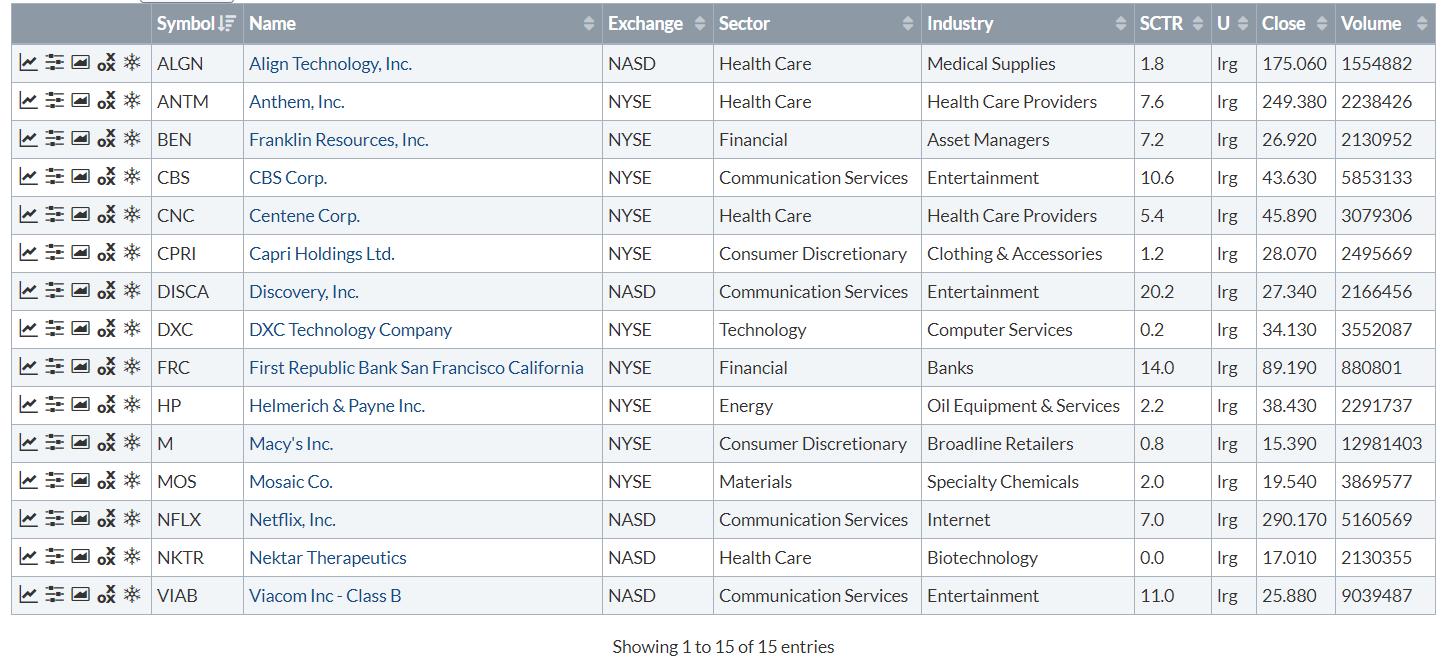
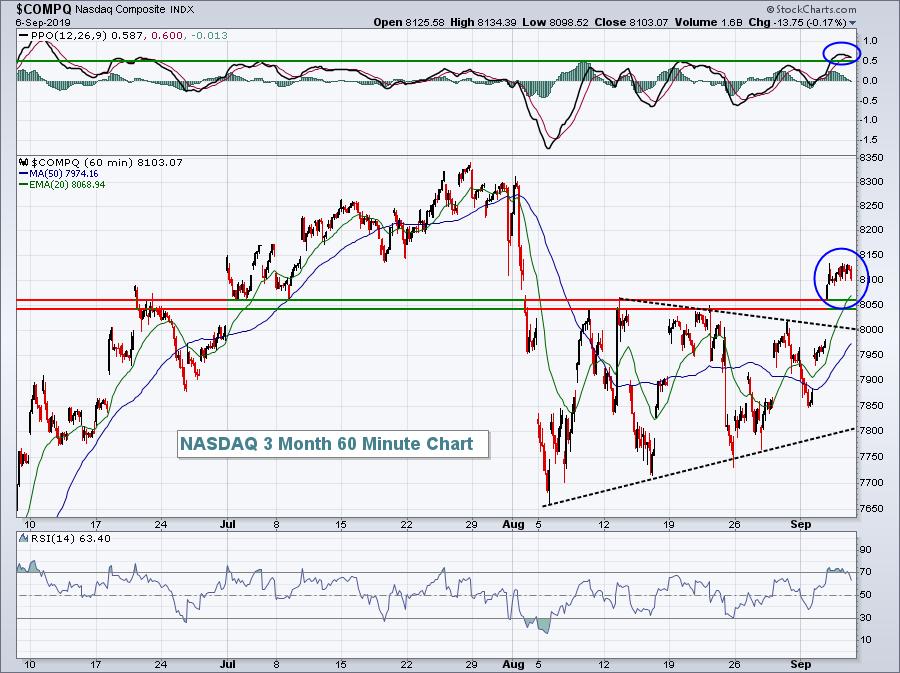
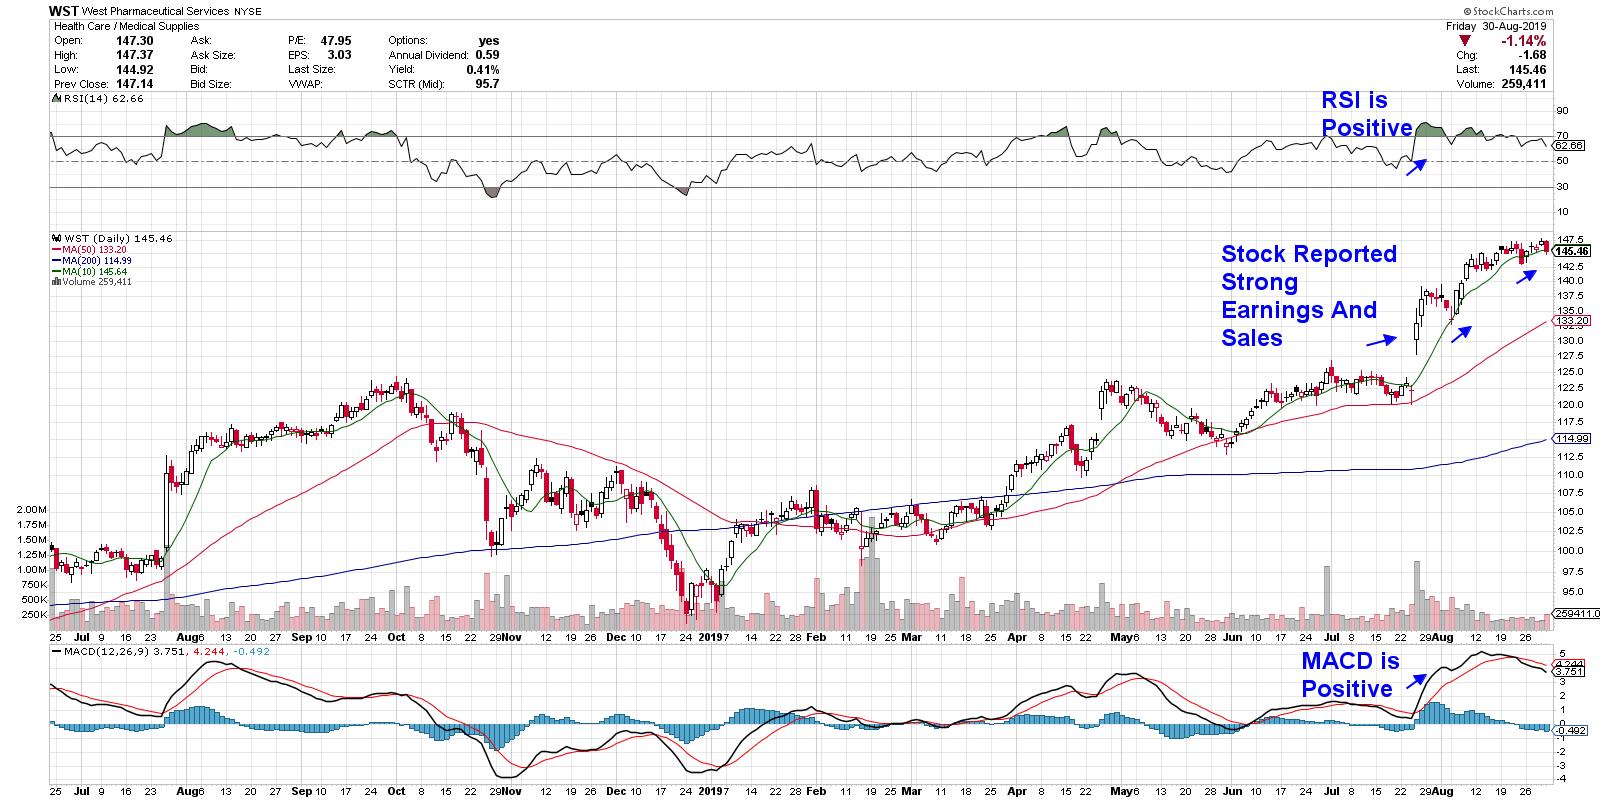
Scanning For Stocks With Strong Technicals AND Strong Fundamentals
by Tom Bowley,
Chief Market Strategist, EarningsBeats.com
I maintain a "Strong Earnings ChartList", where I organize those companies who (1) beat Wall Street consensus estimates as to both revenues and earnings per share (EPS), (2) have adequate liquidity (generally trade more than 200,000 shares daily), and (3) have shown solid technical price action. The...
READ MORE
MEMBERS ONLY
Earnings Season Never Ends; These 2 Companies Prove It
by Tom Bowley,
Chief Market Strategist, EarningsBeats.com
The beauty of being both a fundamentalist and a technician is that the fun never stops. Many of you may view earnings season to last from the middle of the first month of each calendar quarter (when Dow Jones component stocks and the biggest money center banks begin reporting) to...
READ MORE
MEMBERS ONLY
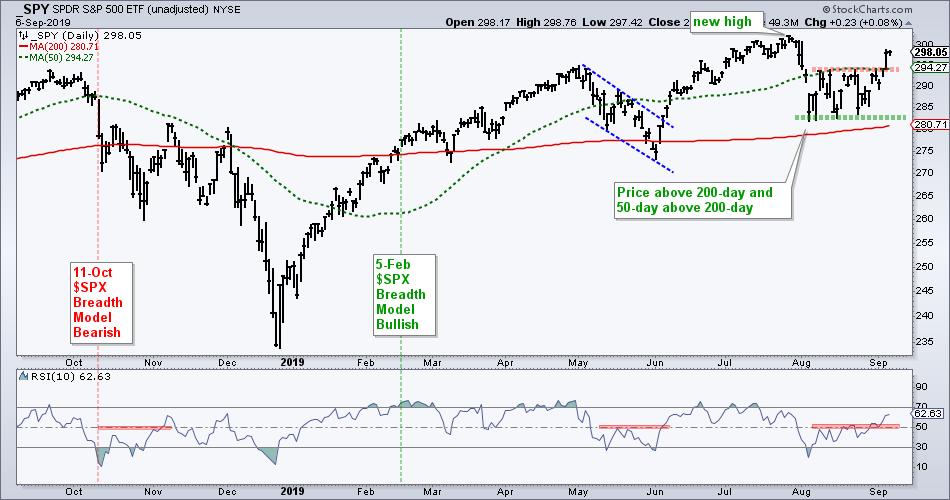
Big Changes in the Index and Sector Breath Models

by Arthur Hill,
Chief Technical Strategist, TrendInvestorPro.com
It was a big week for stocks and the breadth indicators backed up the bullish price action. The S&P 500 SPDR (SPY) broke out of its August range to signal a continuation of the bigger uptrend. Even though the Index Breadth Model turned bearish in mid August, the...
READ MORE
MEMBERS ONLY
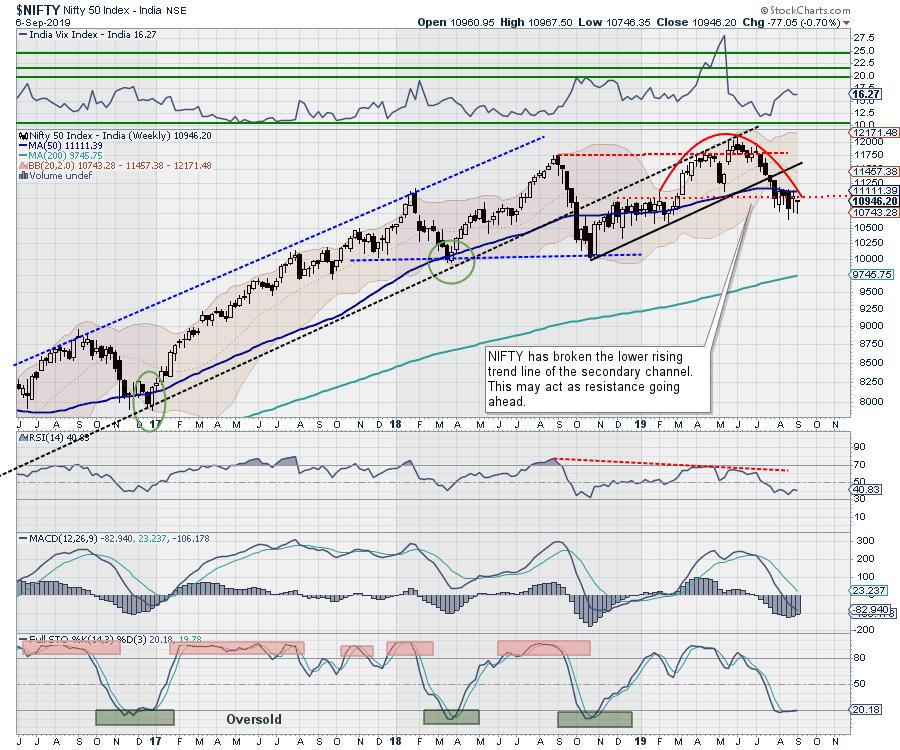
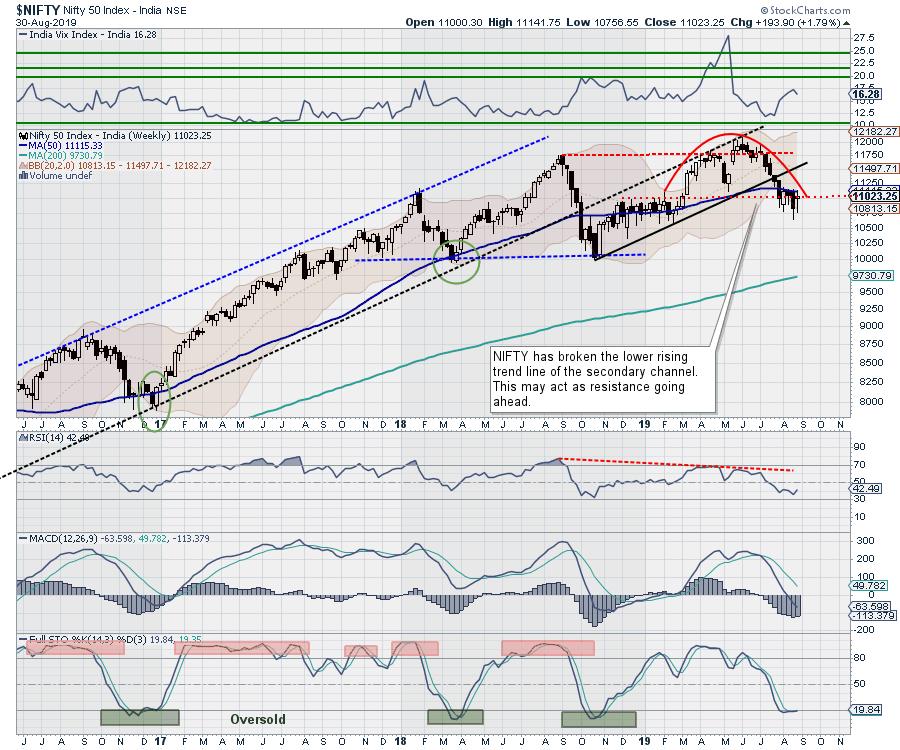
Truncated Week Ahead: NIFTY Likely To Remain In A Broad Range; Watching These Levels Continues To Remain Important

by Milan Vaishnav,
Founder and Technical Analyst, EquityResearch.asia and ChartWizard.ae
In the week that went by, the Indian equity markets did not make any directional move on any side. The index oscillated back and forth in a defined range and ultimately ended the week on a flat note. The India Volatility Index (INDIAVIX) also remained flat, losing just 0.01...
READ MORE
MEMBERS ONLY

DecisionPoint Scan Gems
by Erin Swenlin,
Vice President, DecisionPoint.com
Very soon, I will be launching a daily newsletter for DecisionPoint that will give you some stocks that have presented themselves in one of my many DecisionPoint scans. I do the analysis so you don't have to. I don't make trading recommendations, and certainly no promises...
READ MORE
MEMBERS ONLY

Examples of Exit Disciplines Are All Around Us: Pay Attention!

by Gatis Roze,
Author, "Tensile Trading"
You board any airplane today and before it takes off, the flight attendants review all the exits with you. Cruise ships do life boat drills before departure. Exits on trains and buses are also clearly marked and labeled for emergencies. Clearly, the point is that you need to know how...
READ MORE
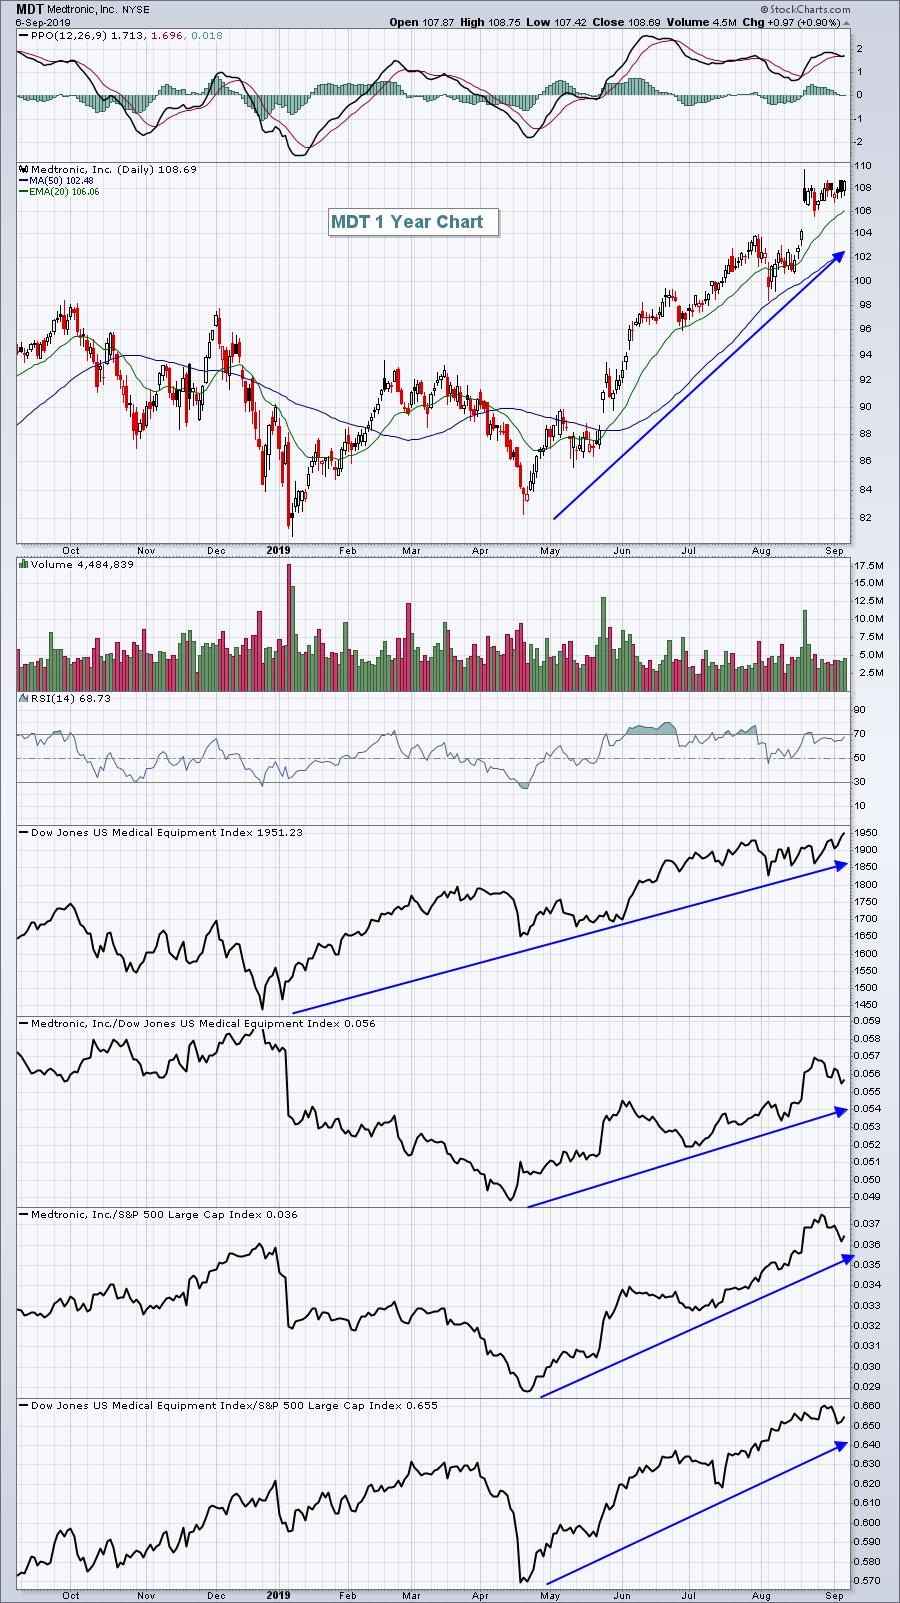
MEMBERS ONLY
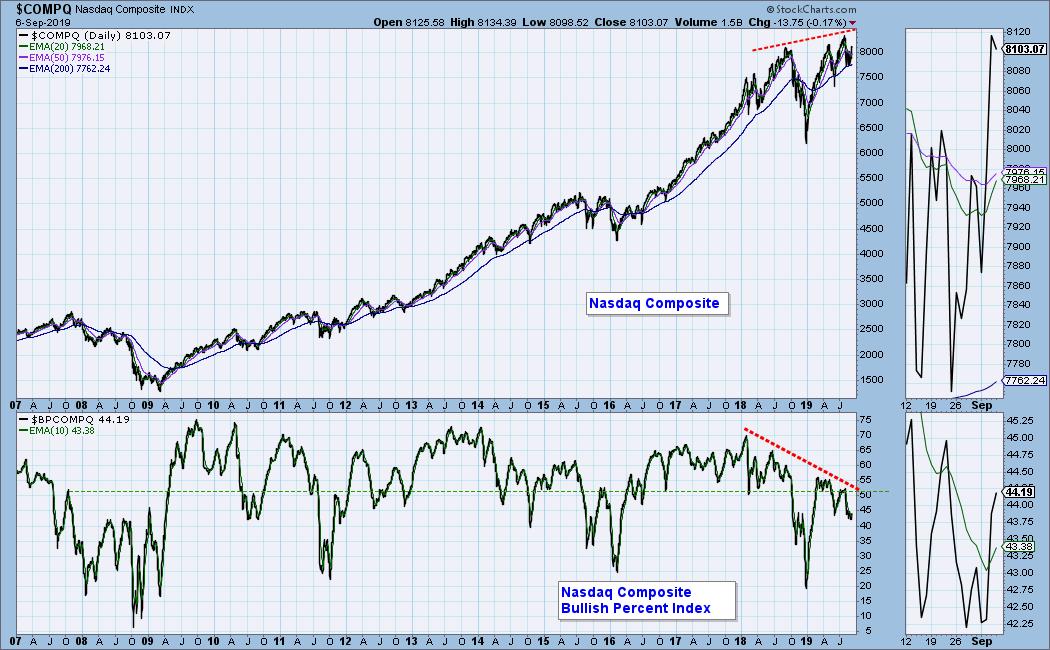
DP WEEKLY WRAP: Internal Support Substantially Erroded

by Carl Swenlin,
President and Founder, DecisionPoint.com
The Nasdaq Composite Index is about 2.5% below its all-time high of earlier this year, but its Bullish Percent Index (BPI), which is the percentage of Nasdaq component stocks with point and figure BUY signals, stands at only 44%. This is about -15% below the BPI reading at the...
READ MORE
MEMBERS ONLY
Drum Roll, Please!! A New Era Begins

by John Hopkins,
President and Co-founder, EarningsBeats.com
The excitement is building as Tom Bowley gets ready to rejoin the EarningsBeats.comteam as Chief Market Strategist. Why the excitement? Because Tom's experience as Senior Technical Analyst at StockCharts.com, along with being one of the original founders of and contributors to EarningsBeats.com, gives him a...
READ MORE
MEMBERS ONLY

Four Keys to Finding Meaningful Bullish Reversal Patterns - with Two Live Examples
by Arthur Hill,
Chief Technical Strategist, TrendInvestorPro.com
Major bullish reversal patterns signal the start of new up trends that can extend and be very profitable. However, chartists must first learn to distinguish between meaningful patterns and irrelevant patterns. Here's how...
There are three parts to a major bullish reversal pattern. First, there is the price...
READ MORE
MEMBERS ONLY
Stock Indexes Break Out of August Trading Range to the Upside
by John Murphy,
Chief Technical Analyst, StockCharts.com
Editor's Note: This article was originally published in John Murphy's Market Message on Thursday, September 5th at 10:46am ET.
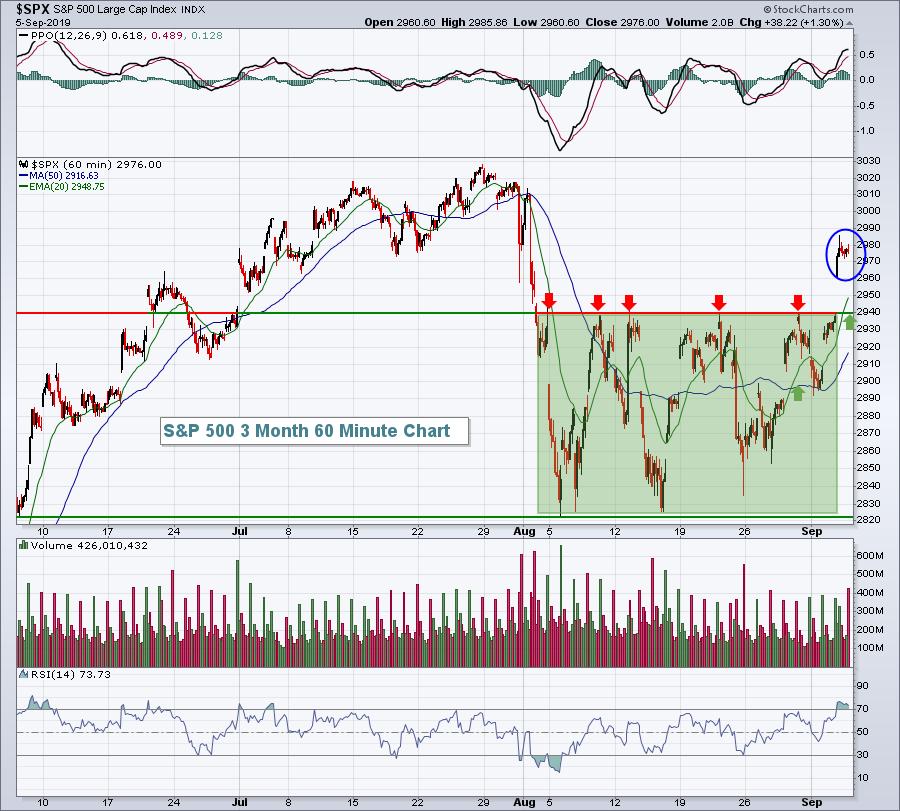
A rally in global stocks has taken a turn for the better with major stock indexes clearing some upside resistance barriers. The three major stock indexes...
READ MORE
MEMBERS ONLY
S&P 500 Breaks Trading Range To Upside And There Was Very Bullish Confirmation
by Tom Bowley,
Chief Market Strategist, EarningsBeats.com
Market Recap for Thursday, September 5, 2019
U.S. indices had a strong day on Thursday, with leadership from key aggressive areas. The small cap Russell 2000 ($RUT) led the action with a solid 1.75% gain. More on the RUT in today's Current Outlook section below. The...
READ MORE
MEMBERS ONLY

STOCK INDEXES BREAK OUT OF AUGUST TRADING RANGE TO THE UPSIDE -- LED BY FINANCIALS, TECH, AND INDUSTRIALS -- RISING BOND YIELDS ARE BOOSTING BANKS AND FINANCIALS WHILE BOND PROXIES WEAKEN -- SEMICONDUCTORS LEAD TECH SECTOR HIGHER
by John Murphy,
Chief Technical Analyst, StockCharts.com
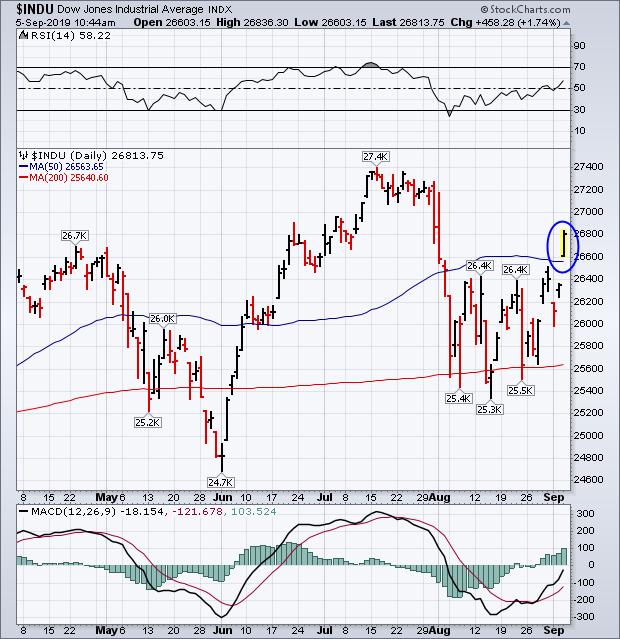
MAJOR STOCK INDEXES ACHIEVE UPSIDE BREAKOUTS...A rally in global stocks has taken a turn for the better with major stock indexes clearing some upside resistance barriers. The three major stock indexes shown below have all cleared their August highs and 50-day moving averages. At the same time, their 14-day...
READ MORE
MEMBERS ONLY
Semis Extend Bounce off Key Retracement - XLI and XLF Surge off Support - Ranking and Grouping Key ETFs
by Arthur Hill,
Chief Technical Strategist, TrendInvestorPro.com
Today we will rank and group the key ETFs that I follow. Instead of showing all five groups, like in last week's commentary, I will focus the middle three groups, which I think are the most interesting and still have potential. I am not even going to cover...
READ MORE
MEMBERS ONLY
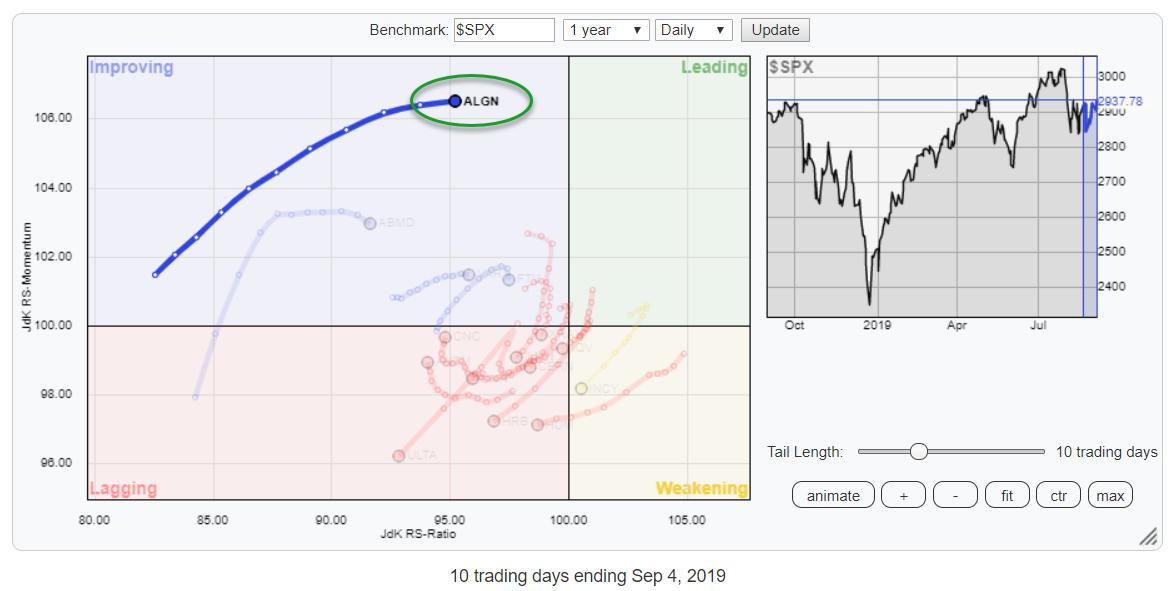
Is This Stock Ready For a Turnaround - or Just a Quick Bounce?
by Julius de Kempenaer,
Senior Technical Analyst, StockCharts.com
The Relative Rotation Graph (RRG) above is the result of a scan that I am running from time to time. Before you ask... ;) in an upcoming RRG Charts blog, I will explain how I got to this selection of stocks, including the scan-code.
For now, let's concentrate on...
READ MORE
MEMBERS ONLY
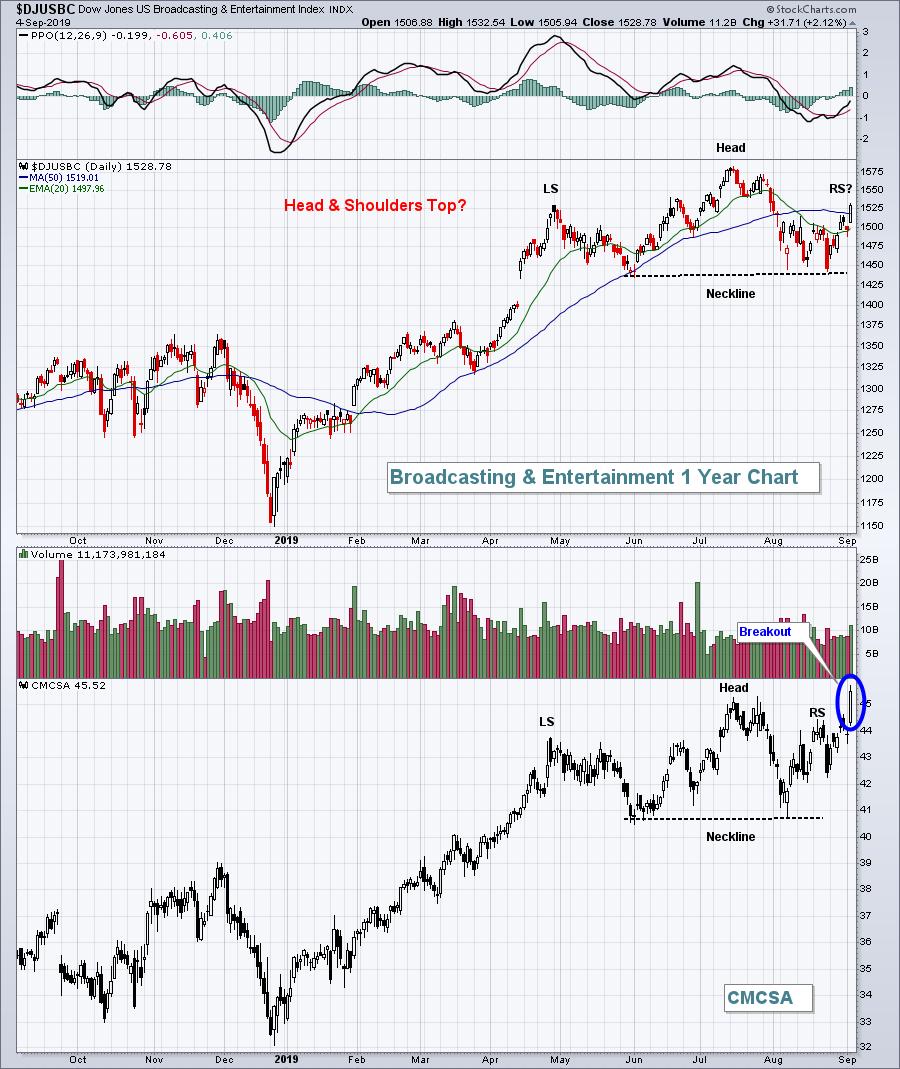
Head & Shoulder Top Is Perhaps The Most Over-Hyped Technical Pattern
by Tom Bowley,
Chief Market Strategist, EarningsBeats.com
Market Recap for Wednesday, September 4, 2019
It was a solid day for U.S. equities as all of our major indices rallied, as did all 11 sectors. Communication services (XLC, +1.94%) and technology (XLK, +1.71%) were the top two performing sectors. Broadcasting & entertainment ($DJUSBC, +2.12%...
READ MORE
MEMBERS ONLY

S&P 500 Leads Breadth Charge
by Arthur Hill,
Chief Technical Strategist, TrendInvestorPro.com
The S&P 500 and SPY are challenging their August highs again and large-cap breadth is stronger than breadth in mid-caps and small-caps. Since we seem to be on a day-to-day situation with the S&P 500 and this trading range, I will provide another short-term breadth update....
READ MORE
MEMBERS ONLY

DP Alert Mid-Week: Reverse Head Shoulders/Triple Bottom on Indexes - PMO BUY for NDX
by Erin Swenlin,
Vice President, DecisionPoint.com
The NDX scored a PMO BUY signal, lagging slightly behind the other three Scoreboard indexes. Below the Scoreboards, I have included not only the NDX but also the other three Scoreboard indexes (SPX, OEX and INDU), as "solid line" charts rather than OHLC bars. I was curious to...
READ MORE
MEMBERS ONLY

A Classic Reversal Pattern with a Live Example - Plus 3 Stock Setups
by Arthur Hill,
Chief Technical Strategist, TrendInvestorPro.com
Even though trend continuations are more likely than trend reversals, reversals do occur and chartists looking for price reversals should understand the classic patterns. While perusing through the charts today, I found a stock with a classic reversal pattern and a breakout in the works. Even though reversal patterns are...
READ MORE
MEMBERS ONLY
Defensive Sectors Hold U.S. Equities Up
by Tom Bowley,
Chief Market Strategist, EarningsBeats.com
Market Recap for Tuesday, September 3, 2019
This is just a very brief market recap as I'm on jury duty this week.
New U.S. tariffs took effect this morning and it's September, so the stock market saw considerable weakness, especially at the open. Defensive sectors...
READ MORE
MEMBERS ONLY

The Never-Ending Range, Low Vol Leadership and Credit Market Canaries
by Arthur Hill,
Chief Technical Strategist, TrendInvestorPro.com
As noted in Tuesday's commentary, the S&P 500 SPDR (SPY) and several big sector SPDRs remain locked in trading ranges. SPY fell back from range resistance with a modest decline on Tuesday (-.58%). It certainly could have been worst.
As the chart below shows, SPY...
READ MORE
MEMBERS ONLY

Martin Pring's Monthly Market Roundup 2019-09-03
by Martin Pring,
President, Pring Research
The monthly Market Roundup video for September is now available.
Good luck and good charting,
Martin J. Pring
The views expressed in this article are those of the author and do not necessarily reflect the position or opinion of Pring Turner Capital Group of Walnut Creek or its affiliates....
READ MORE
MEMBERS ONLY

Four More Short-Term Indicators Turn Bullish for Equities
by Martin Pring,
President, Pring Research
* Breadth Acting Positively
* Four Short-Term Indicators Turn Bullish
* Stocks Could Be Breaking Against Gold
The mood on Wall Street is turning ever more cautious as the economic numbers continue to soften. We need to remember, though, that the stock market is a forward-looking indicator, as it looks through the foggy...
READ MORE
MEMBERS ONLY

STOCKS START SEPTEMBER ON A WEAK NOTE -- MAJOR STOCK INDEXES BACK OFF FROM OVERHEAD RESISTANCE -- INDUSTRIALS, FINANCIALS, AND TECH ARE WEAKEST SECTORS -- UTILITIES AND REITS HIT NEW HIGHS -- TEN-YEAR BOND YIELD DROPS TO THREE-YEAR LOW
by John Murphy,
Chief Technical Analyst, StockCharts.com
MAJOR STOCK INDEXES BACK OFF FROM OVERHEAD RESISTANCE...Stocks are only halfway through one of the year's weakest seasonal stretches between August and September. And September is usually the weaker of the two. And they're starting the month on a weak note. Another round of tariffs...
READ MORE
MEMBERS ONLY
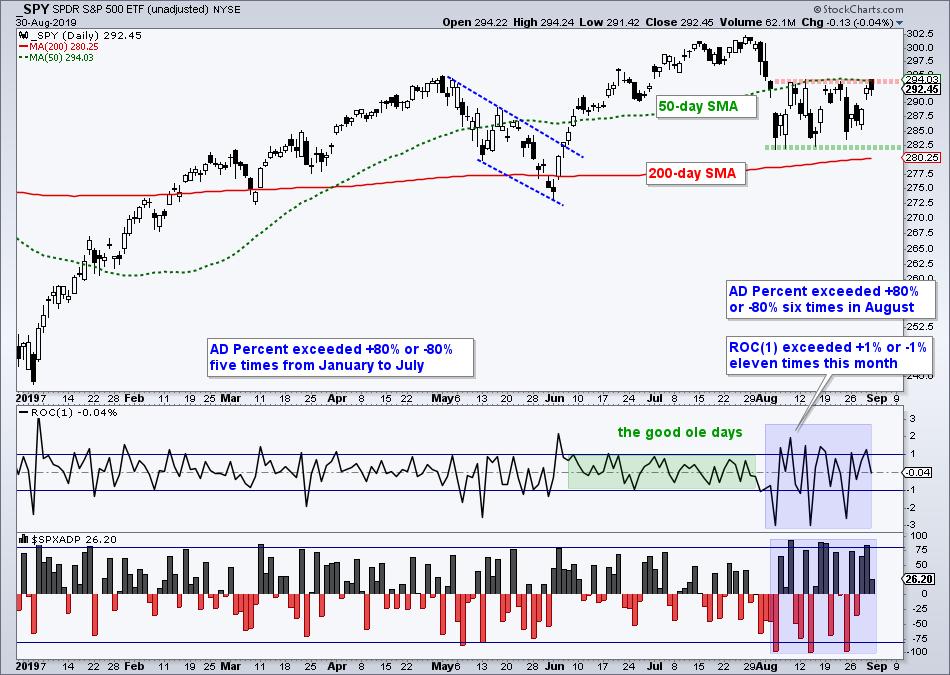
Volatile and Yet Not So Volatile
by Arthur Hill,
Chief Technical Strategist, TrendInvestorPro.com
Stocks opened strong on Friday morning and then sold off ahead of a three day weekend. Well, the weekend has passed and stocks are set to open lower on Tuesday. What a surprise! August was volatile for the S&P 500. And yet it was also not volatile. The...
READ MORE
MEMBERS ONLY
Sneak Preview: Sector and Industry Relative Strength Analysis
by Tom Bowley,
Chief Market Strategist, EarningsBeats.com
Special Note
There will be no Trading Places blog article on Tuesday, September 3rd as I've been selected for jury duty and will be out all day. I'll find out more of my schedule (for later this week) tomorrow morning and I will post articles here...
READ MORE
MEMBERS ONLY
Week Ahead: NIFTY Has A Treacherous Road Ahead; These Sectors To Relatively Out-Perform As Per RRG
by Milan Vaishnav,
Founder and Technical Analyst, EquityResearch.asia and ChartWizard.ae
Throughout the past week, the Indian equity market struggled to keep its head above crucial levels and ended the week with modest gains. Keeping on anticipated lines, the week remained very volatile as the markets oscillated in a 385-point range. The week that went by digested the reforms initiated by...
READ MORE
MEMBERS ONLY

Charting the Fab 5 for Clues on QQQ
by Arthur Hill,
Chief Technical Strategist, TrendInvestorPro.com
Today we will look at charts for the biggest stocks in the Nasdaq 100 ETF. Even though the big tech titans dominate QQQ, note that Pepsi (PEP) is the 10th largest stock and accounts for 2.3%. PEP is obviously part of the Consumer Staples sector.
The top five stocks...
READ MORE
MEMBERS ONLY
The August Stealth Bull That Has Some Investors Cheering

by Mary Ellen McGonagle,
President, MEM Investment Research
For most investors, it's been a tough month as headline induced volatility brought the Indexes to their worse August returns since 2015.
While a sense of doom and gloom has dominated the popular financial news, select investors that have looked beyond the headlines have seen dramatic gains for...
READ MORE
MEMBERS ONLY
The 3 Biggest Risks As We Enter September; The Trade War Isn't One
by Tom Bowley,
Chief Market Strategist, EarningsBeats.com
Listen, the media loves to overhype the trade war. Seriously, is there anyone that isn't aware of the trade war, the tweets, the rhetoric, etc. at this point? Hasn't everyone already priced in an economic disaster because of it? Oh wait! That's right, our...
READ MORE
MEMBERS ONLY
Should Market Breadth Be Cap-Weighted or Equal-Weighted?

by David Keller,
President and Chief Strategist, Sierra Alpha Research
I recently tweeted about the percent of stocks above their 200-day moving averages, pointing out that there is a key line in the sand for this important breadth indicator. This resulted in a fantastic question about looking at market breadth in cap-weighted terms vs. equal-weighted terms.In this article, we&...
READ MORE
MEMBERS ONLY
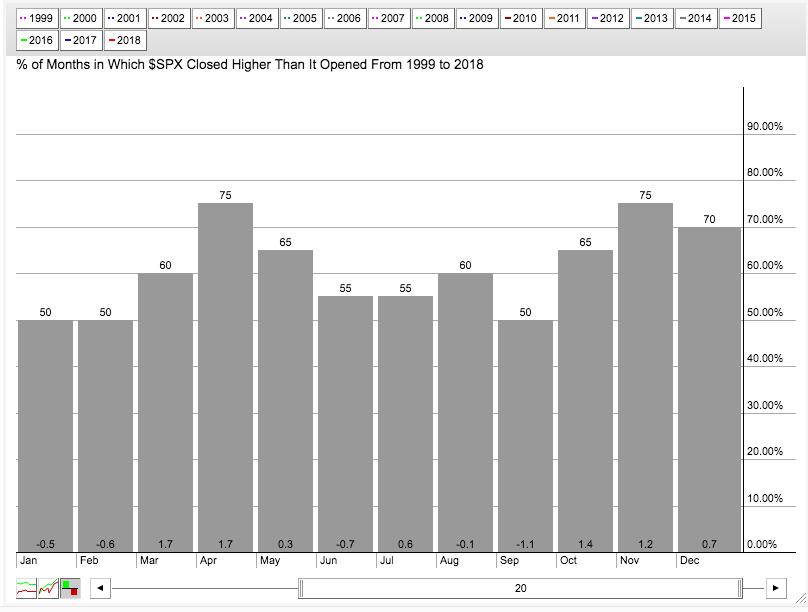
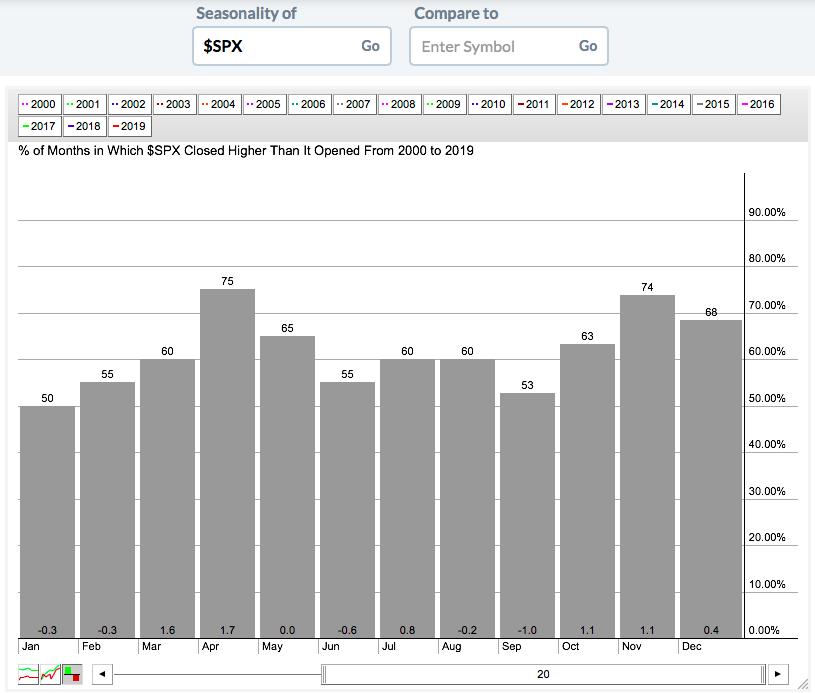
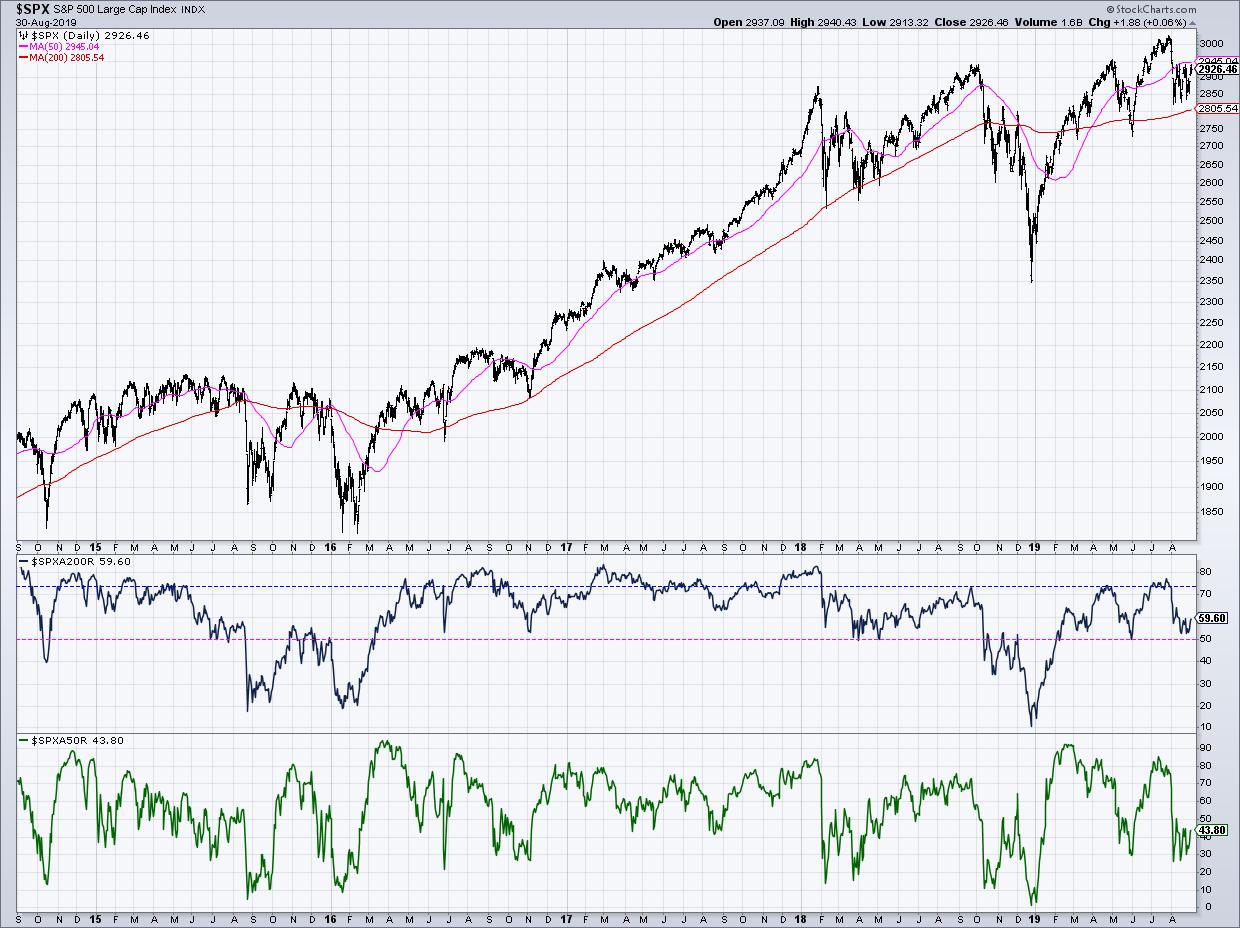
DP WEEKLY WRAP: Seriously Suspecting September Seasonality
by Carl Swenlin,
President and Founder, DecisionPoint.com
The month of September has a reputation for being a bad month for the stock market. After the October 1987 Crash, the month of October carried a bad rep for years, but more recently we are told that it's really September we have to watch out for. On...
READ MORE
MEMBERS ONLY
Most Sectors Still Experiencing Rising Peaks and Troughs
by Martin Pring,
President, Pring Research
Editor's Note: This article was originally published in Martin Pring's Market Roundup on Wednesday, August 27th at 4:15pm ET.
One simple and very much overlooked technique for trend identification is to observe whether the price of a security is experiencing a series of rising peaks...
READ MORE