MEMBERS ONLY
Market Rallies But Yield Spread Continues To Hurt Banks

by Tom Bowley,
Chief Market Strategist, EarningsBeats.com
Market Recap for Monday, March 11, 2019
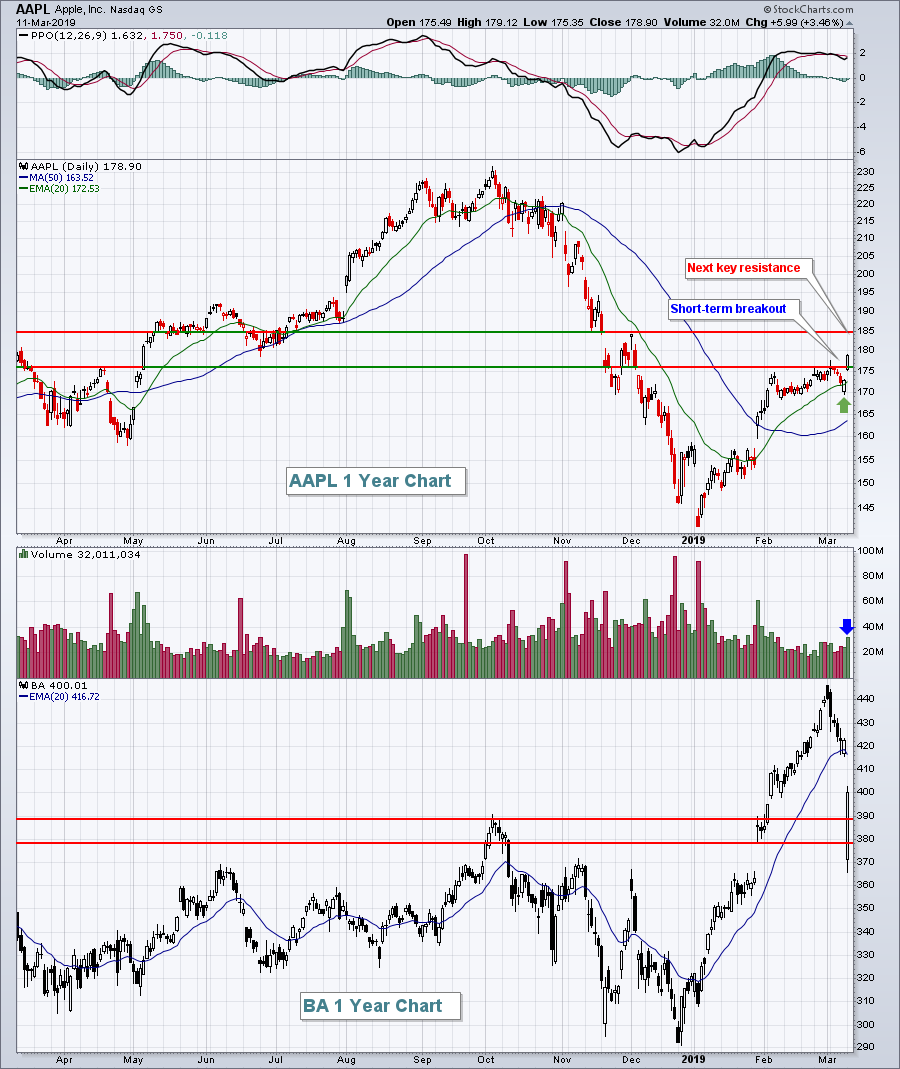
It never hurts to have Apple, Inc. (AAPL, +3.46%) breakout and that's what happened on Monday. It not only lifted the technology sector (XLK, +2.15%), but it provided a spark to our major indices as we experienced a "...
READ MORE
MEMBERS ONLY

Residential Constructive

by Bruce Fraser,
Industry-leading "Wyckoffian"
In August of 2018 we studied the Residential Construction industry group (click here to view). This group was very weak throughout 2018. After a sharp January decline a long period of Redistribution set in. Rising interest rates during the year became a headwind for the group. In September, the redistribution...
READ MORE
MEMBERS ONLY

TECHNOLOGY SECTOR LEADS TODAY'S REBOUND AND HOLDS ITS 200-DAY LINE -- SEMICONDUCTORS ARE HAVING AN EVEN STRONGER DAY -- THE NASDAQ AND S&P 500 REGAIN THEIR 200-DAY LINES -- THE DOW SHRUGS OFF BIG BOEING LOSS

by John Murphy,
Chief Technical Analyst, StockCharts.com
TECHNOLOGY SPDR HOLDS ITS 200-DAY LINE ... Stocks are off to a strong start for the week. All stock sectors are in the green today led by technology, energy, communications, financials, and cyclicals. All stocks sectors are also in the green with the technology-dominated Nasdaq in the lead. The Dow Industrials...
READ MORE
MEMBERS ONLY
Are We In For An Improved Market Breadth? The Level Of 9200 Holds The Key

by Milan Vaishnav,
Founder and Technical Analyst, EquityResearch.asia and ChartWizard.ae
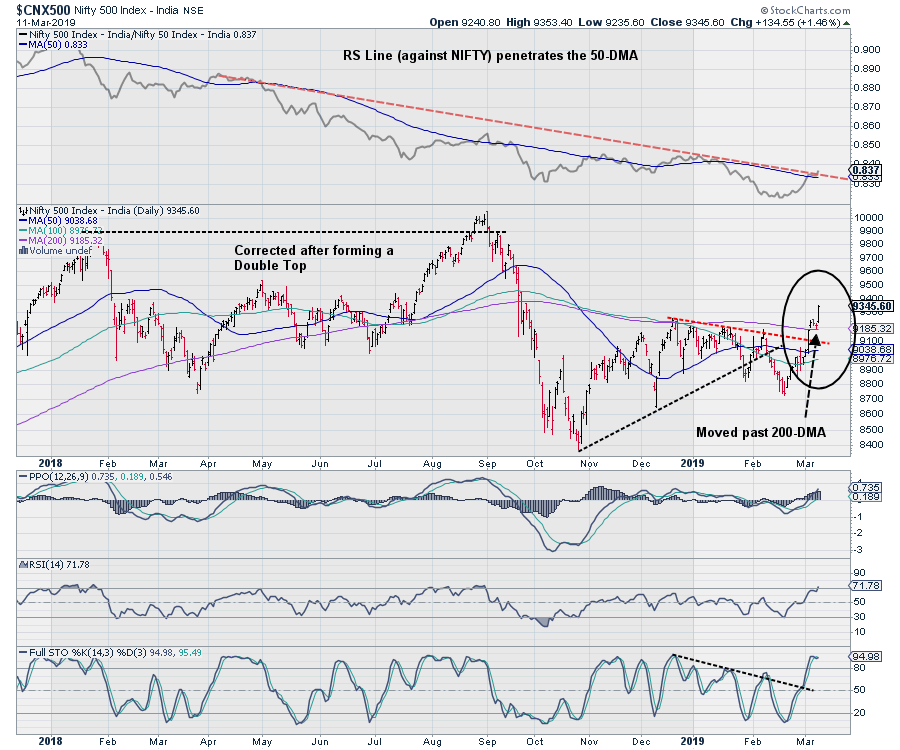
The Indian markets saw a strong start to the week as the headline index ended with a robust gain of 132.65 points (+1.20%). With this move, the index has once again begun to attempt a breakout. This being said, over the past several weeks, the market breadth has...
READ MORE
MEMBERS ONLY
Seagate Rises from the Ashes

by Arthur Hill,
Chief Technical Strategist, TrendInvestorPro.com
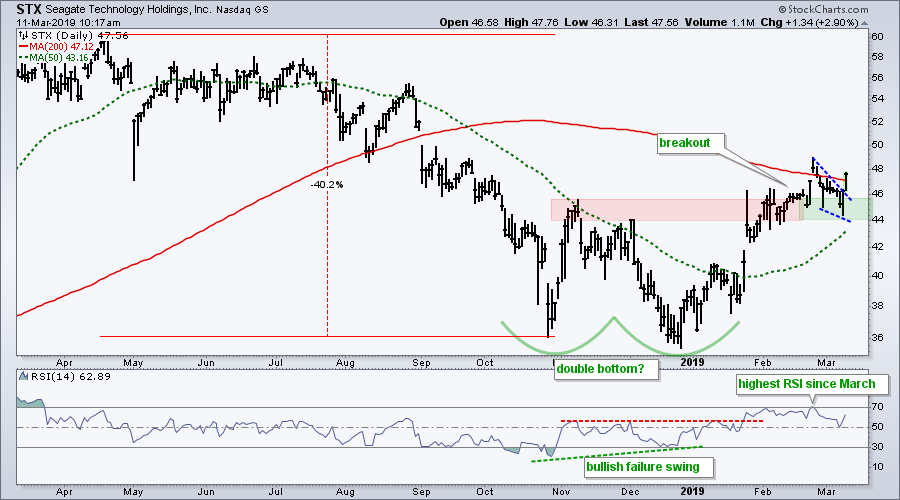
Seagate Technology was one of the weakest tech stocks in 2018 as it fell around 40% from the April high to the October low. Things appear to be turning about here in 2019 as stock finds its footing and triggers two breakouts.
The chart below shows STX with two lows...
READ MORE
MEMBERS ONLY
Poor Jobs, Big Reversal, What's Next?
by Tom Bowley,
Chief Market Strategist, EarningsBeats.com
Market Recap for Friday, March 8, 2019
Friday started ugly. There's no way to sugar coat the worst jobs report in 18 months. Nonfarm payrolls fell way short of expectations, 20,000 actual vs. 175,000 consensus estimate. Slowing job growth was an excellent predictor of the last...
READ MORE
MEMBERS ONLY

BULL MARKET IN STOCKS REACHES ITS TENTH ANNIVERSARY TODAY -- AND IS THE LONGEST IN HISTORY -- THE ECONOMIC EXPANSION WILL HIT ITS TENTH ANNIVERSARY IN JUNE -- AND IS NEARING A NEW RECORD AS WELL
by John Murphy,
Chief Technical Analyst, StockCharts.com
HAPPY TENTH ANNIVERSARY... Today marks the tenth anniversary of the bull market in stocks that started on March 9, 2009. It's already the longest in history, and the first bull market to last ten years. According to the Wall Street Journal, the S&P 500 has gained...
READ MORE
MEMBERS ONLY
Week Ahead: Markets May Remain Tentative; These Pockets Likely To Relatively Outperform
by Milan Vaishnav,
Founder and Technical Analyst, EquityResearch.asia and ChartWizard.ae
The past week fared better than the one prior as the market added more to its gains. A major portion of the weekly gains was posted in the first half, while the last two sessions were spent amid consolidation. In a 4-day week, the headline index NIFTY50 ended with weekly...
READ MORE
MEMBERS ONLY
DP WEEKLY WRAP: Market Breaks, Gold Fakes

by Carl Swenlin,
President and Founder, DecisionPoint.com
It took over two weeks, but the market top we've been looking for finally materialized. Price broke down through a rising bottoms line that goes back to the beginning of January. Also violated was the bottom of the trading range that has lasted over two weeks. At very...
READ MORE
MEMBERS ONLY

CONSUMER DISCRETIONARY SPDR FALLS BACK BELOW 200-DAY AVERAGE -- APPAREL RETAILERS ARE LEADING THE S&P 500 RETAIL SPDR LOWER -- AMAZON.COM ISN'T DOING MUCH BETTER -- CONSUMER CYCLICALS/STAPLES RATIO IS ALSO WEAKENING
by John Murphy,
Chief Technical Analyst, StockCharts.com
CONSUMER DISCRETIONARY SPDR IS BACK BELOW ITS 200-DAY AVERAGE... As of today, the Nasdaq Composite Index and the S&P 500 are trading back below their 200-day averages. That leaves only the Dow Industrials still above that long-term support line. A number of sector ETFs have either failed a...
READ MORE
MEMBERS ONLY
Reliability of Pattern Recognition

by Greg Morris,
Veteran Technical Analyst, Investor, and Author
I developed this method primarily for candle pattern identification when I wrote my book, Candlestick Charting Explained (the book was first published in 1992 and now is in its third edition). The reliability concept equally applies to any type of pattern, including the many chart patterns widely used in technical...
READ MORE
MEMBERS ONLY

Weekly Market Review & Outlook - Everywhere and Nowhere for SPX
by Arthur Hill,
Chief Technical Strategist, TrendInvestorPro.com
* The First Pullback of the Year.
* A Big Drawn-out Range.
* Index Breadth Table Update.
* Sector Table Update.
* Finance Fails below November High.
* Retail and Banks Get Pummeled.
* A Bullish Continuation for Bonds.
* ChartList Updates.
... The First Pullback of the Year
... The S&P 500 fell the last four days...
READ MORE
MEMBERS ONLY
Jobs Disappoint; Dollar Breakout Bad For Energy, Materials
by Tom Bowley,
Chief Market Strategist, EarningsBeats.com
Market Recap for Thursday, March 7, 2019
Selling in U.S. equities continued for a fourth consecutive session as this is easily the most difficult period in 2019 for the equity bulls. The first technical breakdown occurred on daily charts as all of our major indices closed beneath their respective...
READ MORE
MEMBERS ONLY

Dollar Breaks To New Highs As Several Stock Averages Drop Below Their 200-Day Moving Averages

by Martin Pring,
President, Pring Research
* Dollar Diffusion Gives a Buy Signal
* Differential Interest Rates Turn Bullish for the Dollar
* $NYA and $COMPQ Drop Below Their 200-Day MAs
One would think that a record trade deficit would be bearish for the dollar. However, the market does not agree, as the Invesco Bullish Dollar ETF (UUP) just...
READ MORE
MEMBERS ONLY

SMALL CAPS AND TRANSPORTS CONTINUE TO LEAD STOCKS LOWER -- STOCK INDEXES UNDERCUT 20-DAY AVERAGES -- AND ARE THREATENING 200-DAY LINES -- BOND PRICES RALLY -- EUROZONE BOND PRICES RISE ON MORE DOVISH ECB -- A PLUNGING EURO PUSHES DOLLAR TO TWO-YEAR HIGH
by John Murphy,
Chief Technical Analyst, StockCharts.com
GLOBAL STOCKS TURN DOWN FROM OVERBOUGHT TERRITORY... Several of the writers on this site have been pointing out that the strong 2019 stock rally had become over-extended, and was up against formidable chart resistance at their November high. So it's not a big surprise to see some profit-taking...
READ MORE
MEMBERS ONLY
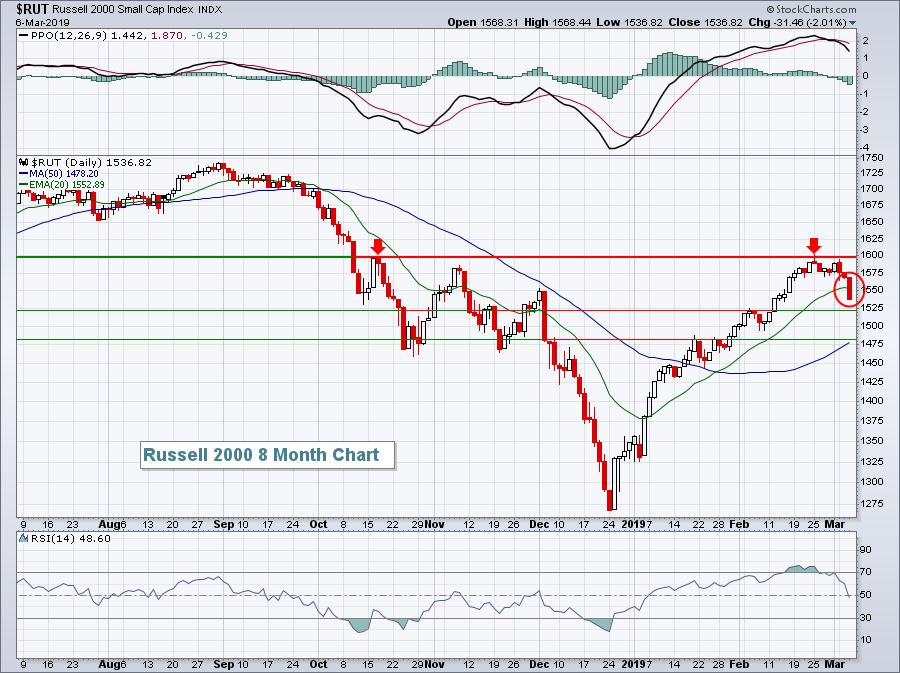
VIX Clears First Key Level, Bears Regain Grip
by Tom Bowley,
Chief Market Strategist, EarningsBeats.com
Market Recap for Wednesday, March 6, 2019
All of our major indices took a hit yesterday, including the small cap Russell 2000 ($RUT), which once again lagged badly and dropped another 2.01%. The RUT was easily the worst performer as the Dow Jones, S&P 500 and NASDAQ...
READ MORE
MEMBERS ONLY
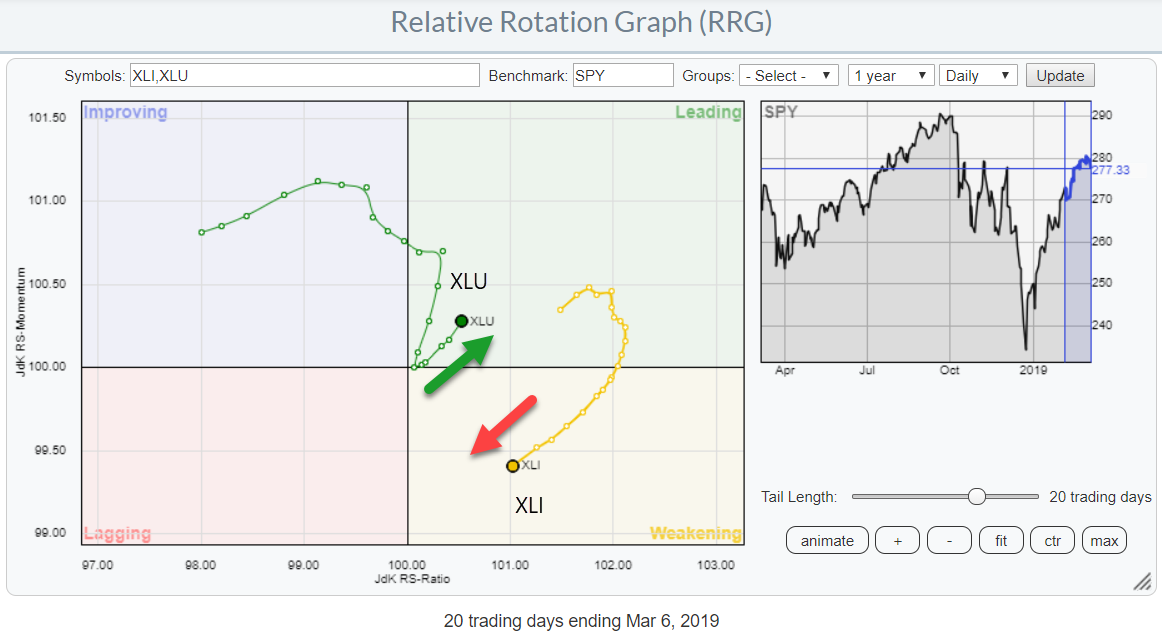
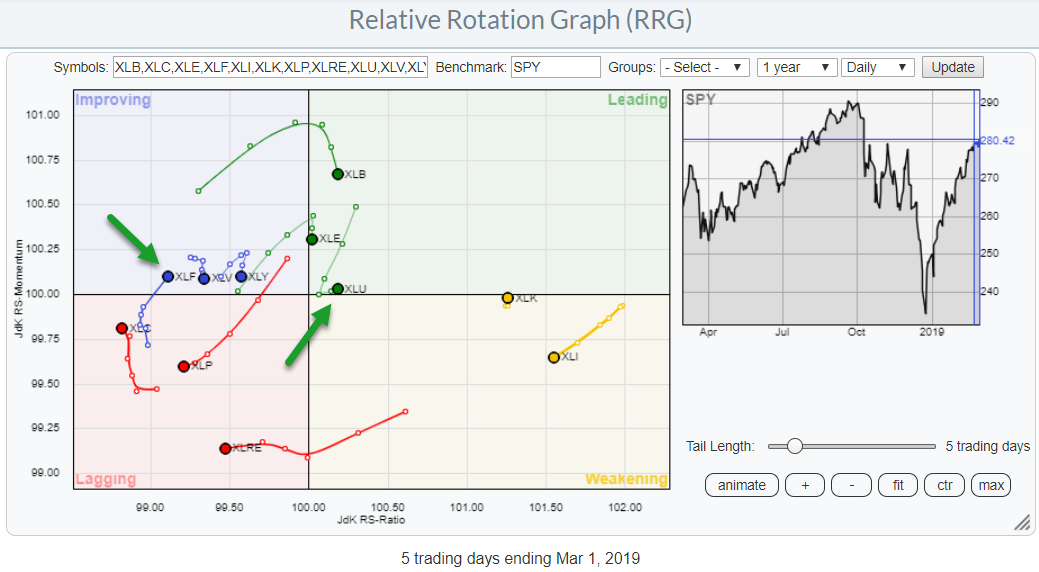
Spotting A Pair Trade On Relative Rotation Graph Of US Sectors

by Julius de Kempenaer,
Senior Technical Analyst, StockCharts.com
The above Relative Rotation Graph shows the daily rotation over the past 20-days for the Utilities and Industrials sectors.
I have isolated the tails of these two sectors to be able to show them in more detail and highlight the opposite directions that they started moving in.
When you bring...
READ MORE
MEMBERS ONLY

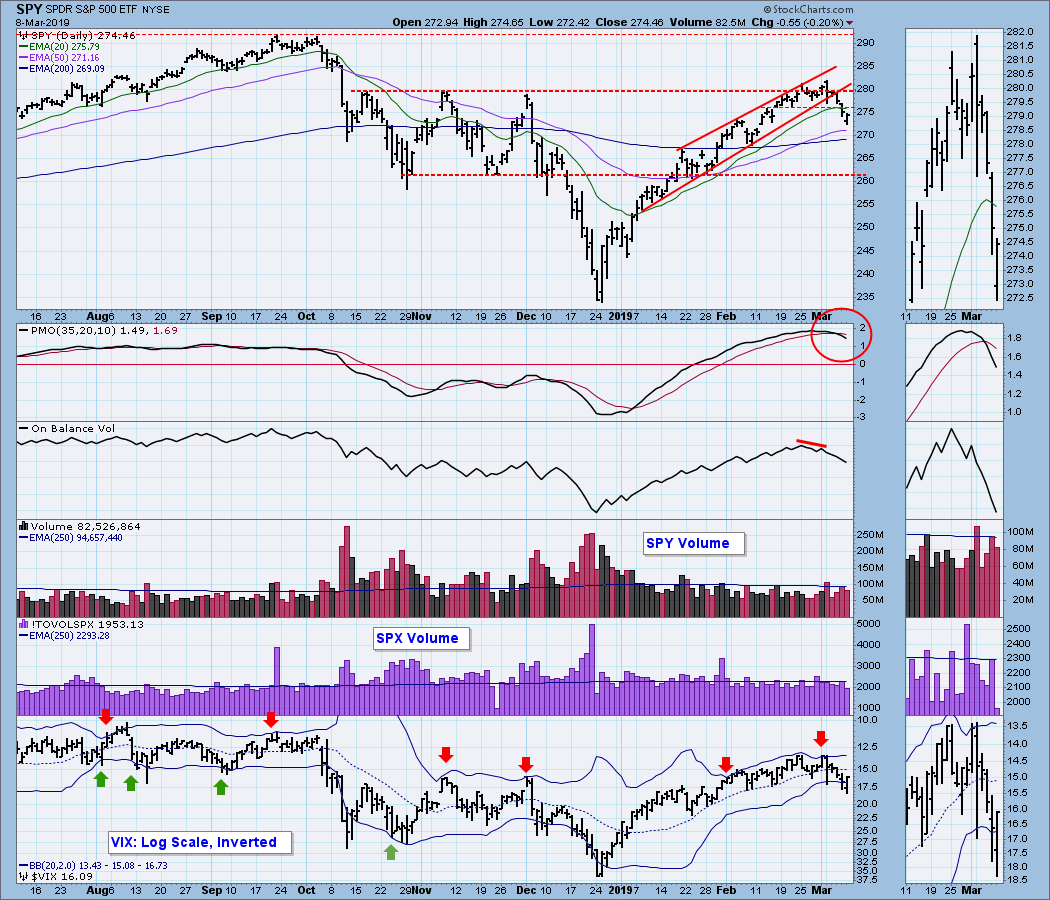
DP Alert: SPX Triggers New Short-Term PMO SELL Signal - Wedge Finally Breaks Down

by Erin Swenlin,
Vice President, DecisionPoint.com
This will be fairly brief today, as I am in the process of moving to a new home and it's a bit crazy over here. It's important to note the new ST PMO BUY signal, which occurred on a PMO positive crossover on the SPX daily...
READ MORE
MEMBERS ONLY
Relative Strength Says We're Going Higher
by Tom Bowley,
Chief Market Strategist, EarningsBeats.com
Market Recap for Tuesday, March 5, 2019
Another weak start and the inability to finish well contributed to minor losses across our major indices on Tuesday. Relative weakness in the small cap Russell 2000 resulted in a 0.45% loss there, while our other major indices fell more modestly -...
READ MORE
MEMBERS ONLY

Tilray Goes from Most Exciting to Most Boring
by Arthur Hill,
Chief Technical Strategist, TrendInvestorPro.com
Tilray (TLRY) listed on the Nasdaq at $17 with an IPO in July and promptly surged above $300. The stock then worked its way below 100 over the next few months and managed to stabilize in the 65 to 80 zone this year.
The chart below shows the Bollinger Bands...
READ MORE
MEMBERS ONLY
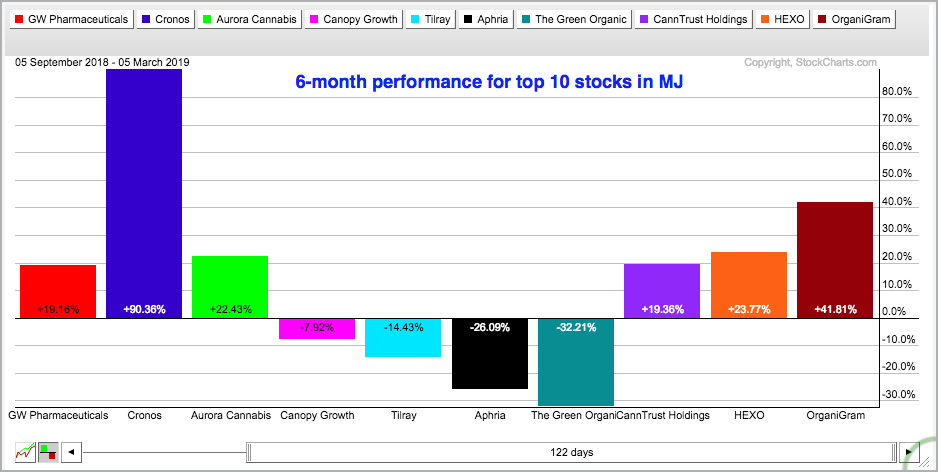
Are Cannabis Stocks Poised to Go Higher?
by Arthur Hill,
Chief Technical Strategist, TrendInvestorPro.com
Sorry, I could not resist that title. Today's commentary will focus on the Alternative Harvest ETF (MJ) and six of its components. I am sure there are other cannabis-related names out there, but I would like to focus on the purer plays. For example, the Advisor Shares Vice...
READ MORE
MEMBERS ONLY
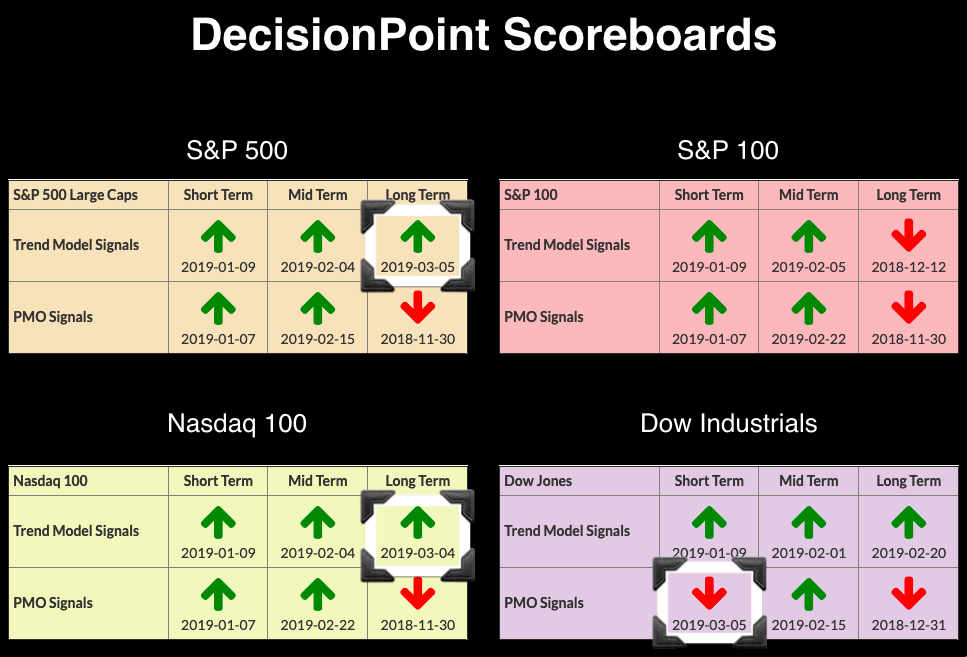
DP Bulletin: LT Trend Model BUYs on SPX and NDX - ST PMO SELL on Dow
by Erin Swenlin,
Vice President, DecisionPoint.com
The new Long-Term Trend Model (LTTM) BUY signals triggered on the SPX yesterday (3/4) and on the NDX today (3/5). We are probably seeing these just in time for a pullback or correction ahead. The Dow seems to agree, as it generated a new ST PMO SELL signal....
READ MORE
MEMBERS ONLY

Beware The Ides of March - and an Overstretched Stock Market
by Martin Pring,
President, Pring Research
* Strong Broadly-Based Rally
* NYSE Declining Peaks and Troughs Still in Force
* Several Short-Term Indicators Starting to Point South
Strong Broadly-Based Rally
The rally dating from Christmas Eve has been a powerful one, generating an approximate 20% gain from its low. It has also been broad, not only enabling the NYSE...
READ MORE
MEMBERS ONLY

KOHLS AND TARGET LEAD RETAILERS HIGHER -- RETAIL SPDR REMAINS BELOW 200-DAY LINE -- HOME CONSTRUCTION ISHARES FALL BELOW ITS 200-DAY LINE -- SO DO LENNAR AND DR HORTON -- STOCK INDEXES HOLD STEADY AFTER MODEST PROFIT-TAKING
by John Murphy,
Chief Technical Analyst, StockCharts.com
KOHLS AND TARGET LEAD RETAILERS HIGHER ... Chart 1 shows Kohls (KSS) surging 7% to clear its 200-day average and trade at the highest level since November. Chart 2 shows Target (TGT) up nearly 5% and also trading at the highest level in three months. The broadline retailer is also trading...
READ MORE
MEMBERS ONLY
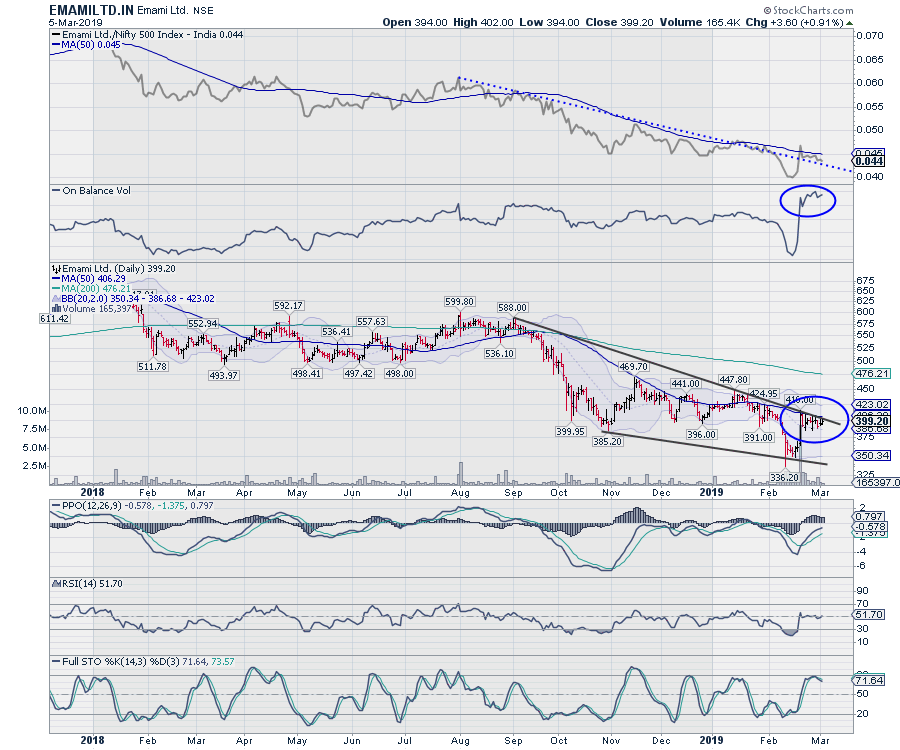
EMAMI Limited - Up for a Trend Reversal?
by Milan Vaishnav,
Founder and Technical Analyst, EquityResearch.asia and ChartWizard.ae
Emami Limited is one of the leading and fastest growing personal and healthcare businesses in India, with an enviable portfolio of household brand names such as BoroPlus, Navratna, Fair and Handsome, Zandu Balm, Mentho Plus Balm, Fast Relief and Kesh King.
The stock price of EMAMILTD.IN has been under-performing...
READ MORE
MEMBERS ONLY
This Financial Sector Group Has Caught Fire
by Tom Bowley,
Chief Market Strategist, EarningsBeats.com
Market Recap for Monday, March 4, 2019
It's really hard for me to say who won yesterday's market battle. Obviously, we finished lower so I guess that would be the determining factor to say the bears won this battle. But it sure felt like at least...
READ MORE
MEMBERS ONLY

S&P 500 Trending
by Bruce Fraser,
Industry-leading "Wyckoffian"
The Wyckoff Method constructs trendlines somewhat differently than other popular technical methods. Mr. Wyckoff’s trendline method is obscure and not in wide usage. The main benefit of this construction technique is to support effective trading setups as the trend is unfolding. Trends (all timeframes) tend to set the rate...
READ MORE
MEMBERS ONLY

Pair Analysis - 4
by Greg Morris,
Veteran Technical Analyst, Investor, and Author
This will wrap up the Pair Analysis series. In this article I will show:
Some basic statistics on the pairs I used in the analysis.
The top 50 pairs based on performance.
The bottom 50 pairs based on performance.
The Sharpe Ratio is a measure of return and risk, with...
READ MORE
MEMBERS ONLY
The NASDAQ Is Showing Little Signs of Topping
by Tom Bowley,
Chief Market Strategist, EarningsBeats.com
Market Recap for Friday, March 1, 2019
U.S. equities rallied strongly at the open on Friday, then gave back most, if not all, of those gains by late morning, and finally rallied once again in the afternoon. While intraday volatility was high and different, the end result was what...
READ MORE
MEMBERS ONLY

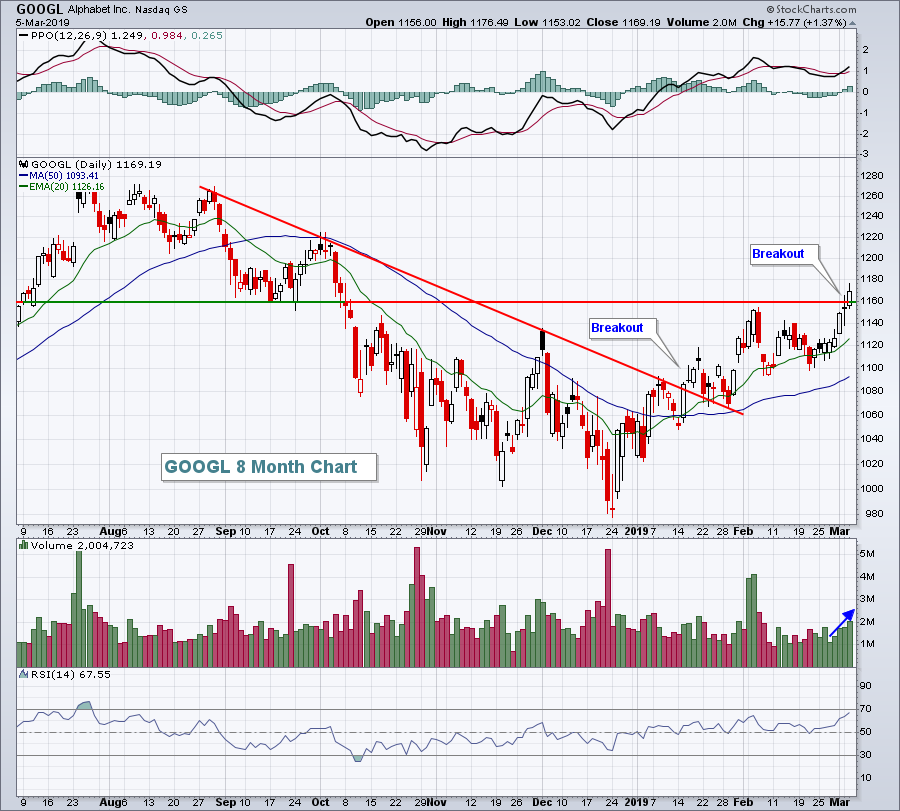
Google Goes Gaga
by Arthur Hill,
Chief Technical Strategist, TrendInvestorPro.com
Google, or rather Alphabet, broke out of a short-term consolidation and this could have long-term implications.
The chart below shows GOOGL hitting support in the 980-1000 area from October to December. This support zone extends back to December 2017 and represents a whole lot of demand. Buyers are clearly active...
READ MORE
MEMBERS ONLY
Something that makes me go ...Hmmmmmmm?
by Julius de Kempenaer,
Senior Technical Analyst, StockCharts.com
The daily RRG for US sectors shows a lot of sectors "hooking" lower and only two sectors that are, still, at a positive RRG-Heading, ie rising on both axes.
The chart above is showing a 5-day tail on every sector. if we look at the lengths and trajectories...
READ MORE
MEMBERS ONLY
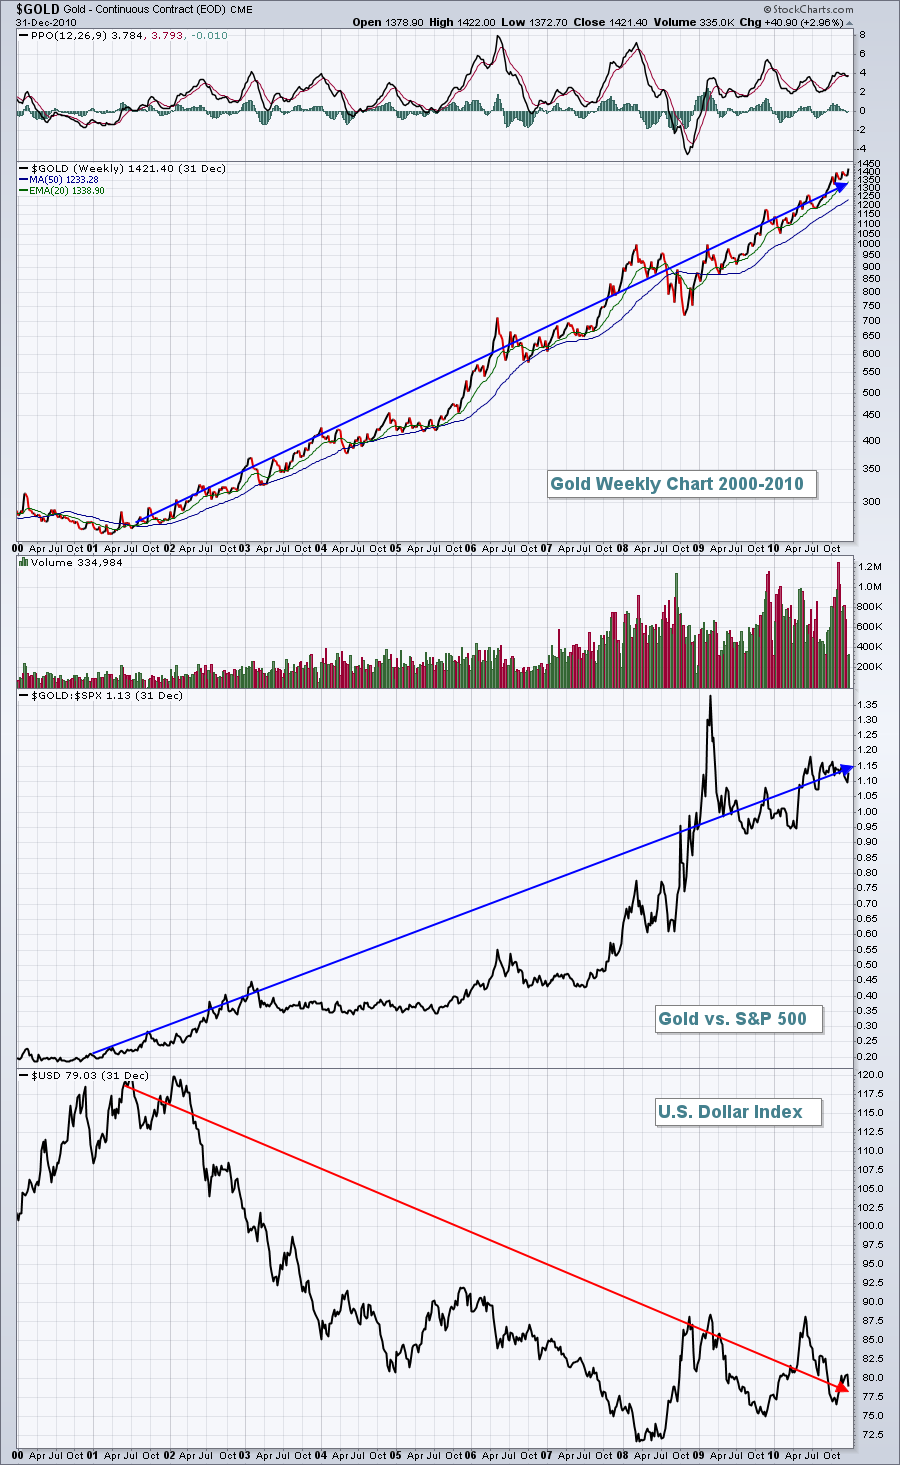
The Gold Rush Is Likely Over
by Tom Bowley,
Chief Market Strategist, EarningsBeats.com
Gold ($GOLD) performs its best in a falling U.S. Dollar ($USD) environment. There is a solid inverse relationship between the direction of GOLD and the direction of the USD that has existed for decades. The following chart illustrates this relationship from 2001 to 2010:
"Gold thrives when the...
READ MORE
MEMBERS ONLY
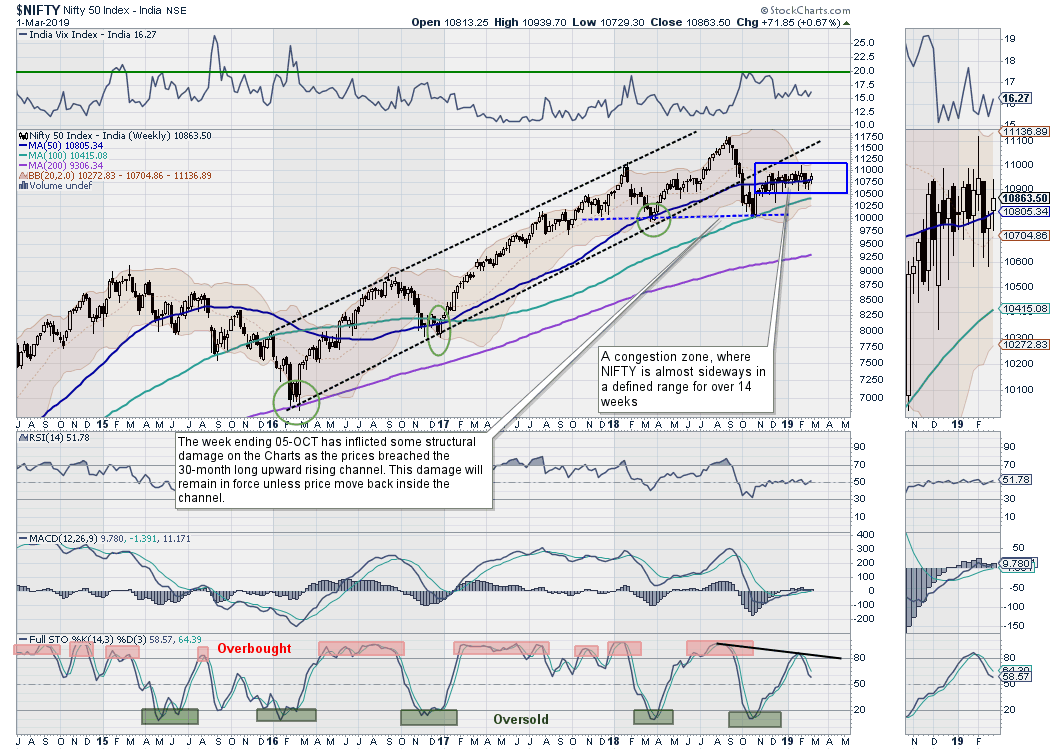
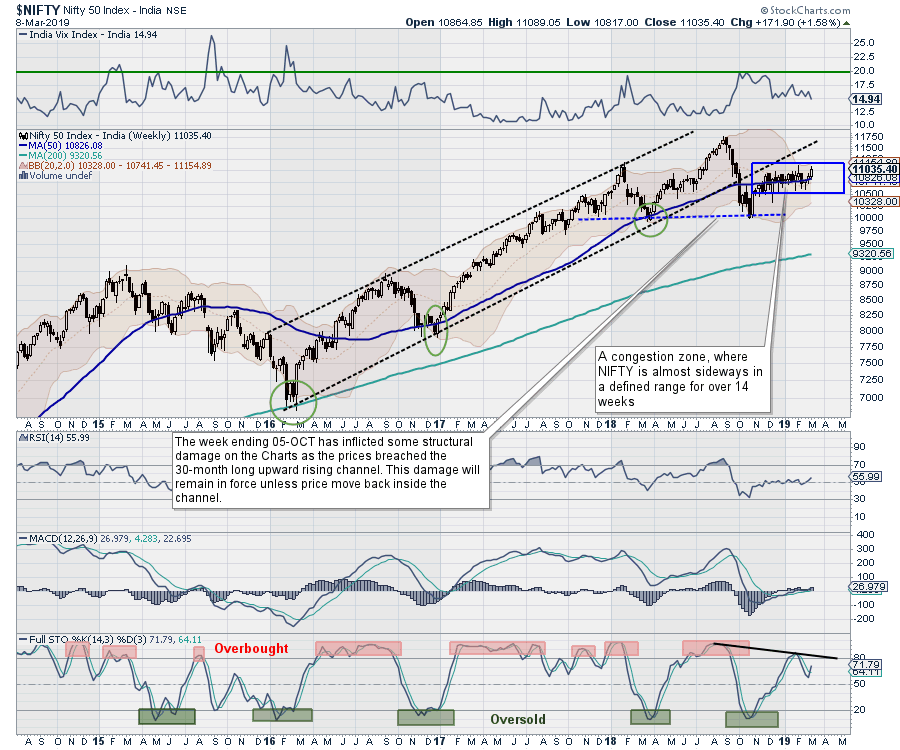
NIFTY Set-up For The Coming Week: Taking Out Imp Levels Necessary; These Pockets May Relatively Outperform
by Milan Vaishnav,
Founder and Technical Analyst, EquityResearch.asia and ChartWizard.ae
For yet another week, the markets took no directional call, going on to end the week with modest gains. The NIFTY remained within a broadly-defined range throughout the week, making some gains towards the end that halted near the 200-DMA. On the weekly charts, the index continued with its sideways...
READ MORE
MEMBERS ONLY
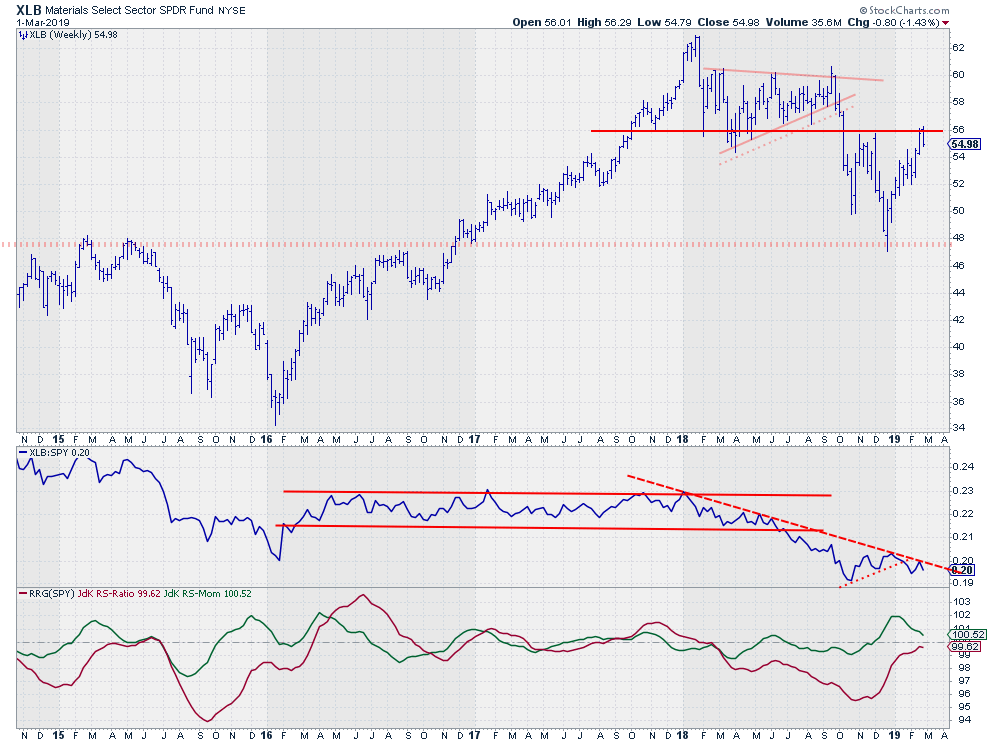
Materials (XLB) Are Failing To Break Resistance And Lose Relative Strength
by Julius de Kempenaer,
Senior Technical Analyst, StockCharts.com
The Materials sector, XLB, is testing overhead resistance around $56. This is the level where lows have been formed in 2017 and 2018 as well as two important highs at the end of 2018. For the time being, the attempt to break is failing, and this is visible on both...
READ MORE
MEMBERS ONLY

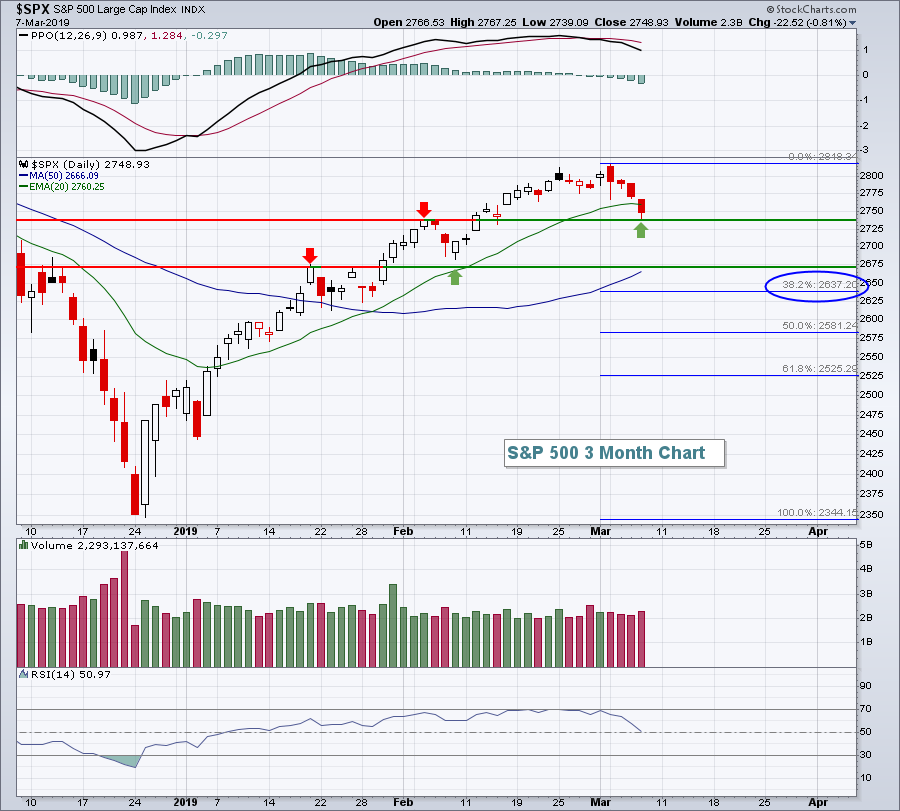
S&P 500 Clears the 200-day. Should we Take the Bait?
by Arthur Hill,
Chief Technical Strategist, TrendInvestorPro.com
We are all well aware of the S&P 500 and the 200-day moving average, but how well does this moving average work for broad market timing? Pretty well, it turns out, but only on the long side.
I put the 200-day moving average to the test for the...
READ MORE
MEMBERS ONLY
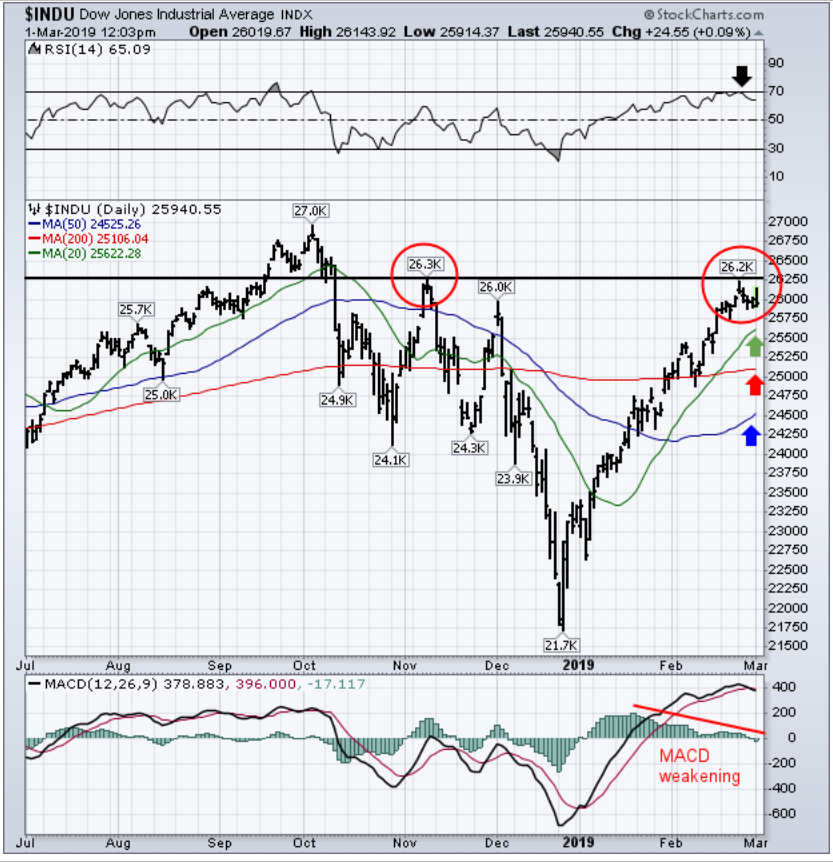
Major Stock Indexes Continue to Test Overhead Resistance Near Their November Highs
by John Murphy,
Chief Technical Analyst, StockCharts.com
Editor's Note: This article was originally published in John Murphy's Market Message on Friday, March 1st at 11:55am ET.
After having one of the strongest starts to a new year in history, major stock indexes find themselves testing yet another potential overhead resistance barrier. And...
READ MORE
MEMBERS ONLY
Mid- and Small-Cap Relative Performance Matters! Don't Miss These Crossovers!
by Erin Swenlin,
Vice President, DecisionPoint.com
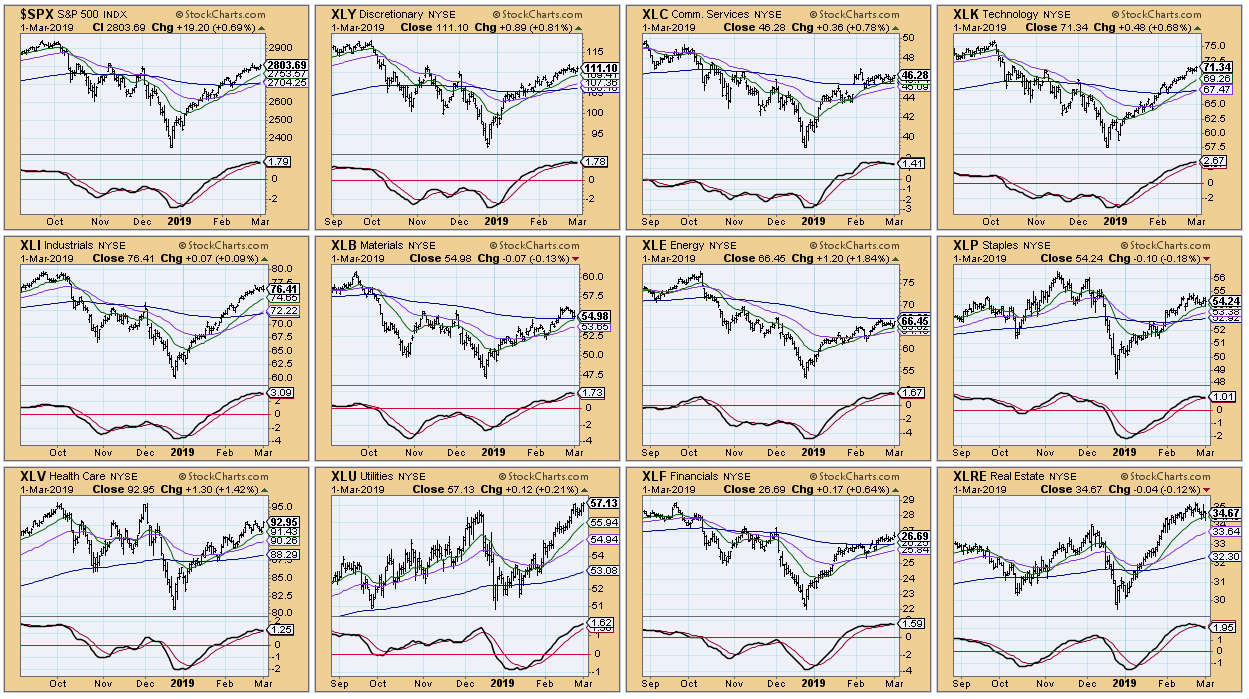
While comparing the relative performance of the OEX, IJH and IWM to the SPX, I found an attention flag. The market is very overbought, with momentum indicators rolling over in overbought territory. The same thing goes for all the sectors. A CandleGlance of the sector SPDRs and SPX are all...
READ MORE
MEMBERS ONLY
A Treasure Chest Awaits You

by John Hopkins,
President and Co-founder, EarningsBeats.com
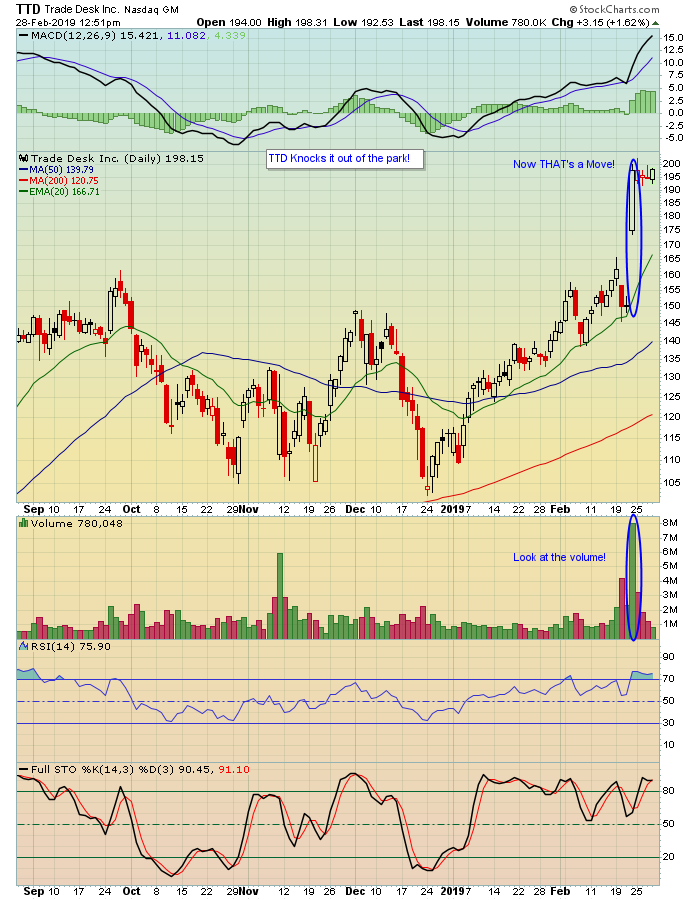
SO MANY stocks that recently reported earnings beat expectations and gapped up sharply on very strong volume after their results were released. Those stocks include OLED, TTD, W and PANW, among others. In fact, take a look at the chart below on TTD, which reported its earnings before the bell...
READ MORE
MEMBERS ONLY
DP WEEKLY/MONTHLY WRAP: Internals Overbought and Topping
by Carl Swenlin,
President and Founder, DecisionPoint.com
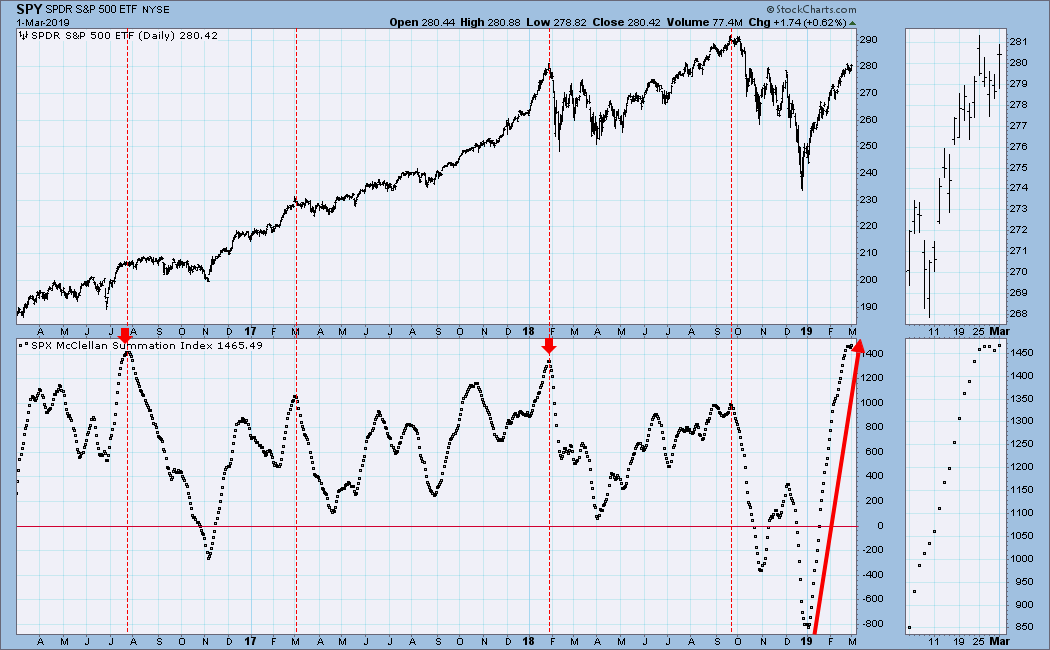
The McClellan Summation Index (ratio-adjusted version) has had the longest uninterrupted upside run since 2003, when the market was coming up off of the 2000-2002 bear market lows. The indicator is very overbought and it is trying to top, so we should expect some kind of corrective action over the...
READ MORE
MEMBERS ONLY

Learning From Legends: Gerald Loeb's Timeless Investing Wisdom Stands The Test Of Time

by Gatis Roze,
Author, "Tensile Trading"
I’m sure you’ve heard the expression, “the more things change, the more they stay the same.” Gerald Loeb used this phrase frequently. I’ve always had great respect for Mr. Loeb. True, he was an extraordinary investor and a best-selling author. But what I most respected him for...
READ MORE