MEMBERS ONLY

PLUNGING BOND YIELDS SEND SIGNAL OF ECONOMIC WEAKNESS -- S&P 500 FALLS BELOW 200-DAY AVERAGE AFTER FAILING TEST OF NOVEMBER HIGH -- BIGGEST LOSERS ARE BANKS, SMALL CAPS, SEMIS, AND TRANSPORTS -- UTILITIES HIT NEW HIGHS AND ARE THE ONLY WINNERS

by John Murphy,
Chief Technical Analyst, StockCharts.com
TEN-YEAR TREASURY YIELD PLUNGES BELOW ITS 200-DAY AVERAGE ... Chart 1 shows the 10-Year Treasury yield plunging to the lowest level in three months and falling below its 200-day average for the first time in more than a year. That means that investors are putting a lot of money into Treasury...
READ MORE
MEMBERS ONLY
RRG Says Stocks Are The Weakest Asset Class

by Julius de Kempenaer,
Senior Technical Analyst, StockCharts.com
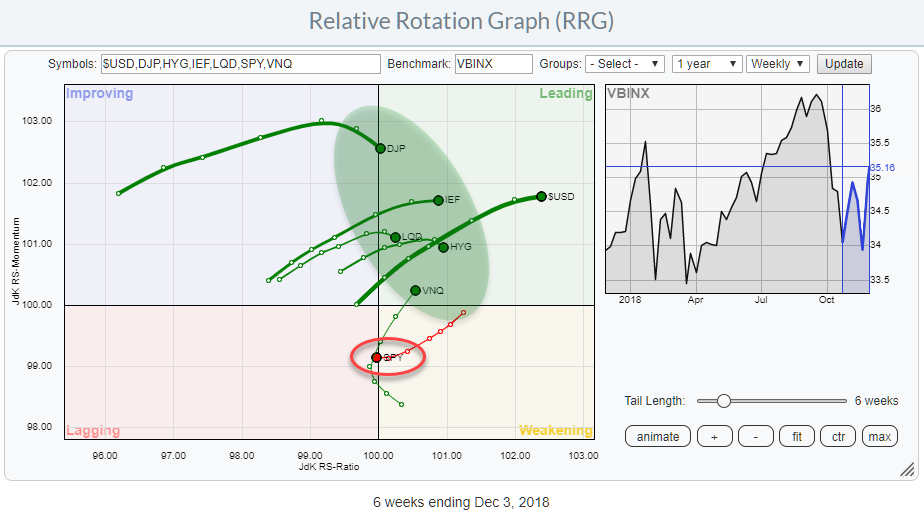
The Relative Rotation Graphs shows the rotation of various asset classes around a balance benchmark portfolio (VBINX).
The message could not be more clear. Stocks (SPY) just crossed over from weakening into the lagging quadrant while ALL other asset classes are inside the leading quadrant.
This is a pretty clear...
READ MORE
MEMBERS ONLY

A Funny Thing May Have Happened To The Secular Reversal In Rates

by Martin Pring,
President, Pring Research
* The Secular Bear Market in Yields
* Near-Term Indications of a Decline in Bond Yields
* Watch That Stock/Bond Relationship for an Important Signal
The Secular Bear Market in Yields
Please note that the comments in this article relate to bond yields with maturities of 3-years or longer. They do not...
READ MORE
MEMBERS ONLY

Unimpressive Breadth - Finance and Industrials Weigh - Strange Happenings in the Bond Market

by Arthur Hill,
Chief Technical Strategist, TrendInvestorPro.com
* Three Gaps in the Same Place for SPY.
* What's Up with Bonds and Utes?
* Strange Happenings on the Yield Curve.
* Finance and Industrials are Still Laggards.
* On Trend on Youtube.
... Internal Strength on Big Bounces ...
Monday's surge was impressive when looking at the change from Friday&...
READ MORE
MEMBERS ONLY
December 2018 Market Roundup with Martin Pring
by Martin Pring,
President, Pring Research
The Market Roundup Video For December is now available.
Good luck and good charting,
Martin J. Pring
The views expressed in this article are those of the author and do not necessarily reflect the position or opinion ofPring Turner Capital Groupof Walnut Creek or its affiliates....
READ MORE
MEMBERS ONLY
As We Head Into Winter, We Should Buy.....Home Construction Stocks?

by Tom Bowley,
Chief Market Strategist, EarningsBeats.com
Market Recap for Monday, December 3, 2018
Global stocks were buoyed on Monday by the United States and China agreeing to delay further tariffs for 90 days to provide the two countries an opportunity to work through its trade differences. Obviously, nothing has been resolved and it simply pushes back...
READ MORE
MEMBERS ONLY

Interview with Japanese Trader: Takehiro Hikita - Part 1

by Greg Morris,
Veteran Technical Analyst, Investor, and Author
This is a lengthy interview, so this article will be the first half, followed next week by the second part. Mr. Takehiro Hikita has graciously provided me with a large amount of insight into the candle pattern philosophy. I have never met anyone so devoted to the detailed study of...
READ MORE
MEMBERS ONLY
Here's A Bear Market Signal That's Yet To Turn Bearish
by Tom Bowley,
Chief Market Strategist, EarningsBeats.com
Market Recap for Friday, November 30, 2018
Friday's strength capped off a very solid week for the bulls, one in which the Dow Jones gained more than 1250 points. Strength was found everywhere although healthcare (XLV, +2.03%) and utilities (XLU, +1.48%) were the big winners to...
READ MORE
MEMBERS ONLY

Cisco Holds Up Well and Maintains Uptrend
by Arthur Hill,
Chief Technical Strategist, TrendInvestorPro.com
Relative strength, an uptrend and a bullish continuation pattern point to higher prices for Cisco (CSCO). First and foremost, Cisco is in a long-term uptrend. The stock recorded a 52-week high in early October, the 50-day SMA is above the 200-day SMA and price is above the 200-day.
Second, Cisco...
READ MORE
MEMBERS ONLY

International Intrigue

by Bruce Fraser,
Industry-leading "Wyckoffian"
Rolling into the New Year can often bring seismic shifts in financial markets. In January of 2018 stock indexes climaxed and reversed. This set the tone of market action for the year. International markets were among the hardest hit during the year. The iShares MSCI Emerging Markets ETF (EEM) declined...
READ MORE
MEMBERS ONLY
Combining Strong Technicals And Fundamentals To Wildly Outperform The S&P 500
by Tom Bowley,
Chief Market Strategist, EarningsBeats.com
Everybody wants the secret formula. You know, the one where you never lose money. Well, I haven't found THAT one yet, but trading companies that have recently beaten Wall Street revenue and EPS estimates is a fairly solid runner-up strategy. A company that produces results in excess of...
READ MORE
MEMBERS ONLY
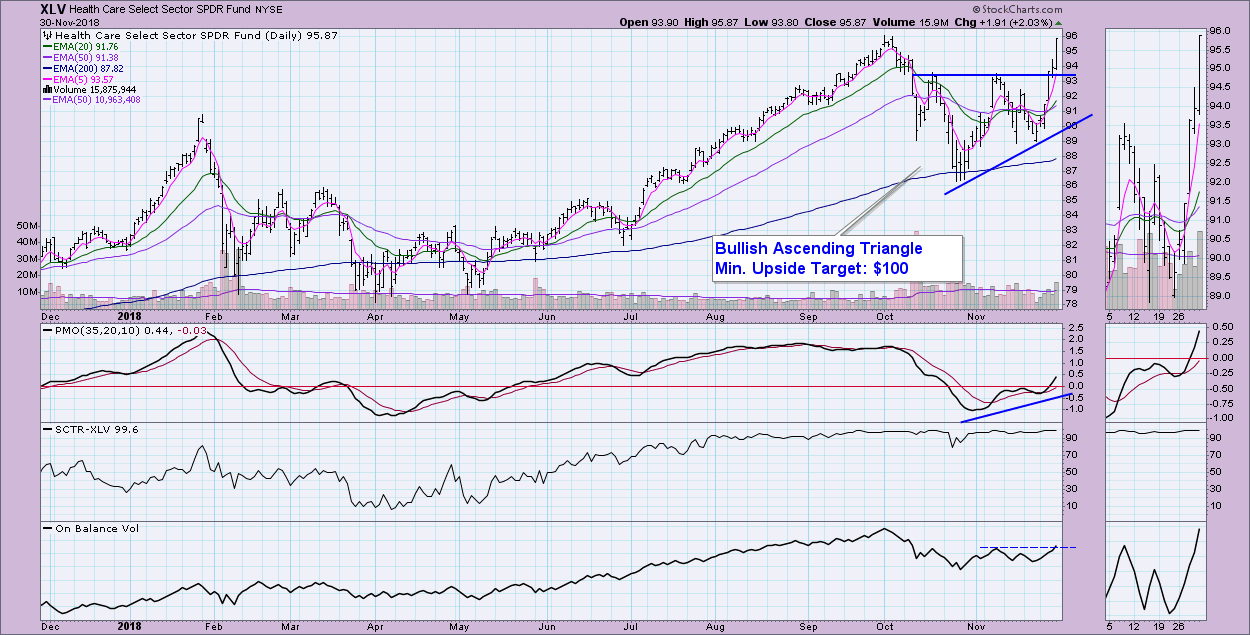
Healthcare Sector Bullish in All Three Timeframes

by Erin Swenlin,
Vice President, DecisionPoint.com
In my Thursday article in the DecisionPoint blog, I discussed the new PMO BUY signals on the DP Scoreboards, finishing off the article with a chart of the Healthcare Sector ETF (XLV) after I received a new Intermediate-Term Trend Model BUY signal (a positive 20/50-EMA crossover on the daily...
READ MORE
MEMBERS ONLY

Confirming Moving Average Signals in the S&P 500
by Arthur Hill,
Chief Technical Strategist, TrendInvestorPro.com
The S&P 500 is the most widely used benchmark for U.S. stocks and the 200-day SMA is the most widely used moving average. Together, chartists can use the S&P 500 and the 200-day SMA to determine the broad trend for the stock market.
The S&...
READ MORE
MEMBERS ONLY
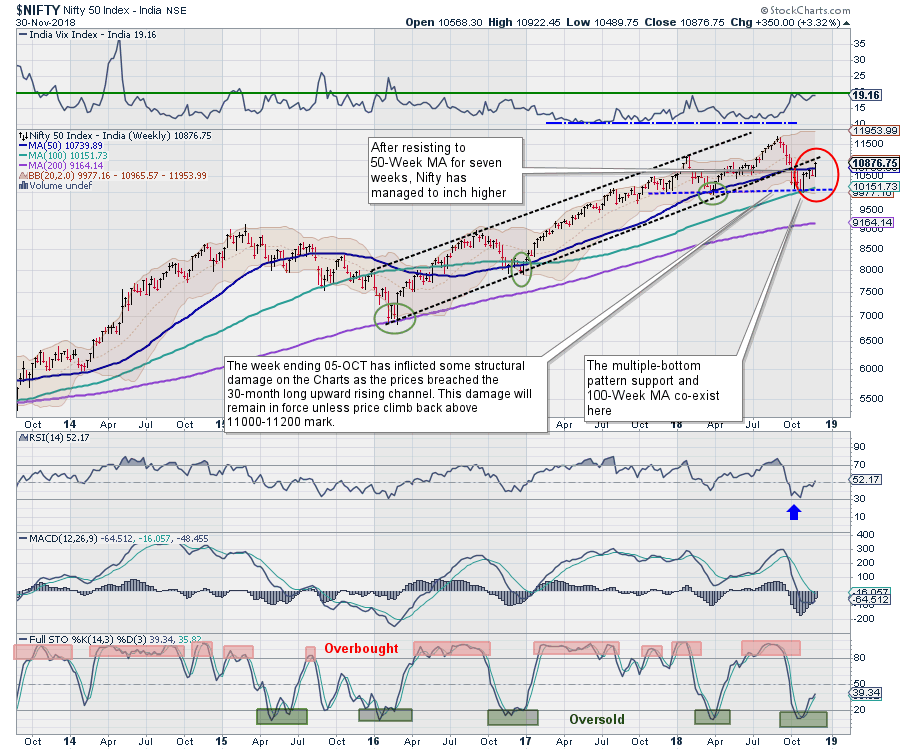
Weekly Outlook: NIFTY moves past 50-Week MA; sustenance above that may take Nifty higher

by Milan Vaishnav,
Founder and Technical Analyst, EquityResearch.asia and ChartWizard.ae
The previous week remained much better than expected for the markets, as the benchmark Index NIFTY50 ended the week on a strong note. The week proved to be even more technically important as the NIFTY was able to move past its 50-Week MA, after having resisted that level for seven...
READ MORE
MEMBERS ONLY
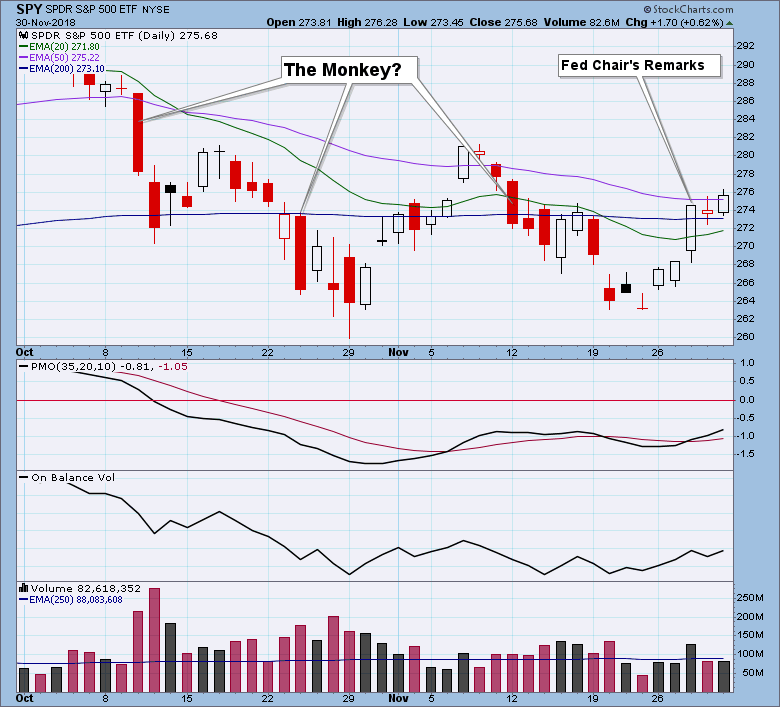
DP Weekly/Monthly Wrap: The Monkey Did It

by Carl Swenlin,
President and Founder, DecisionPoint.com
I usually spend my days at my desk noodling on the computer, reading, and casually watching business television with the sound off. (My idea of retirement.) With no sound to distract/annoy me, the most dangerous part of the TV watching is the endless stream of headline banners that announce...
READ MORE
MEMBERS ONLY

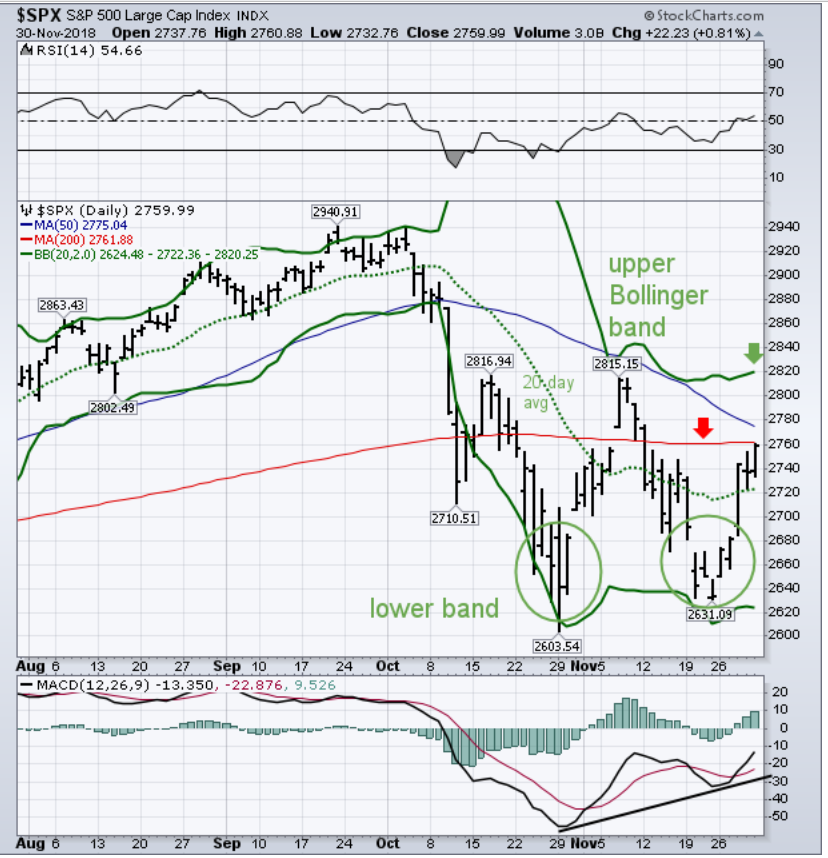
DAILY BOLLINGER BANDS SHOW SHORT-TERM STOCK TREND IMPROVING AND A POSSIBLE RETEST OF NOVEMBER HIGH -- WEEKLY AND MONTHLY BANDS ALSO SHOW SUPPORT -- BOLLINGER BAND WIDTH, HOWEVER, SHOWS THAT VOLATILITY REMAINS ELEVATED
by John Murphy,
Chief Technical Analyst, StockCharts.com
SHORT-TERM TREND IS IMPROVING ... There are lots of ways to determine the trend of the stock market. The placement of moving average lines is one of them. Bollinger bands (invented by John Bollinger) are another. Chart 1 applies both techniques to a daily chart of the S&P 500....
READ MORE
MEMBERS ONLY
Sticking With Companies That Report Strong Earnings

by John Hopkins,
President and Co-founder, EarningsBeats.com
The market finally found its legs last week after the Fed signaled they might slow down their interest rate-raising campaign. In fact, after being technically wounded for some time, all of the major indexes closed back above their respective 20-day moving averages, with the Dow clearing its 200 day as...
READ MORE
MEMBERS ONLY
Short-Term Trend is Improving
by John Murphy,
Chief Technical Analyst, StockCharts.com
Editor's Note: This article was originally published in John Murphy's Market Message on Friday, November 30th at 2:36pm ET.
There are lots of way to determine the trend of the stock market. The placement of moving average lines is one of them. Bollinger bands (invented...
READ MORE
MEMBERS ONLY

Ask Yourself This Question, But Make Sure You Do It This Sunday

by Grayson Roze,
Chief Strategist, StockCharts.com
I’m going to let you in on a little secret. The bulk of my financial analysis, portfolio reviews, and trading decision making happens on Sundays. Sure, I have daily trading routines that are tremendously important, and of course, I'm constantly watching the market during the week. But...
READ MORE
MEMBERS ONLY

Weekly Market Review & Outlook (with video) - Bucking Bulls Create Volatile Ranges
by Arthur Hill,
Chief Technical Strategist, TrendInvestorPro.com
* Checking and Balancing the S&P 500.
* Rodeo Range for the S&P 500.
* Small and Mid Caps Range after Breakdown.
* Confirmation and the Big Six Sectors.
* Retail is Not Hot.
* Credit Conditions Tightening.
* Palladium Continues Strong.
* Platinum Breaks Down.
* Gold Fights Downtrend and Strong Dollar.
* Notes from...
READ MORE
MEMBERS ONLY
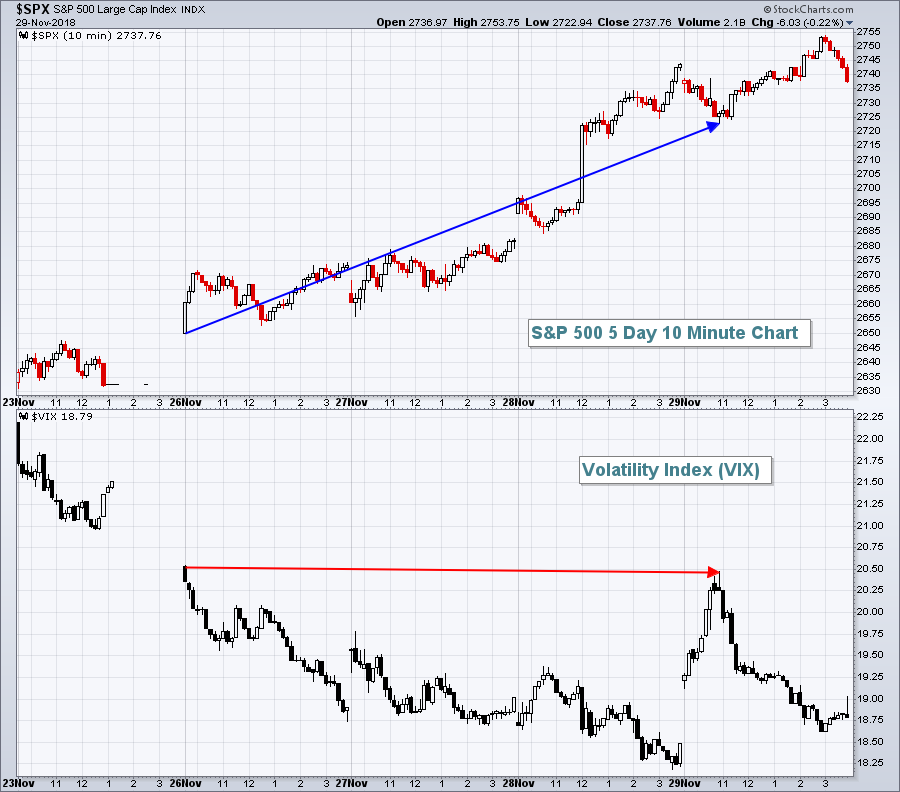
Volatility Index Suggests That Impulsive Selling Could Return
by Tom Bowley,
Chief Market Strategist, EarningsBeats.com
Market Recap for Thursday, November 29, 2018
Before I discuss strength and weakness from the mixed action on Thursday, let me first say that the Volatility Index ($VIX) remains one of my biggest fears about the current state of the market. In the morning yesterday, the VIX touched its high...
READ MORE
MEMBERS ONLY

Plotting breadth indicators on Relative Rotation Graphs - Part II
by Julius de Kempenaer,
Senior Technical Analyst, StockCharts.com
After finishing the previous article on plotting breadth indicators on Relative Rotation Graphs I have spent hours and hours on studying probably a couple of thousand different RRGs holding various groups of sectors in combination with their breadth equivalents.
And although I did not find the perfect prediction tool or...
READ MORE
MEMBERS ONLY
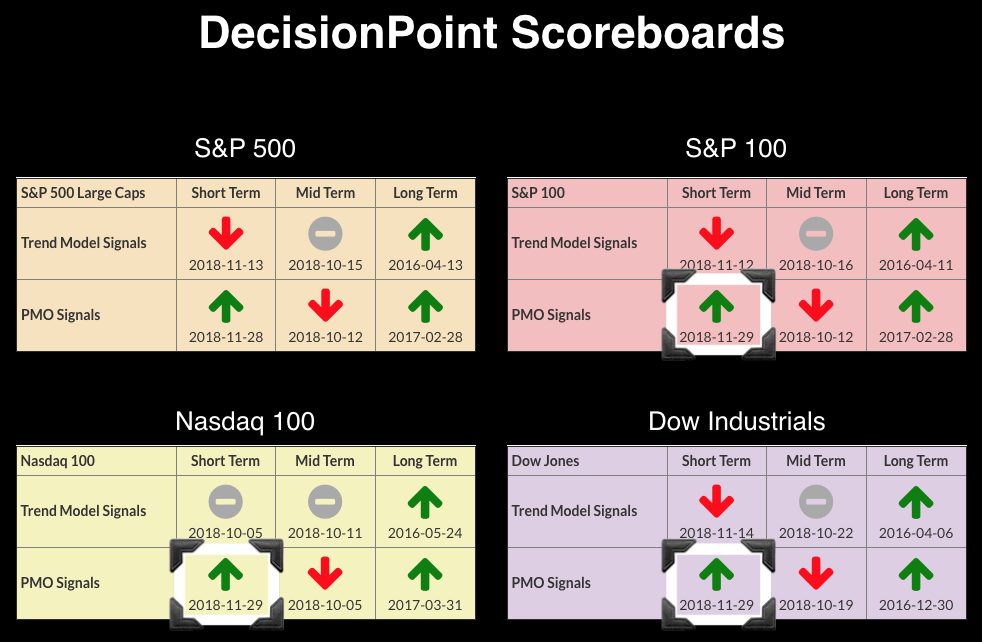
DP Bulletin: ST PMO BUY Signals on all Four Scoreboards - ITTM BUY for Very Bullish Healthcare SPDR (XLV)
by Erin Swenlin,
Vice President, DecisionPoint.com
This is just a quick summary of the new DecisionPoint signals that came in. Yesterday, the SPX logged a new ST PMO BUY Signal on the "relief rally." Despite declines on the remaining indexes, they all managed to trigger new ST PMO BUY signals. I'm not...
READ MORE
MEMBERS ONLY
U.S. Equities Rally Big Time, But I Remain Very Cautious
by Tom Bowley,
Chief Market Strategist, EarningsBeats.com
Market Recap for Wednesday, November 28, 2018
Wall Street finally (!) had a day where the bulls could smile at 4pm EST. It was a trend day where the buying begins early and continues throughout the trading day. These days tend to be very bullish, although there is still plenty to...
READ MORE
MEMBERS ONLY
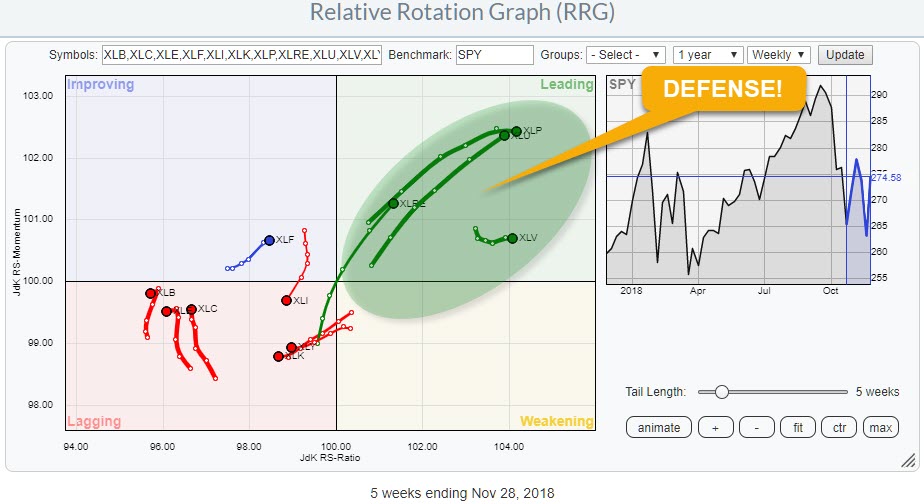
Market is still playing defense!
by Julius de Kempenaer,
Senior Technical Analyst, StockCharts.com
The recent rally of the S&P 500 index off the lows near 2600-2625 is nice but is it sustainable?
The Relative Rotation Graph above shows the rotation of the 11 SPDR sector ETFs against SPY and the message is very clear!
There is a clear split between the...
READ MORE
MEMBERS ONLY

Benchmarking Chart Levels - Why Healthcare is the Strongest Sector - Stocks to Watch
by Arthur Hill,
Chief Technical Strategist, TrendInvestorPro.com
* Setting Benchmark Lows and Highs.
* Healthcare is the Clear Leader.
* Ranking Sectors with CandleGlance Charts.
* Other Performance Metrics for the 11 Sector SPDRs.
* SPY Range and MDY Resistance.
* XLF and XLI Break Out.
* Forget Fed Speak and Watch the Action.
* Stocks to Watch (ADI, COO, INTC, MDT, SYMC...).
... Setting Benchmark...
READ MORE
MEMBERS ONLY

DP Alert: Dovish Fed = Relief Rally + New PMO BUY Signal for SPX
by Erin Swenlin,
Vice President, DecisionPoint.com
In the midst of recording this morning's MarketWatchers LIVE show, the Fed Chairman Powell's remarks were released. They were dovish and the market rallied in relief. The rally was strong enough to pull the ST Price Momentum Oscillator (PMO) upward and trigger a new BUY signal....
READ MORE
MEMBERS ONLY

Varian Medical Successfully Tests Breakout Zone
by Arthur Hill,
Chief Technical Strategist, TrendInvestorPro.com
Healthcare stocks are leading the market and many were featured in Tuesday's show, On Trend. See below for details. Today I am highlighting Varian Medical (VAR) because it seems to be in the early stages of an uptrend.
Normally, I do not highlight stocks that trended lower for...
READ MORE
MEMBERS ONLY

STOCKS REBOUND ON DOVISH FED SPEECH -- RISKIER STOCKS LEAD WHILE SAFE HAVENS LAG -- DOW REGAINS 200-DAY LINE -- LOWER BOND YIELDS WEAKEN THE DOLLAR WHICH BOOSTS GOLD AND EMERGING MARKETS
by John Murphy,
Chief Technical Analyst, StockCharts.com
DOW REGAINS 200-DAY AVERAGE ... U.S. stock indexes reacted positively to today's noon speech by Fed chief Jerome Powell that was perceived to be more dovish than comments made at the start of October. Stocks all over the world are rallying as a result. Chart 1 shows the...
READ MORE
MEMBERS ONLY

The Trend Of Housing And NYSE Margin Debt Both Reverse To The Downside
by Martin Pring,
President, Pring Research
* Housing Starts are Rolling Over
* The Trend of Margin Debt is Bearish
The NYSE Margin and the housing sector do not have much in common beyond the fact that both gave sell signals in October. Neither development bodes well for the recovery of the stock market. Let’s take a...
READ MORE
MEMBERS ONLY
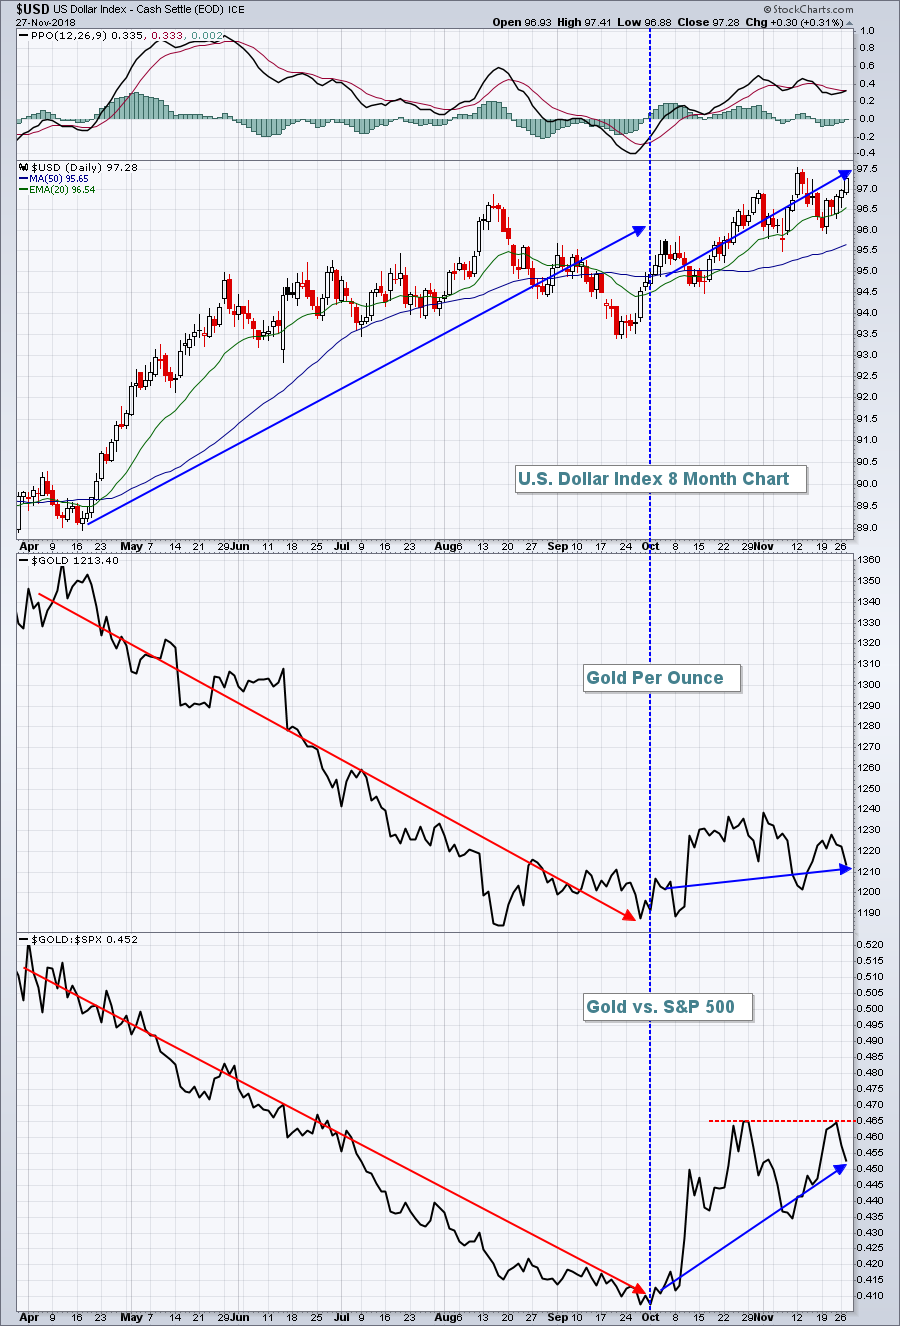
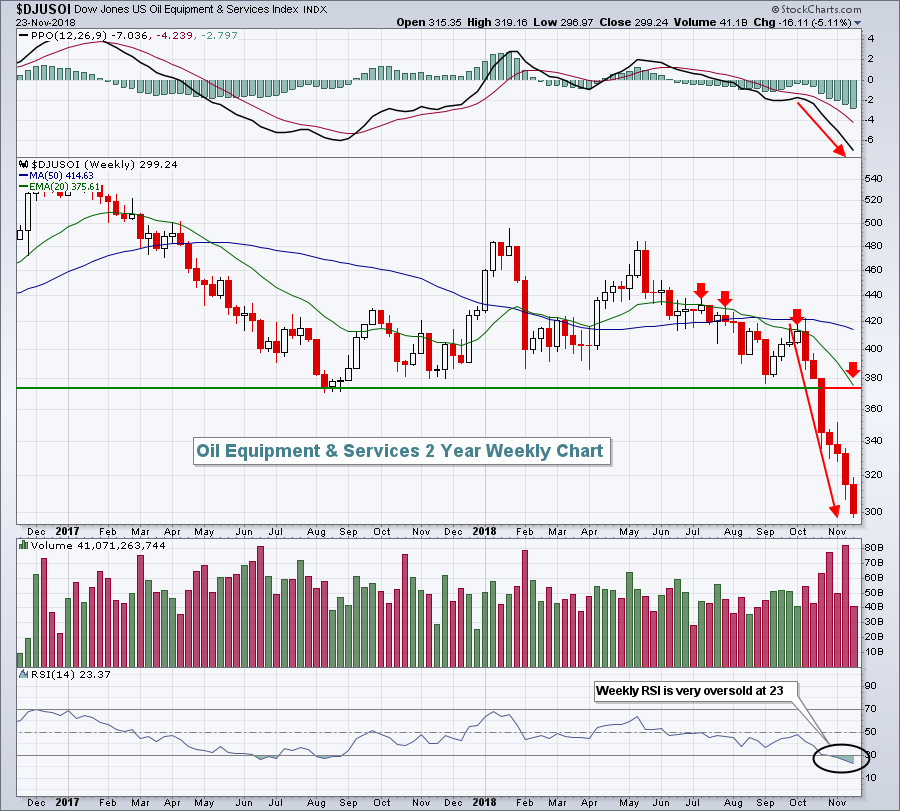
Here's What's Wrong With Commodities....And Are Renewable Energy Stocks Finally Bottoming?
by Tom Bowley,
Chief Market Strategist, EarningsBeats.com
Market Recap for Tuesday, November 27, 2018
One highlight from Tuesday's action is that the U.S. Dollar ($USD, +0.31%) remains in favor as it nears yet another breakout. This is important on a number of fronts, especially with respect to gold ($GOLD, -0.74%). There'...
READ MORE
MEMBERS ONLY
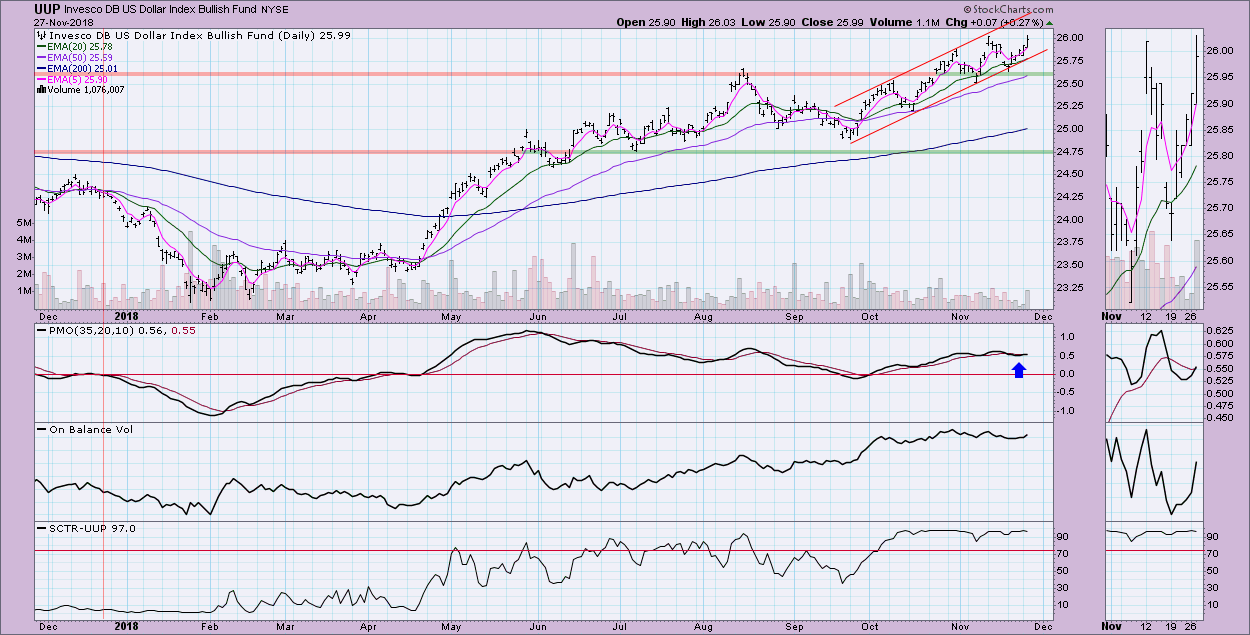
Rising Dollar Logs New PMO BUY Signal - IT Picture Bullish
by Erin Swenlin,
Vice President, DecisionPoint.com
The Dollar has been plugging along quietly in a gently rising trend channel, while the Price Momentum Oscillator (PMO) has moved right along with it. A little over a week ago, the PMO crossed below its signal line and logged a PMO SELL signal. Today's rally saw an...
READ MORE
MEMBERS ONLY
Seasonal Trends Are Not Seasonal Certainties

by David Keller,
President and Chief Strategist, Sierra Alpha Research
“We’re entering the seasonally strongest part of the year.”
“The New Year tends to be very good for small caps.”
“Year three of the Presidential Cycle tends to be good for stocks.”
“The Friday after Thanksgiving is usually a bullish day on lighter volume.”
How many of these quotes...
READ MORE
MEMBERS ONLY
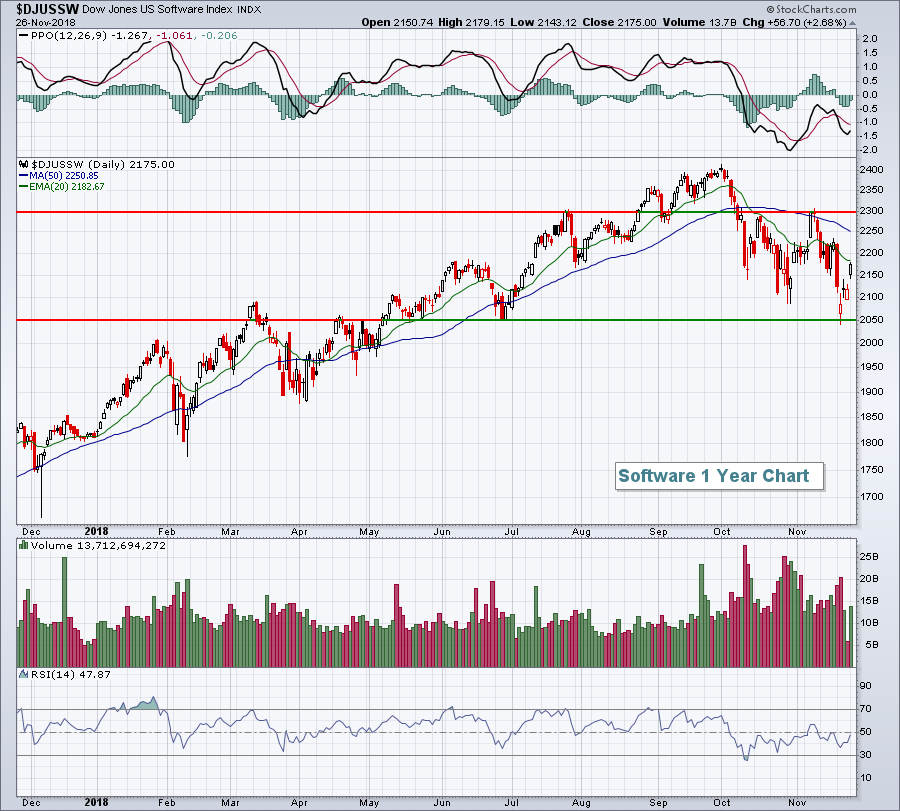
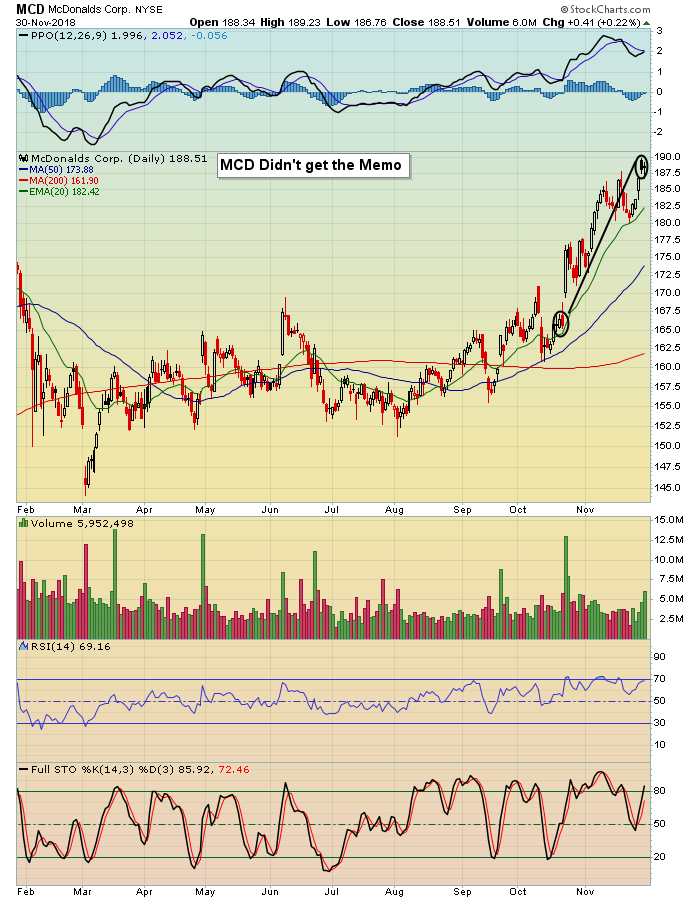
Home Construction Has Bottomed And Here's An Unrelated Stock To Bolster Your Holidays
by Tom Bowley,
Chief Market Strategist, EarningsBeats.com
Market Recap for Monday, November 26, 2018
Yesterday marked the first day in quite awhile where we saw all of our major indices higher, along with all of our sectors. All eleven sectors gained ground, even the defensive sectors - though they lagged badly on a relative basis. Leading the...
READ MORE
MEMBERS ONLY
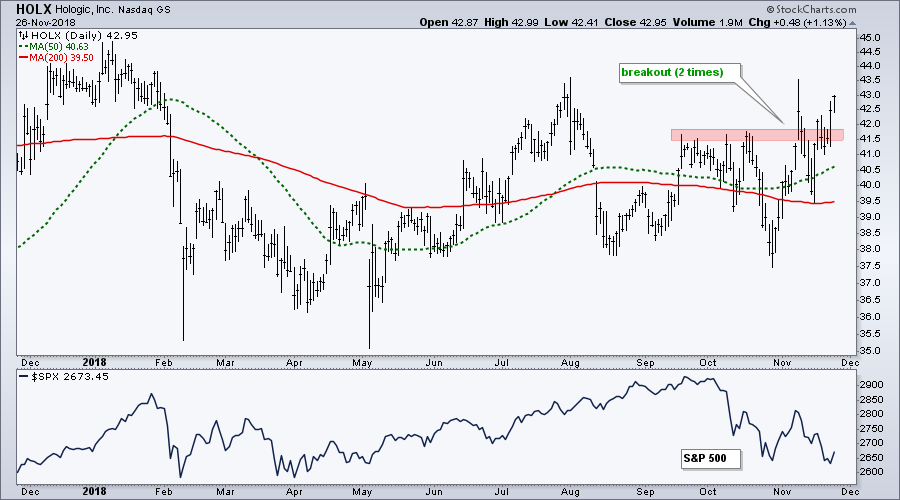
Hologic Doubles Down on Breakout
by Arthur Hill,
Chief Technical Strategist, TrendInvestorPro.com
While the S&P 500 toys with its October low, Hologic its flirting with its summer highs and showing strength over the last few months.
The chart below shows Hologic (HOLX), which his part of the Medical Devices ETF (IHI), with its 50-day SMA above the 200-day SMA and...
READ MORE
MEMBERS ONLY

STOCKS BOUNCE OFF LATE OCTOBER LOW -- THIS WOULD BE A LOGICAL SPOT FOR A SEASONAL RALLY ATTEMPT -- HOW FAR IT CARRIES WILL BE VERY IMPORTANT -- NASDAQ 100 QQQ IS ALSO OVERSOLD ON ITS DAILY CHART -- ITS WEEKLY CHART, HOWEVER, SHOWS LONGER RANGE DAMAGE
by John Murphy,
Chief Technical Analyst, StockCharts.com
S&P 500 REBOUNDS OFF LATE OCTOBER LOW... Stocks are off to a good start to the post Thanksgiving trading week. And they have at least three things working in their favor. One is the proximity to their late October low. The other is a short-term oversold condition. The...
READ MORE
MEMBERS ONLY
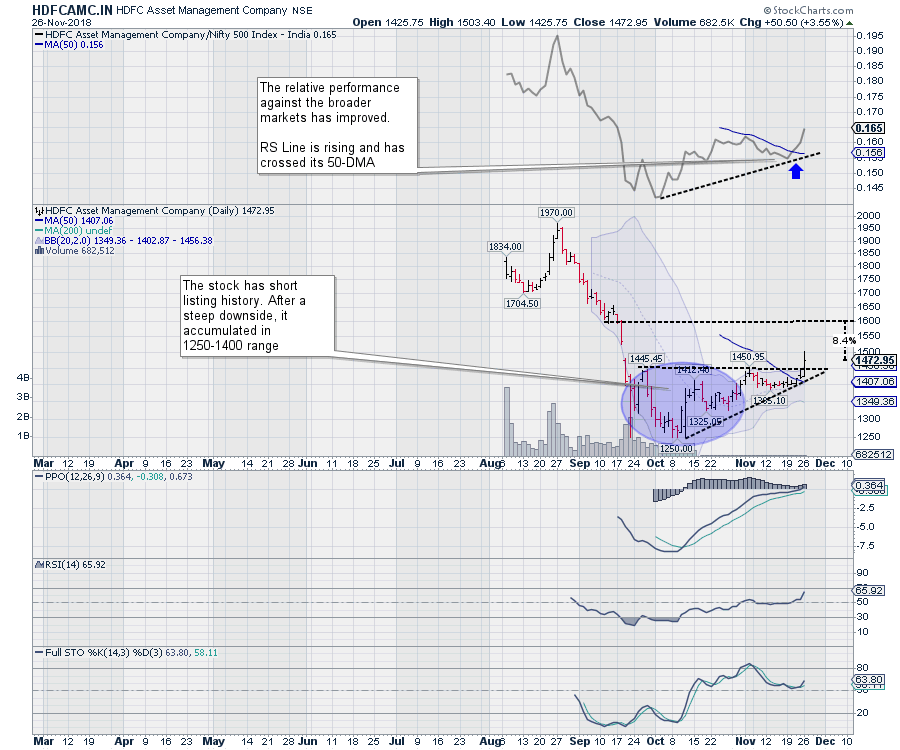
HDFC Asset Management and Adani Green Energy
by Milan Vaishnav,
Founder and Technical Analyst, EquityResearch.asia and ChartWizard.ae
As the broader and sector indexes continue to consolidate and remain in a broad range, it might be worthwhile to consider grabbing some opportunities outside the indexes. Scanning and looking for stock-specific opportunities is often very rewarding. Two stocks, both of which offer short term momentum and some possibilities of...
READ MORE
MEMBERS ONLY
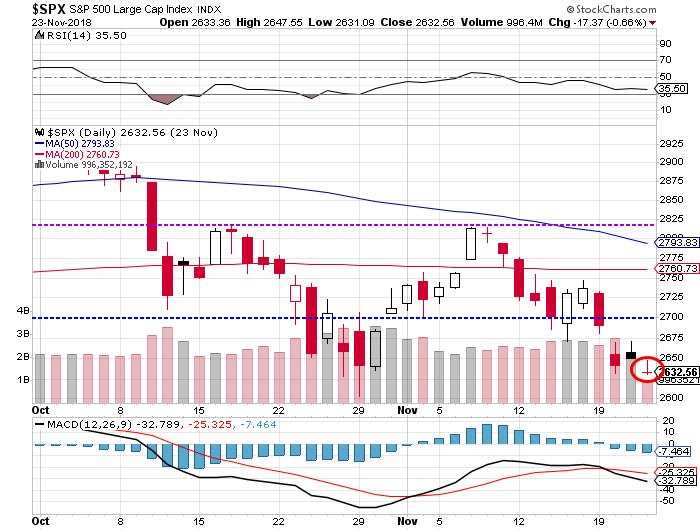
Bears Control The Action Despite Inability To Take Out Major Support
by Tom Bowley,
Chief Market Strategist, EarningsBeats.com
Market Recap for Friday, November 23, 2018
Friday's action was disappointing on a couple of different levels. First, the Friday morning attempt at a rally failed midday and sellers emerged into the close. It was somewhat similar to the action on Wednesday when the early morning gap higher...
READ MORE
MEMBERS ONLY

Semi. Campaign. Completion?
by Bruce Fraser,
Industry-leading "Wyckoffian"
As Wyckoffians we like to celebrate long holiday weekends by looking at Point and Figure charts. Allow me to contribute to your weekend chart stack with this case study on the semiconductor stocks (VanEck Vectors Semiconductors ETF will be our proxy). Semiconductor stocks have been important leadership during this long...
READ MORE
MEMBERS ONLY
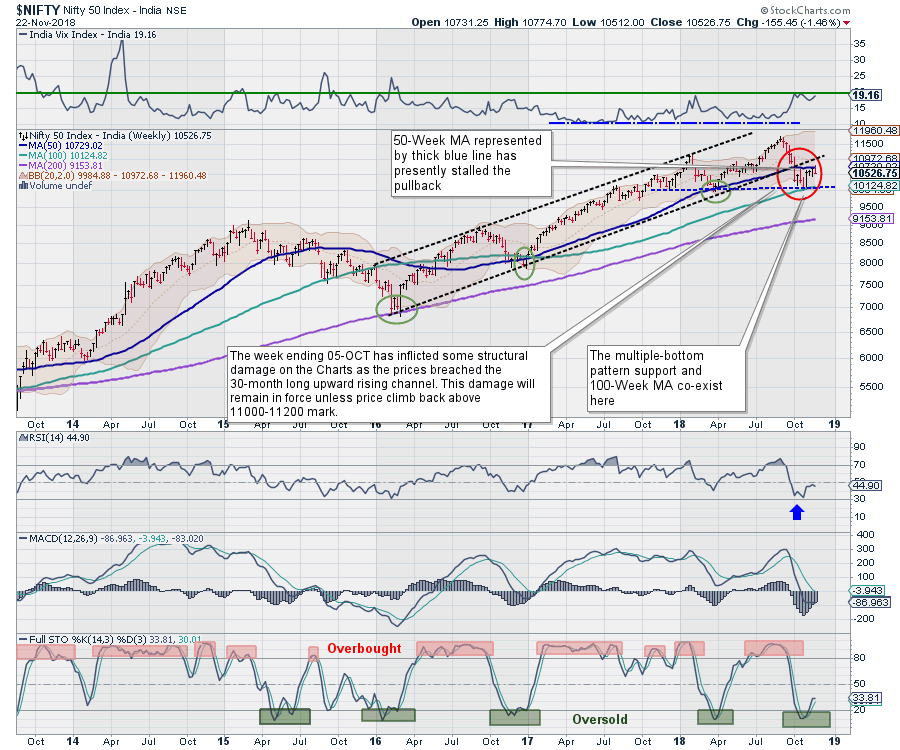
Expiry Week Ahead: NIFTY rules below 50-Week MA for seven weeks; up moves likely to remain capped
by Milan Vaishnav,
Founder and Technical Analyst, EquityResearch.asia and ChartWizard.ae
In this short trading week, the equities ended the week on a negative note. In a week that saw the Markets moving in the 250-points range, the NIFTY ended the week near its lowest point. The benchmark Index lost 155.45 points (-1.46%) on weekly basis.
It was for...
READ MORE