MEMBERS ONLY
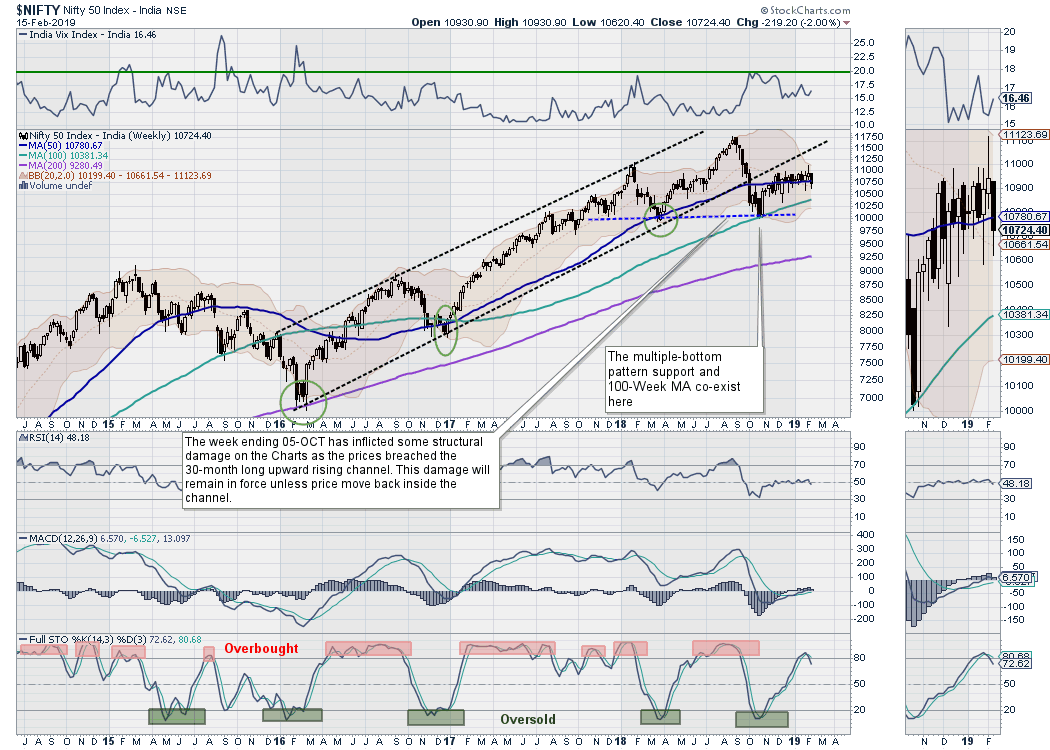
Week Ahead: Stable Start To The Week Expected; Cracks Might Appear If These Levels Are Not Defended

by Milan Vaishnav,
Founder and Technical Analyst, EquityResearch.asia and ChartWizard.ae
The past week remained quite dismal for the market, which ended in the negative on all five days. After a failed breakout on the daily charts, the NIFTY returned inside the broad trading range and subsequently drifted even lower. The index has been defending the 50-Week Moving Average for over...
READ MORE
MEMBERS ONLY
Here's How Relative Strength Will Help Your Trading Right Now

by Tom Bowley,
Chief Market Strategist, EarningsBeats.com
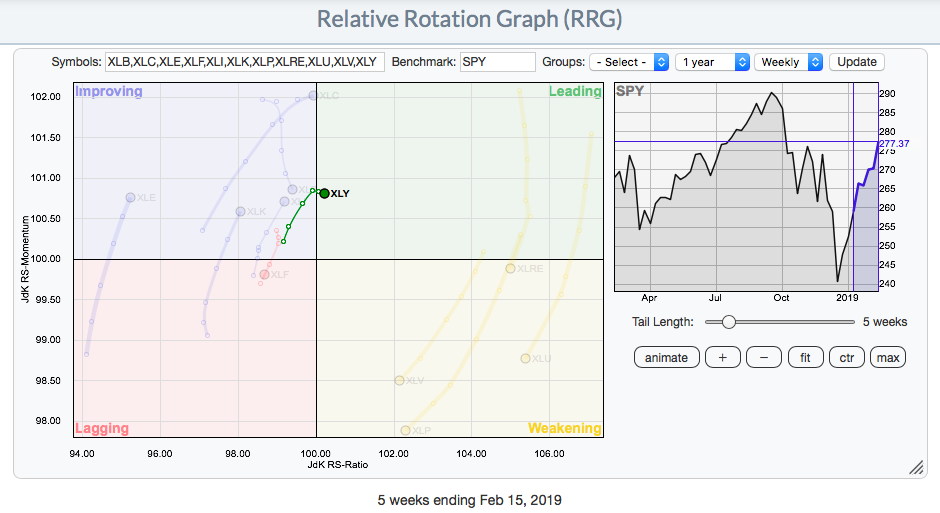
Understanding relative strength is extremely important in outperforming the benchmark S&P 500. As a sector begins to outperform, it tells us that money is rotating towards that particular sector. One way to visualize this is to look at an RRG chart. It will only take one glance to...
READ MORE
MEMBERS ONLY
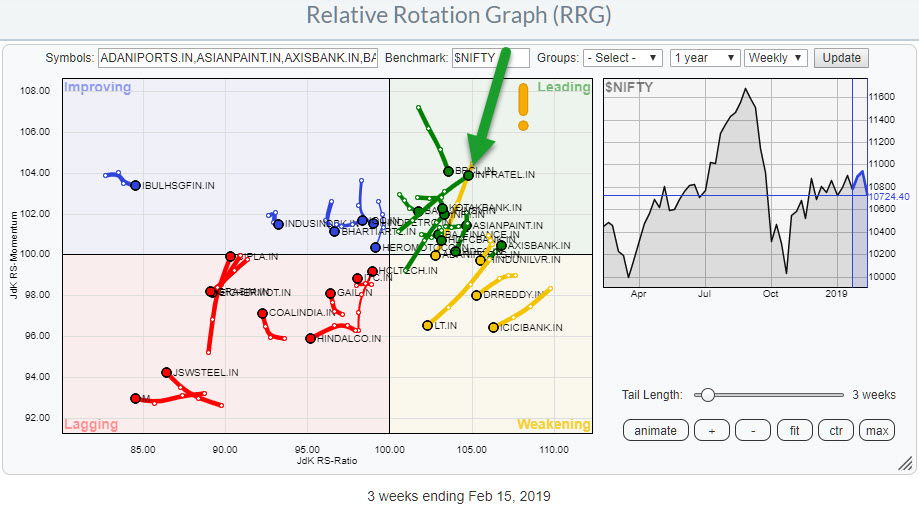
Checking The NIFTY 50 Universe On RRG Results In A Nice Setup For INFRATEL.IN

by Julius de Kempenaer,
Senior Technical Analyst, StockCharts.com
With more and more eyeballs looking at the Indian stock market and data for individual stocks and sectors becoming available on Stockcharts.com I started to keep an eye on developments in that market via Relative Rotation Graphs.
To make it easier (for you but also myself), the NIFTY 50...
READ MORE
MEMBERS ONLY
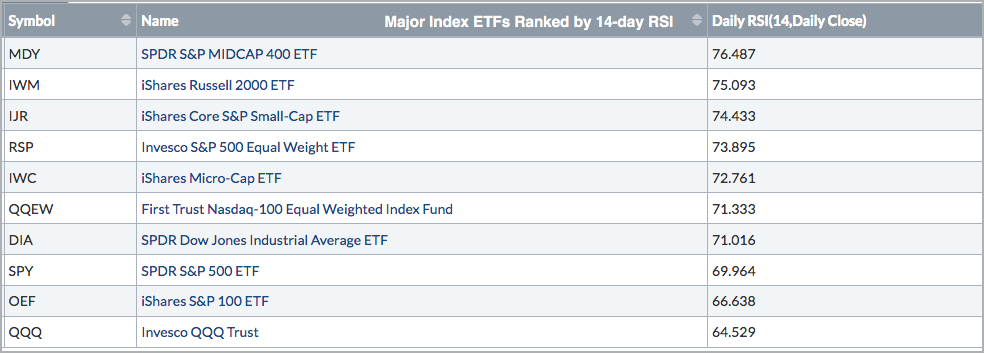
Small and Mid Caps Take the Momentum Lead

by Arthur Hill,
Chief Technical Strategist, TrendInvestorPro.com
The Relative Strength Index (RSI) is a momentum indicator that chartists can use to measure the strength behind a price move. Moreover, chartists can also use RSI values to rank momentum and find the leaders.
As an indicator that measures the magnitude of gains relative to the magnitude of losses,...
READ MORE
MEMBERS ONLY
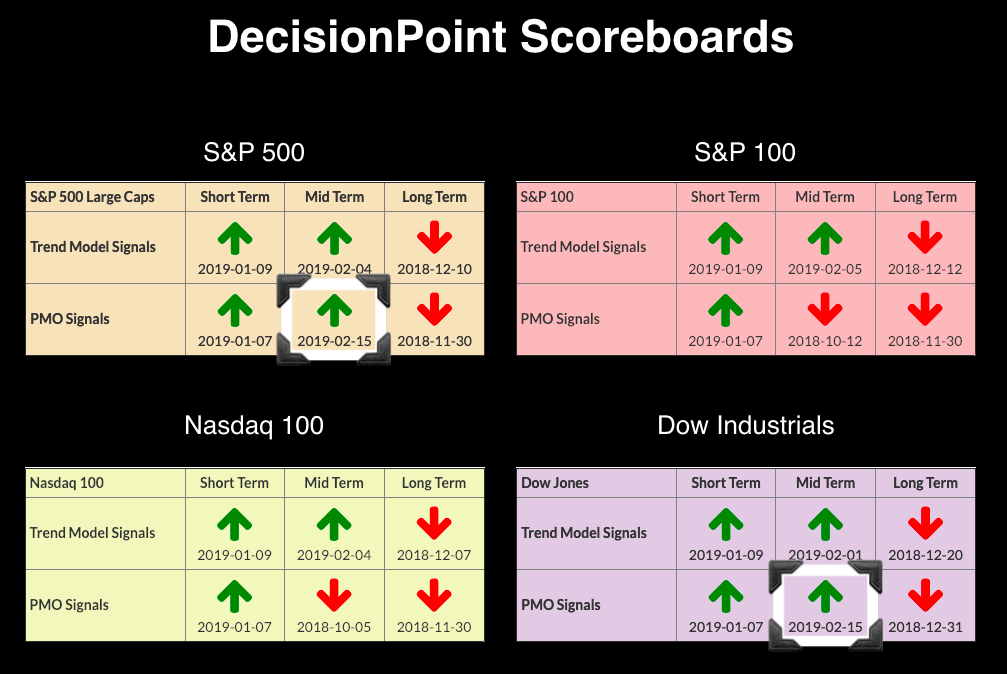
Dow and SPX Log New IT BUY Signals - Consumer Discretionary (XLY) LT BUY Signal

by Erin Swenlin,
Vice President, DecisionPoint.com
During today's DecisionPoint show on StockCharts TV (airing Fridays at 4:30p EST), Carl and I discussed how, while we're still bearish, there are signs of improvement. The main problem will be getting too overbought. Three signs of definite improvement are the two new IT Price...
READ MORE
MEMBERS ONLY
Nasdaq May Be the Third Major Stock Index to Cross Its Red Line

by John Murphy,
Chief Technical Analyst, StockCharts.com
Editor's Note: This article was originally published in John Murphy's Market Message on Friday, February 15th at 12:40pm ET.
Charts 1 and 2 show the Dow Industrials and S&P 500 building on their gains after rising above their 200-day averages (red lines). Both...
READ MORE
MEMBERS ONLY
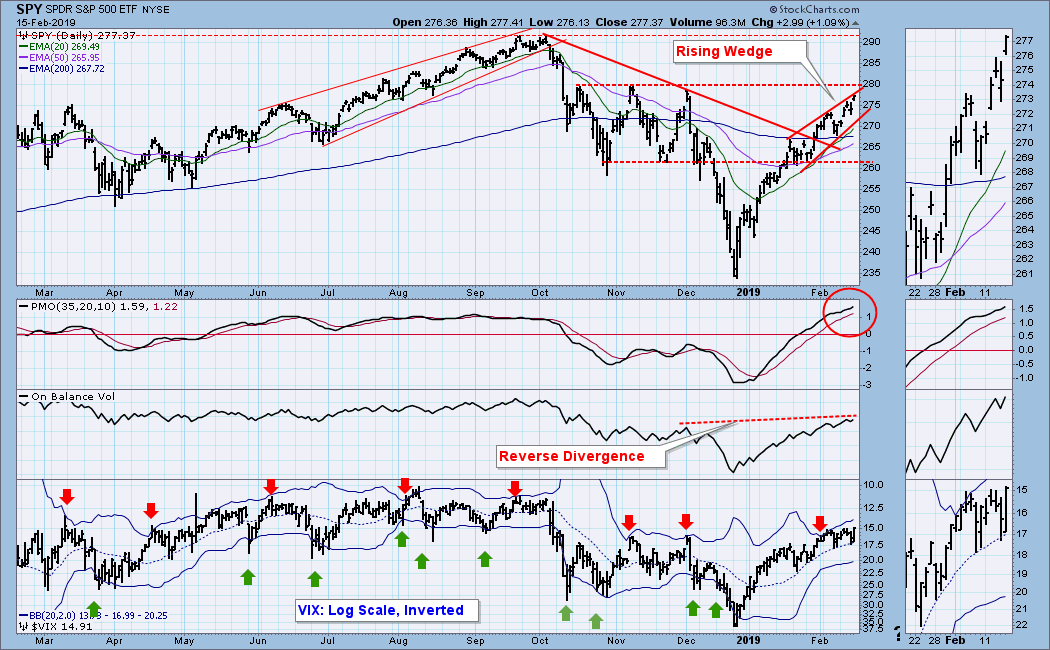
DP WEEKLY WRAP: Negative Signs Still Haven't Delivered

by Carl Swenlin,
President and Founder, DecisionPoint.com
There are some indicators that have been warning of a price top for a couple of weeks, but the market just keeps powering upward. (1) There is an OBV reverse divergence, where the OBV has exceeded its December top well ahead of price. This means that heavy volume hasn'...
READ MORE
MEMBERS ONLY

How To Get The Confidence To Profit From Bullish To Bearish Transitions By Recognizing The Evidence

by Gatis Roze,
Author, "Tensile Trading"
Life can be cruel if change happens and you miss the signs during the transition. I’ll offer up four examples with mild to toxic consequences: Weather, Science, Superstars and finally, the Stock Market.
Pretty much everyone is aware of the predictable and abrupt shift in the weather as the...
READ MORE
MEMBERS ONLY

MARKET RALLY CONTINUES AS NASDAQ TESTS ITS 200-DAY AVERAGE -- FINANCIALS LEAD TODAY'S GAINS -- DRUGS HELP BOOST HEALTHCARE SECTOR -- HOME DEPOT, UNITED TECHNOLOGIES, AND TRAVELERS ARE DOW LEADERS -- SEMICONDUCTORS SHOW NEW LEADERSHIP
by John Murphy,
Chief Technical Analyst, StockCharts.com
NASDAQ MAY BE THE THIRD MAJOR STOCK INDEX TO CROSS ITS RED LINE ... Charts 1 and 2 show the Dow Industrials and S&P 500 building on their gains after rising above their 200-day averages (red lines). Both now appear headed for a test of their early December peaks....
READ MORE
MEMBERS ONLY

Weekly Market Review & Outlook (w/Video) - S&P 500 Tilts Bullish
by Arthur Hill,
Chief Technical Strategist, TrendInvestorPro.com
* Reviewing the Weight of the Evidence
* New Highs Expand in XLK
* Sector Table is Net Bullish (XLK, XLV, XLI Lead)
* What If December-January Never Happened?
* Four Consolidations to Watch (XLF, IAI, XRT, IBB)
* New Additions to the ChartList
* AMD Keeps Flag Alive
* Finisar Holds Breakout
* Intuitive Surgical Breaks Pennant
* Walgreens-Boots...
READ MORE
MEMBERS ONLY
Turn Off CNBC And Turn On StockCharts TV
by Tom Bowley,
Chief Market Strategist, EarningsBeats.com
Market Recap for Thursday, February 14, 2019
Real estate (XLRE, +0.38%) and communications services (XLC, +0.37%) were the leaders yesterday as Wall Street staged a rally attempt after dealing with an early blow - a very weak December retail sales report. There's one thing everyone should...
READ MORE
MEMBERS ONLY

Gathering Evidence

by David Keller,
President and Chief Strategist, Sierra Alpha Research
Humans are emotional beings, generally making decisions based on their emotional state. Consequently, when the market moves against your positions, you will most likely have a visceral reaction to that event. The fear of losing and/or the fear of missing out are often the causes of bad investment decisions....
READ MORE
MEMBERS ONLY
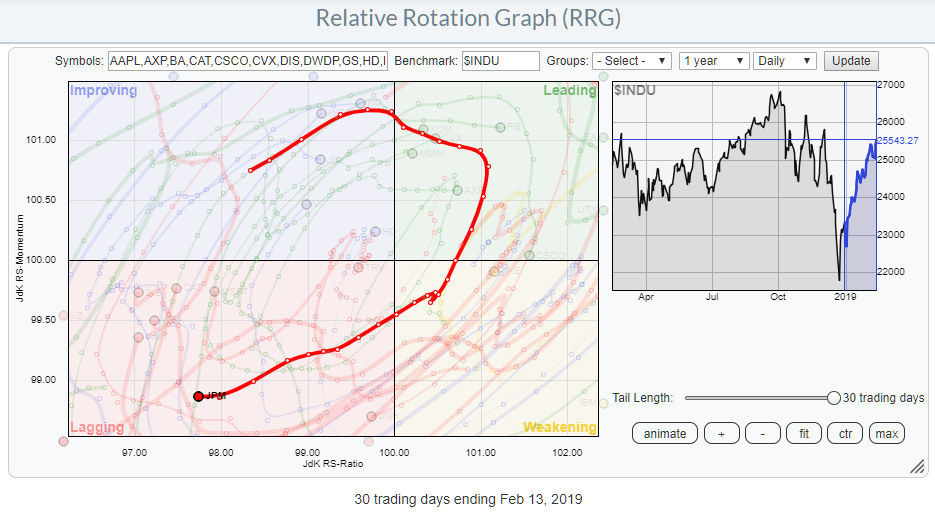
JP Morgan deteriorates further on Relative Rotation Graph
by Julius de Kempenaer,
Senior Technical Analyst, StockCharts.com
One of the choices in the drop-down selection on the Relative Rotation Graphs page is the DJ-industrials (Dow 30 Industrials). This RRG shows the rotation of all 30 Dow stocks against the $INDU.
The RRG above shows the daily rotation and highlights the rotation of JP Morgan Chase & Co....
READ MORE
MEMBERS ONLY

China Goes for a Breakout
by Arthur Hill,
Chief Technical Strategist, TrendInvestorPro.com
Chinese stocks came to life after their New Year's holiday with the Shanghai Composite ($SSEC) and some ETFs breaking double bottom resistance. Before looking at these charts, let's review the double bottom, which is a bullish reversal pattern. First and foremost, there must be a downtrend...
READ MORE
MEMBERS ONLY
For Now, Small Is Better
by Tom Bowley,
Chief Market Strategist, EarningsBeats.com
Market Recap for Wednesday, February 13, 2019
The stock market is beginning to exhibit a bit of the borishness that accompanies bull market advances. The Volatility Index ($VIX) remaining below 16 is confirming the reduced level of fear. There were certainly swings intraday yesterday, but the panicked, impulsive-type selling appears...
READ MORE
MEMBERS ONLY

DP Alert: Bearish Rising Wedge is Back on SPX
by Erin Swenlin,
Vice President, DecisionPoint.com
No changes to the DecisionPoint Scoreboards today. My concern now rests on the new bearish rising wedge that has appeared on the SPX chart. Not all of the indicators are confirming the recent rally. The newest change to the DecisionPoint Sector Scoreboard was an IT Trend Model BUY on the...
READ MORE
MEMBERS ONLY

THE S&P 500 JOINS THE DOW ABOVE ITS 200-DAY AVERAGE -- CONSUMER DISCRETIONARY AND INDUSTRIAL SPDRS HAVE CROSSED THEIR THEIR RED LINES -- THE XLI HAS ALSO CLEARED ITS DECEMBER HIGH -- RAILS ARE BOOSTING THE XLI -- NYSE AD LINES NEAR TEST OF 2018 HIGHS
by John Murphy,
Chief Technical Analyst, StockCharts.com
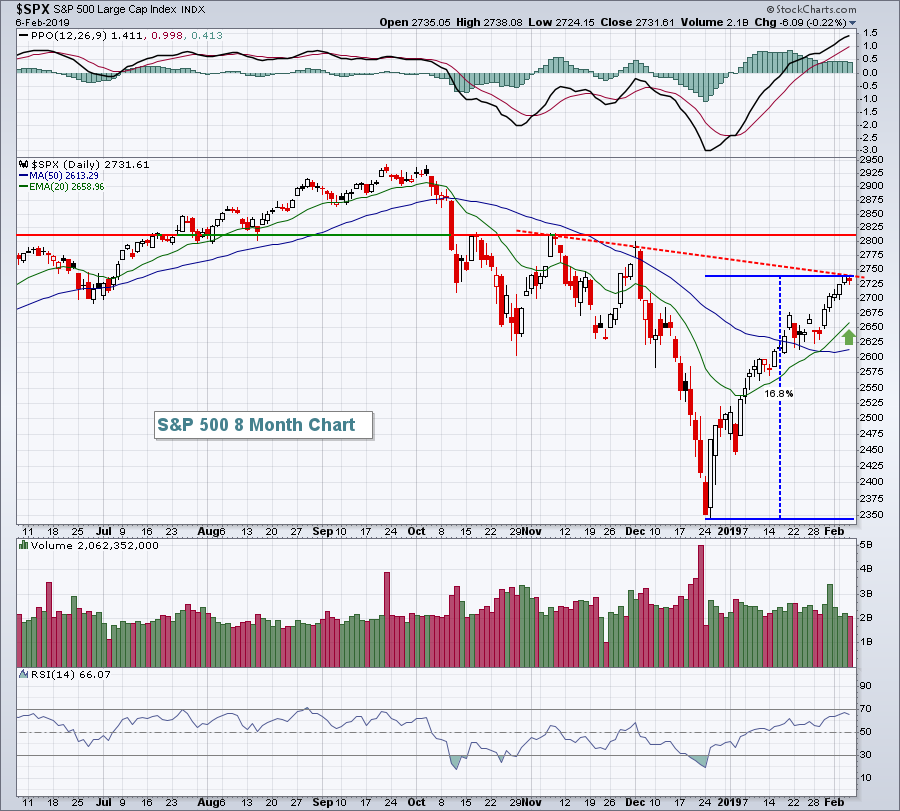
S&P 500 CROSSES ABOVE ITS 200-DAY AVERAGE... Up to last night, the Dow Industrials were the only major stock index to trade above their 200-day average. The S&P 500 closed marginally above its 200-day line yesterday. Chart 2 shows the SPX extending that gain over its...
READ MORE
MEMBERS ONLY
Finding Stocks To Achieve Your Goals
by Tom Bowley,
Chief Market Strategist, EarningsBeats.com
Market Recap for Tuesday, February 12, 2019
Another government shutdown was averted and the U.S. stock market reacted quite favorably, as you might expect, with all of our major indices surging higher. Our major indices had quite a day:
Dow Jones: +1.49%
S&P 500: +1.29%...
READ MORE
MEMBERS ONLY
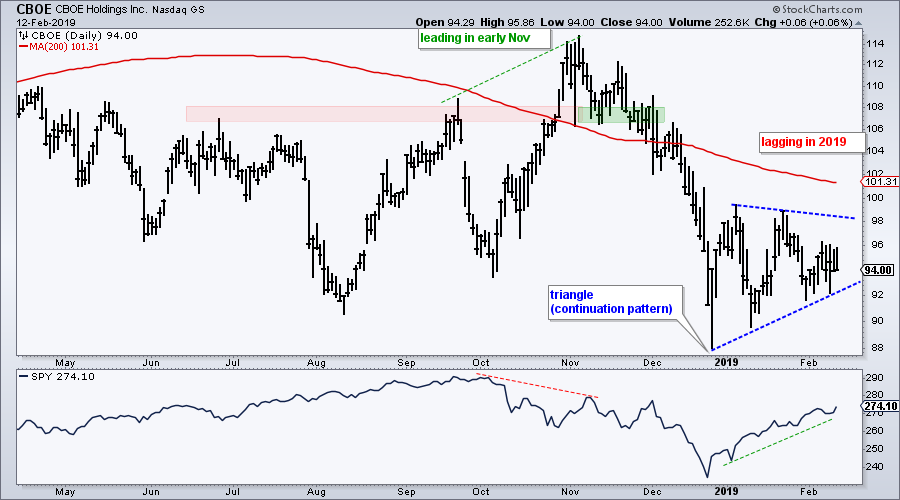
CBOE Holdings Fails to Bounce
by Arthur Hill,
Chief Technical Strategist, TrendInvestorPro.com
We are 29 trading days into 2019 and the S&P 500 is up a very respectable 9.49%. Furthermore, some 465 stocks in the S&P 500 are up year-to-date, which means 35 are down year-to-date. CBOE Holdings (CBOE) is one of these stocks (-3.91% year-to-date)...
READ MORE
MEMBERS ONLY
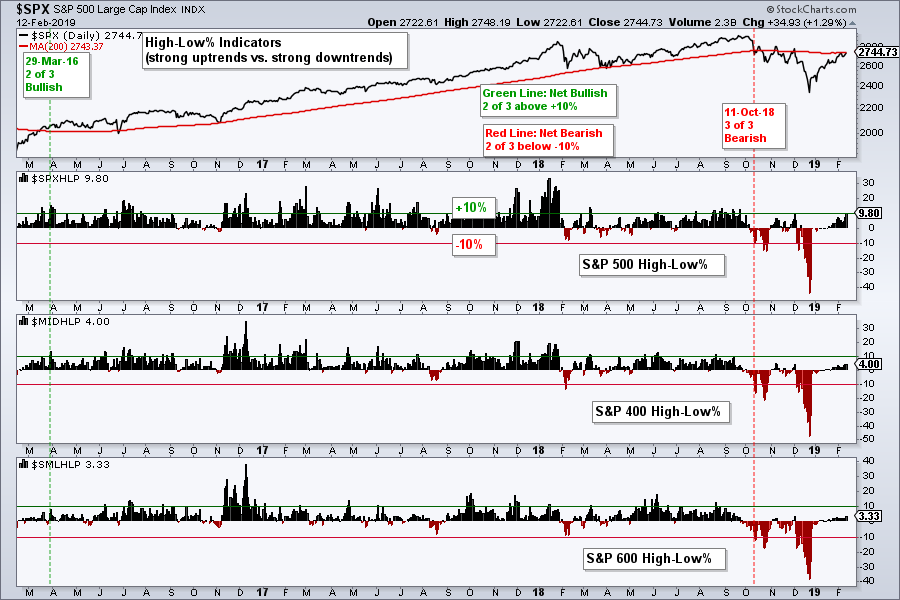
New Highs Expand - Plus Four Stocks
by Arthur Hill,
Chief Technical Strategist, TrendInvestorPro.com
* SPX High-Low Percent Nears Signal Flip.
* Intuitive Surgical Breaks Out.
* Walgreens-Boots Bounces off 200-day.
* Careful with AMD.
* RSI Improvements in Intel.
... Five of the nine breadth indicators are on bearish signals right now, but S&P 500 High-Low% ($SPXHLP) reached 9.8% on Tuesday and is close to triggering...
READ MORE
MEMBERS ONLY

Pair Analysis - 2

by Greg Morris,
Veteran Technical Analyst, Investor, and Author
To prove that I read all comments, here are some pair charts and data that is updated to 12/31/2018. First a review of what pair analysis is.
My pair analysis is accomplished on weekly data. Think of the ratio line like this: when it is moving upward it...
READ MORE
MEMBERS ONLY
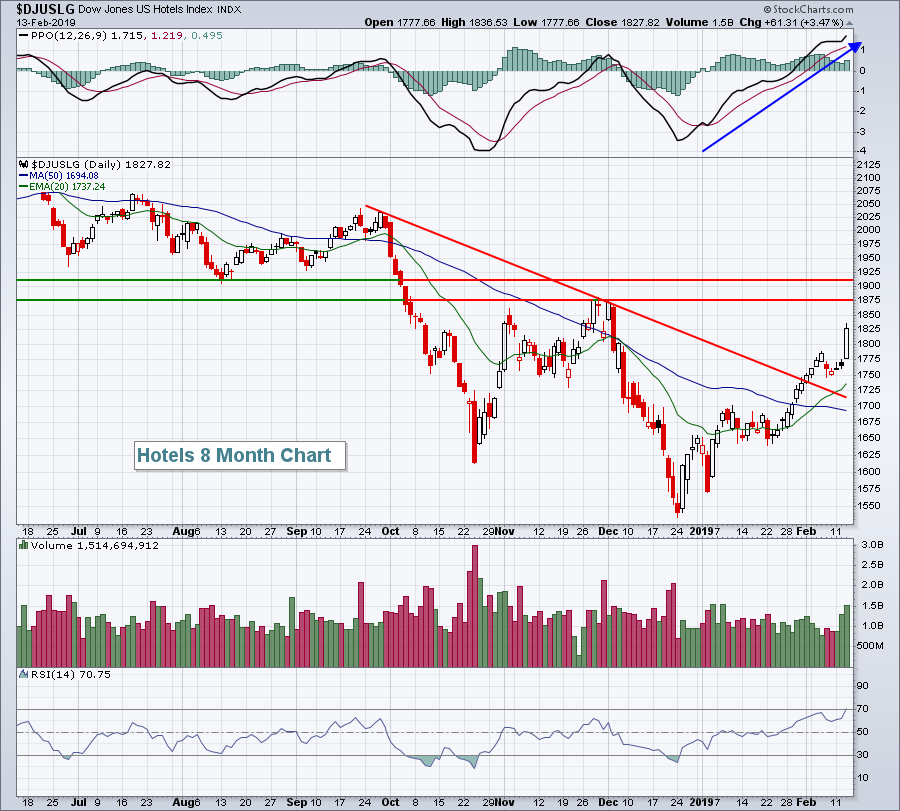
Time To Place Your Spring Hotel Reservation?
by Tom Bowley,
Chief Market Strategist, EarningsBeats.com
Market Recap for Monday, February 11, 2019
Industrials (XLI, +0.53%), energy (XLE, +0.48%) and financials (XLF, +0.31%) were Monday's leaders as bifurcated action was once again present. The clear index leader was the small cap Russell 2000 index (+0.84%) and that's become...
READ MORE
MEMBERS ONLY
Dollar Index On The Verge Of A Breakout?

by Martin Pring,
President, Pring Research
* Dollar About to Break New Ground?
* Euro Starting to Break Down
* Swiss Franc at a Major Juncture Point
* The Fortunes of the Canadian, Australian and EM Currencies are Tied to Commodities
Dollar About to Break New Ground?
I last wrote about the dollar at the end of January, pointing out...
READ MORE
MEMBERS ONLY

WDAY Works Out

by Bruce Fraser,
Industry-leading "Wyckoffian"
In a September 2017 blog, we studied Workday, Inc. (WDAY). We looked at WDAY as an emerging ‘Campaign Stock’. These stocks have characteristics that could propel their uptrends for years to come. The Wyckoff Method offers the tools to identify these candidates. Chief among them is structural chart analysis and...
READ MORE
MEMBERS ONLY

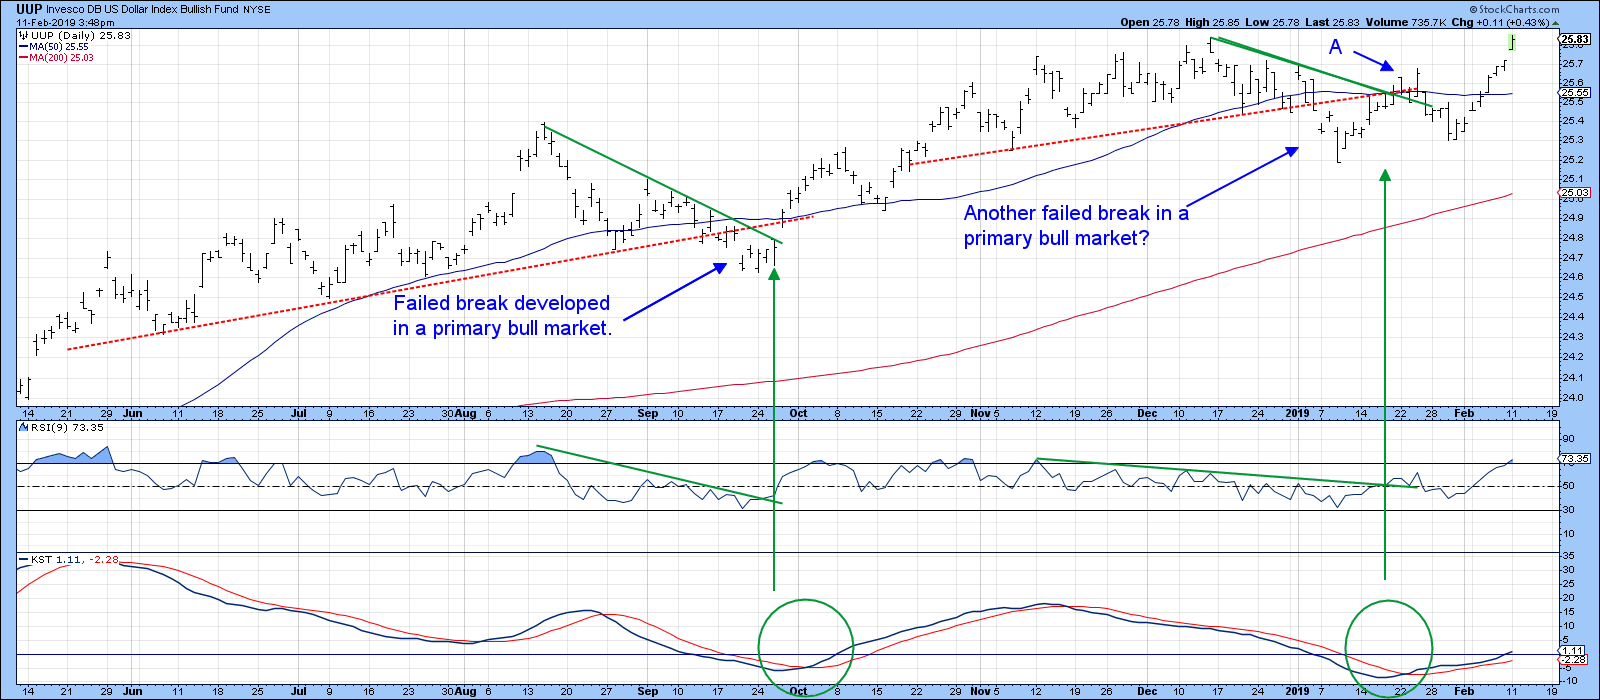
DOLLAR INDEX MAY BE NEARING AN UPSIDE BREAKOUT -- SEVERAL FOREIGN CURRENCIES HAVE FAILED TESTS OF 200-DAY AVERAGES -- THE EURO MAY RETEST NOVEMBER LOW -- THE RISING DOLLAR WEAKENS COMMODITY PRICES -- ESPECIALLY BASE METALS AND ENERGY
by John Murphy,
Chief Technical Analyst, StockCharts.com
DOLLAR INDEX NEARS NEW HIGH... The recent upturn in the dollar is continuing today. The daily bars in Chart 1 show the Invesco U.S. Dollar Index Fund (UUP) jumping to the highest level in two months and nearing a challenge of its December high. A close above that chart...
READ MORE
MEMBERS ONLY
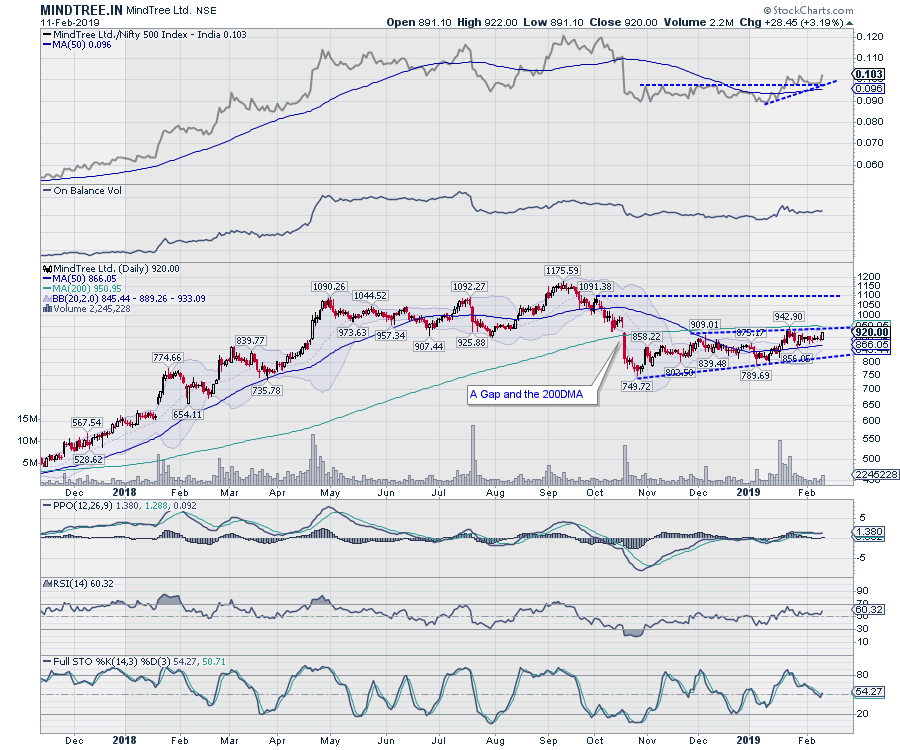
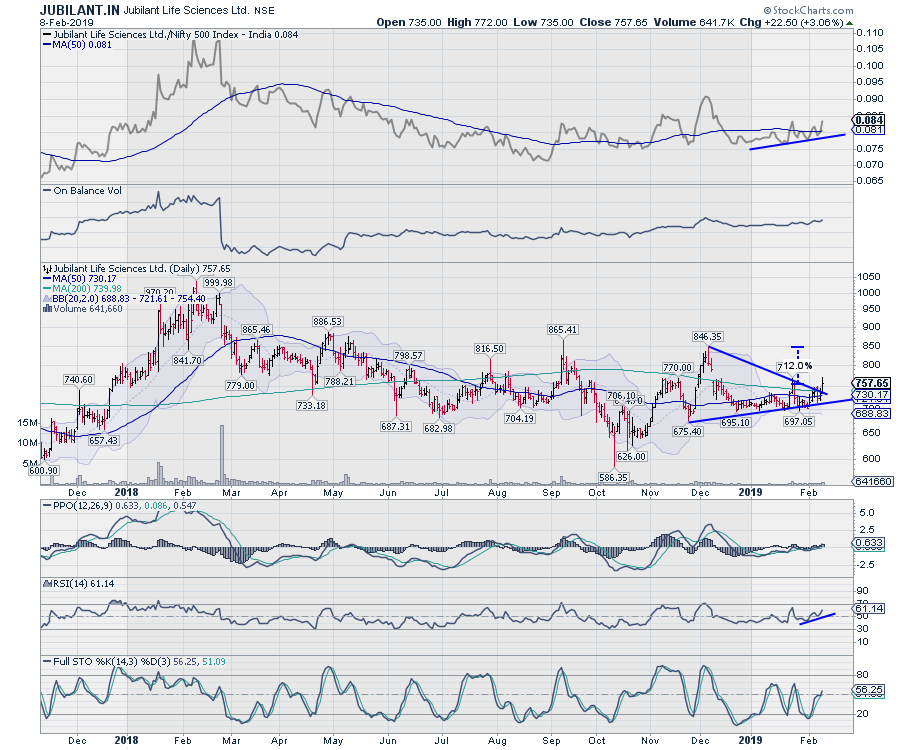
MINDTREE.IN: Good Up-Move In The Offing If This Level Is Crossed
by Milan Vaishnav,
Founder and Technical Analyst, EquityResearch.asia and ChartWizard.ae
While the markets have been suffering from fractured breadth and the NIFTY moved below 10950 (its breakout level) following a strong throwback, the CNXIT index has crawled back into the leading quadrant of the Relative Rotation Graph (RRG). This means that the IT pack is likely to relatively out-perform the...
READ MORE
MEMBERS ONLY
Bank Of America Looks Like A Winner
by Tom Bowley,
Chief Market Strategist, EarningsBeats.com
Market Recap for Friday, February 8, 2019
Friday was a solid day for the bulls. It wasn't because we saw large gains, because we didn't. In fact, it was bifurcated action where the S&P 500, NASDAQ and Russell 2000 barely closed higher with gains...
READ MORE
MEMBERS ONLY
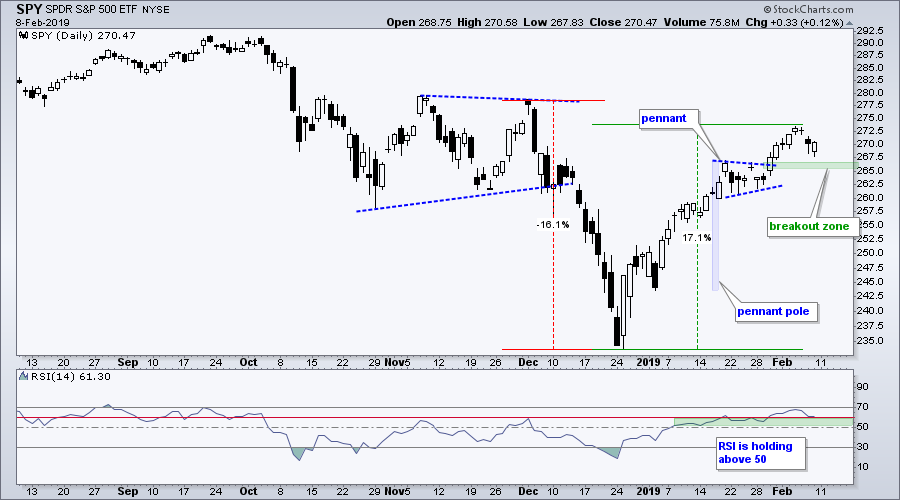
Pennant Breakouts Remain in Play for SPY and QQQ - Six Stocks Consolidating above their 200-day SMAs
by Arthur Hill,
Chief Technical Strategist, TrendInvestorPro.com
... The stock market took a rest last week as the S&P 500 stalled in the 2708 area, which is just below the 200-day SMA. Note that the S&P 500 rose 24 of the last 31 days and gained around 15% in six weeks. It still looks...
READ MORE
MEMBERS ONLY
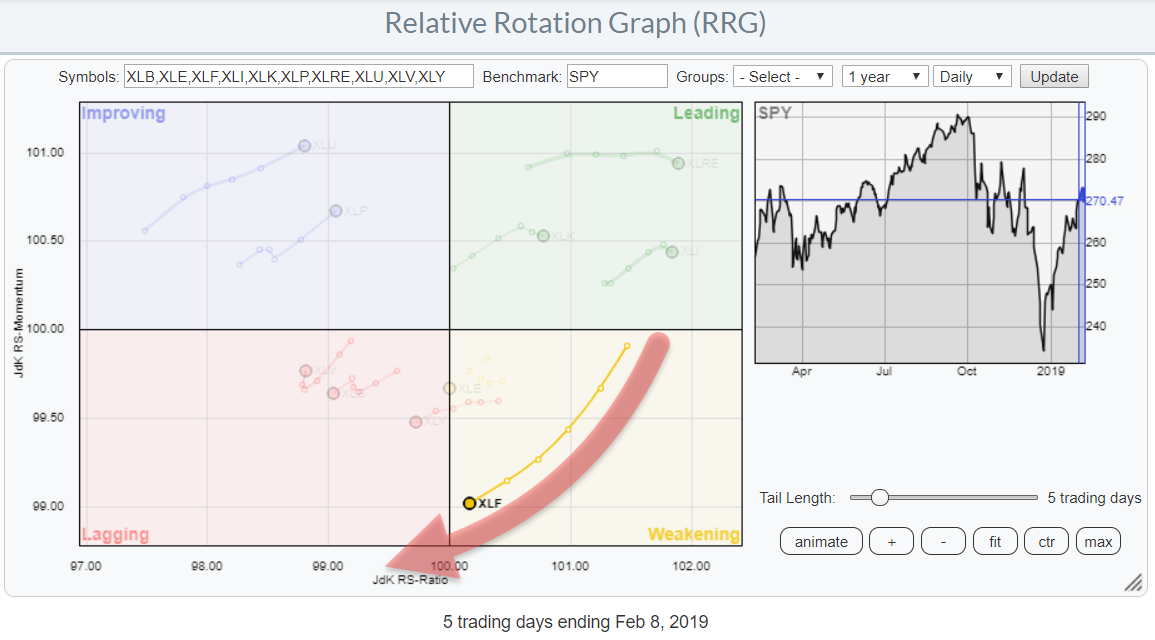
Watch Out For More Weakness In Financials This Week!
by Julius de Kempenaer,
Senior Technical Analyst, StockCharts.com
On the daily Relative Rotation Graph for US sectors, the rotation of Financials stands out. The tail is relatively long, indicating that there is good momentum behind this move,
The bad news is that the rotation is taking place inside the weakening quadrant and has almost reached the lagging quadrant....
READ MORE
MEMBERS ONLY
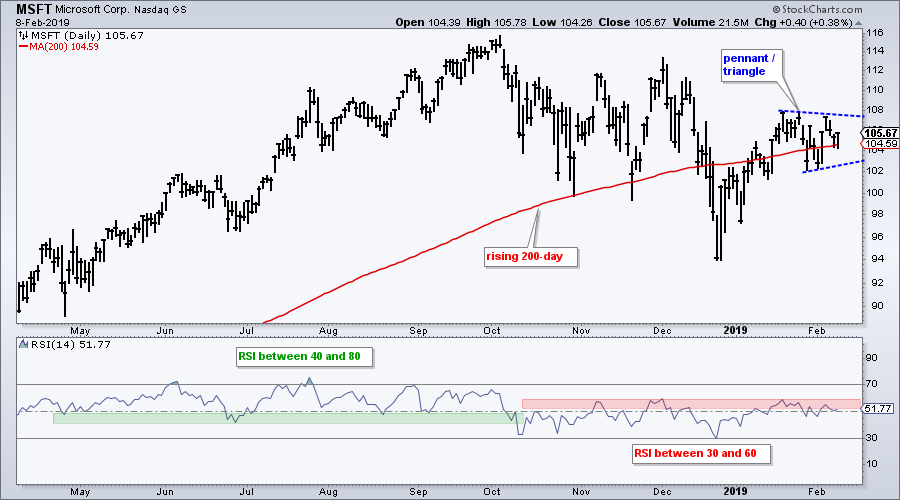
Microsoft Bids for a Momentum Shift
by Arthur Hill,
Chief Technical Strategist, TrendInvestorPro.com
Microsoft is battling the rising 200-day moving average and making a bid to shift momentum back to the bulls.
The chart shows MSFT falling along with the market from October to December and then rebounding sharply in January. The stock is currently consolidating around the 200-day SMA with a pennant,...
READ MORE
MEMBERS ONLY
This Stock May Out-Perform The Broader Markets
by Milan Vaishnav,
Founder and Technical Analyst, EquityResearch.asia and ChartWizard.ae
The Indian market suffered a severe throwback, having broken out above the 10950 mark on Wednesday but returning all those gains by end of the week. The market breadth has not been healthy at all and remains a matter of concern. Amid such turbulence, this stock deserves some attention, as...
READ MORE
MEMBERS ONLY
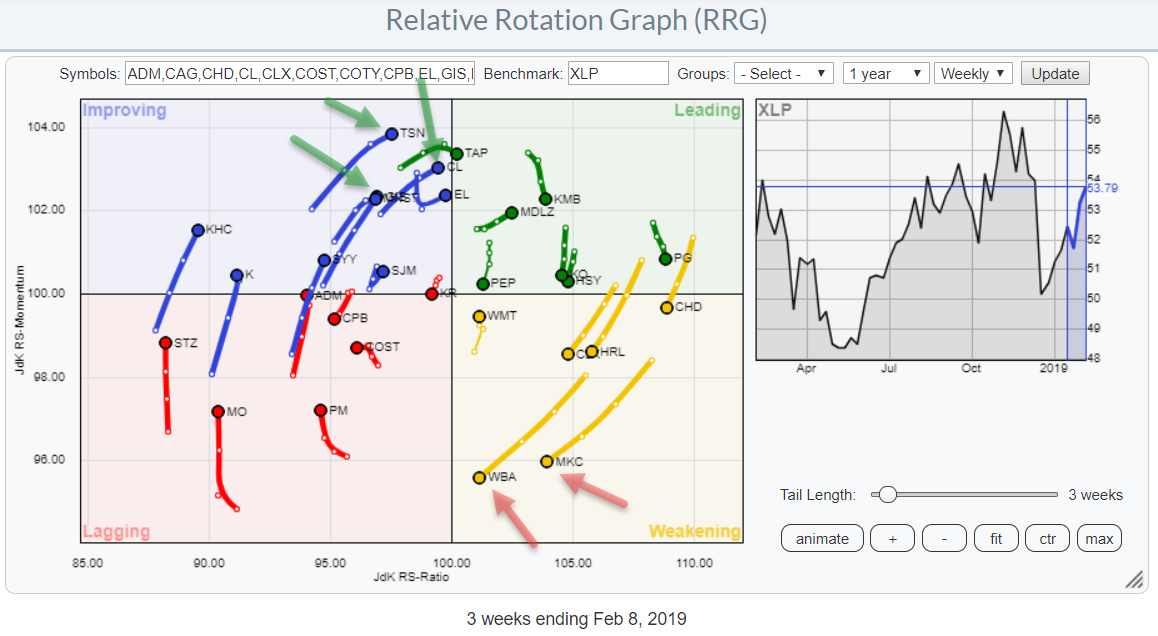
The Staples Sector Is Improving, But Which Stocks Deserve Attention?
by Julius de Kempenaer,
Senior Technical Analyst, StockCharts.com
The Relative Rotation Graph shows the rotation of the stocks in the Consumer Staples sector against XLP, the Consumer Staples sector index.
Keen observers may notice that I have left out COTY and CAG because they are very disconnected and distorting the picture. If you click on the image and...
READ MORE
MEMBERS ONLY
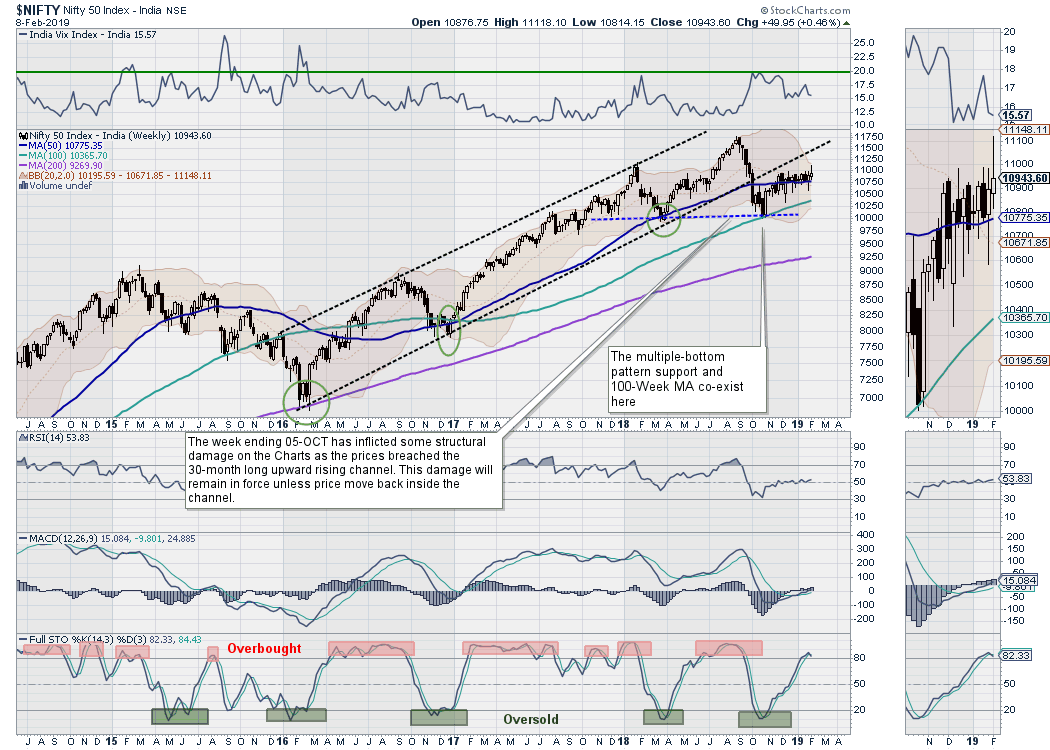
Week Ahead: Staying Afloat 50-Week MA Crucial; Market Breadth Remains A Concern
by Milan Vaishnav,
Founder and Technical Analyst, EquityResearch.asia and ChartWizard.ae
With the last day of the trading week remaining a drag, the NIFTY returned all its weekly gains and ended on a negative note. If we look at the daily charts, we can see the NIFTY achieved a breakout by moving past the 10950 level, but had returned all those...
READ MORE
MEMBERS ONLY
DP WEEKLY WRAP: The Pleasure/Pain Cycle
by Carl Swenlin,
President and Founder, DecisionPoint.com
I have a theory about the market that I'm thinking of tuning up for submission to the Nobel Prize committee. It goes like this: (1) Things get better and better until they are as good as they are going get. (2) Then they get worse and worse until...
READ MORE
MEMBERS ONLY

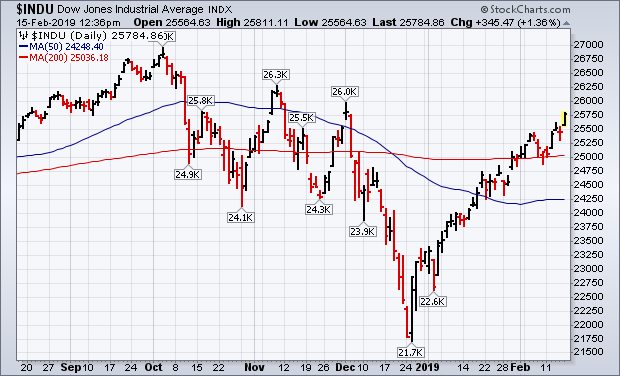
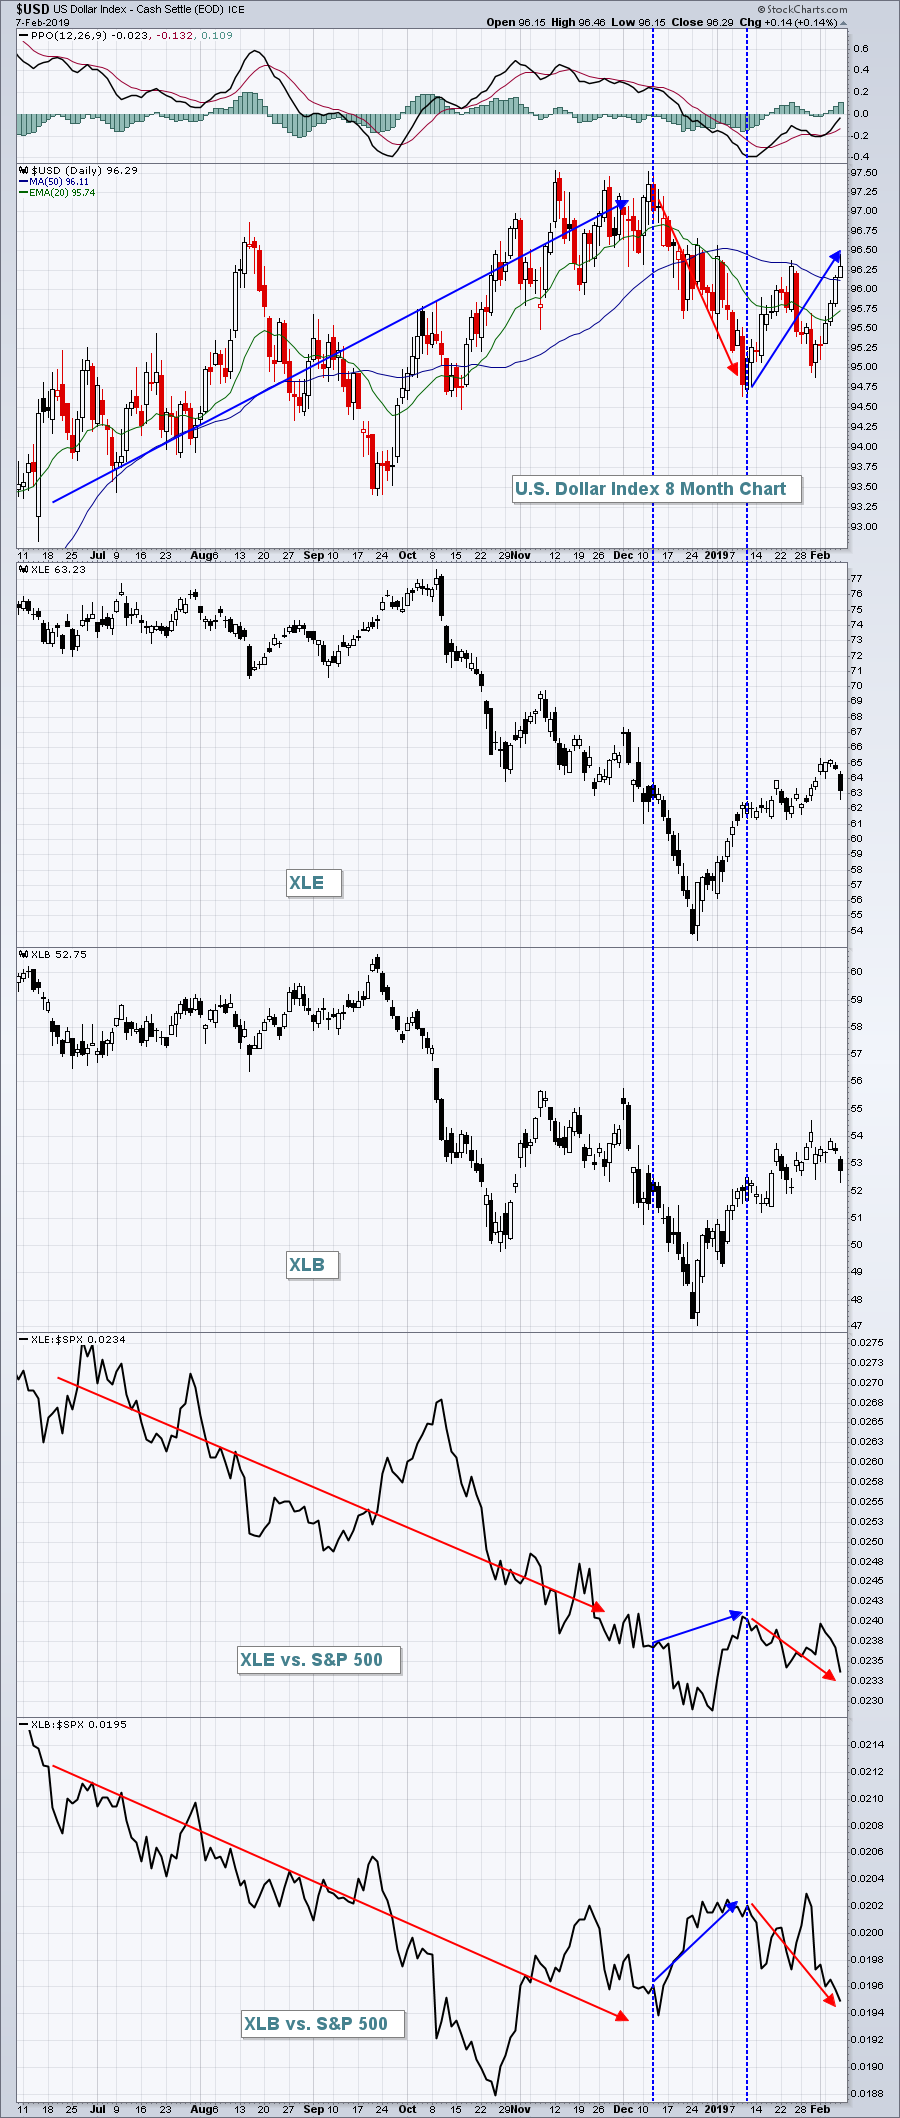
STOCK INDEXES ARE FAILING TEST OF 200-DAY MOVING AVERAGES -- THE DOW MAY ALSO SLIP BACK BELOW ITS RED LINE -- FALLING BOND YIELDS ARE BOOSTING UTILITIES AND OTHER DEFENSIVE SECTORS -- WHILE A RISING DOLLAR IS HURTING ENERGY AND MATERIAL STOCKS
by John Murphy,
Chief Technical Analyst, StockCharts.com
200-DAY MOVING AVERAGES CONTAIN THE RECENT RALLY... With stocks losing ground over the past two days, it looks like the 200-day averages that we've all been watching have managed to contain the 2019 rally. Chart 1 shows the S&P 500 pulling back from that red overhead...
READ MORE
MEMBERS ONLY

Weekly Market Review & Outlook (with Video) - When to Tread Carefully
by Arthur Hill,
Chief Technical Strategist, TrendInvestorPro.com
* Breadth Indicators Fall Short.
* S&P 500 Backs off the 40 Week.
* When to Tread Carefully.
* Offensive Sectors Weigh.
* Sector with Lowest Correlation to $SPX.
* Utes Lead the Market.
* Bond ETFs Consolidate within Uptrends.
* ChartList Notes, Additions and Deletions.
... Breadth Indicators Fall Short
... The advance from late December to...
READ MORE
MEMBERS ONLY
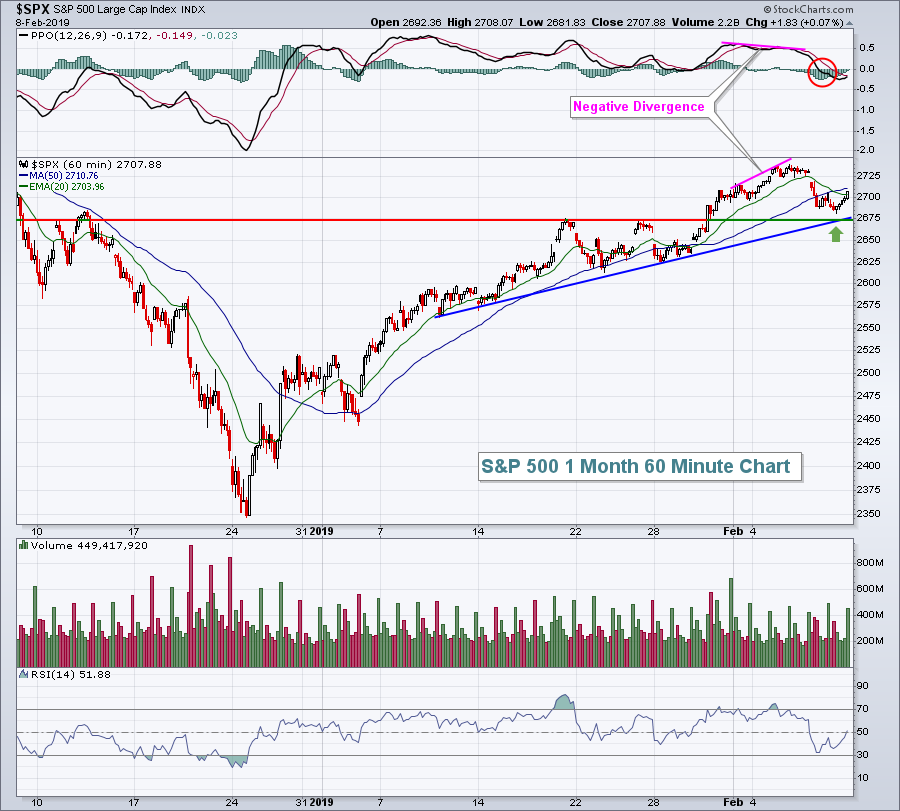
Negative Divergences Stymie Advance
by Tom Bowley,
Chief Market Strategist, EarningsBeats.com
Market Recap for Thursday, February 7, 2019
The bears have been waiting for a day like yesterday, which featured a bit of impulsive selling and an accelerating Volatility Index ($VIX). Unfortunately, the bulls may have already inflicted too much damage upon the bears for them to recover fully. I view...
READ MORE
MEMBERS ONLY
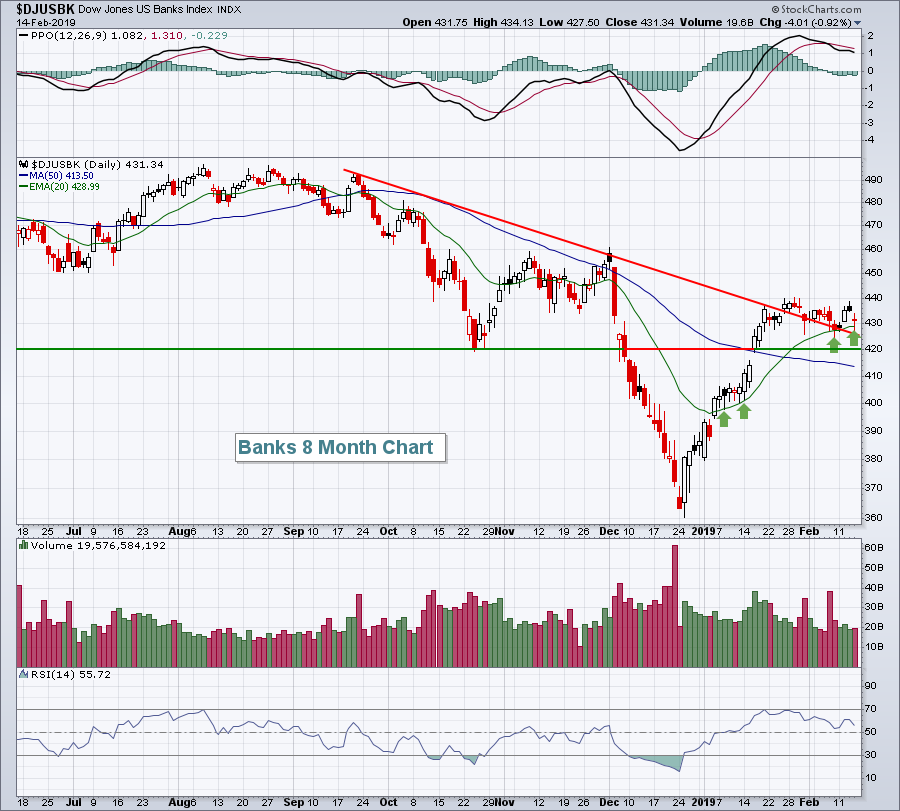
Finance Sector Hits Moment-of-truth - Chart, Scan and Analyze the Bollinger Band Squeeze
by Arthur Hill,
Chief Technical Strategist, TrendInvestorPro.com
* XLF Goes from Leader to Laggard.
* XLF Hits Resistance and Retracement.
* Bollinger Band Squeeze Chart.
* Bollinger Band Squeeze Scan Code.
* On Trend on StockChartsTV
...XLF Goes from Leader to Laggard
...The Financials SPDR (XLF) went from leader to laggard over the last six weeks as the broad market advance narrowed....
READ MORE
MEMBERS ONLY
Restaurants Remain A Fan Favorite
by Tom Bowley,
Chief Market Strategist, EarningsBeats.com
Market Recap for Wednesday, February 6, 2019
All of our major indices closed lower on Wednesday and we haven't seen that very often in 2019. The losses were minimal and traders continued to have an appetite for the riskier sectors, so it certainly wasn't a huge...
READ MORE
MEMBERS ONLY
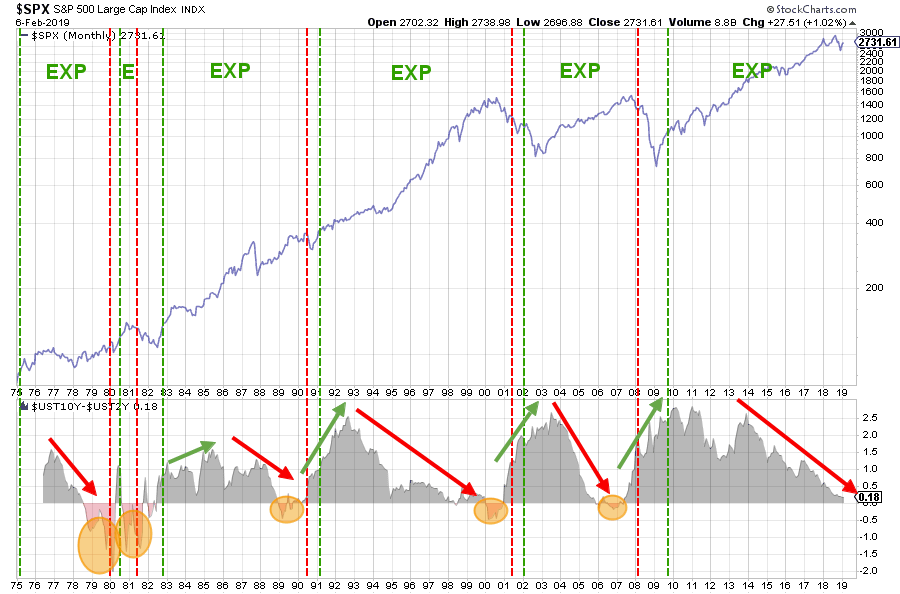
Save This Chart To Keep Track Of The Yield Curve Interaction With The Economic Cycle
by Julius de Kempenaer,
Senior Technical Analyst, StockCharts.com
The chart that I want to share with you today is part of a (bigger) research project that I am doing with regard to the various phases in economic cycles and their relation to the (shape of) yield curve.
The chart above shows the S&P Index in the...
READ MORE