MEMBERS ONLY

Last Week’s Market Action Showed Signs of Exhaustion, Especially In This One Key Stock

by Martin Pring,
President, Pring Research
Explore how recent bearish weekly patterns in the S&P 500, Nasdaq, and Microsoft could signal an intermediate-term trend reversal. Learn why confirmation is key in technical analysis....
READ MORE
MEMBERS ONLY
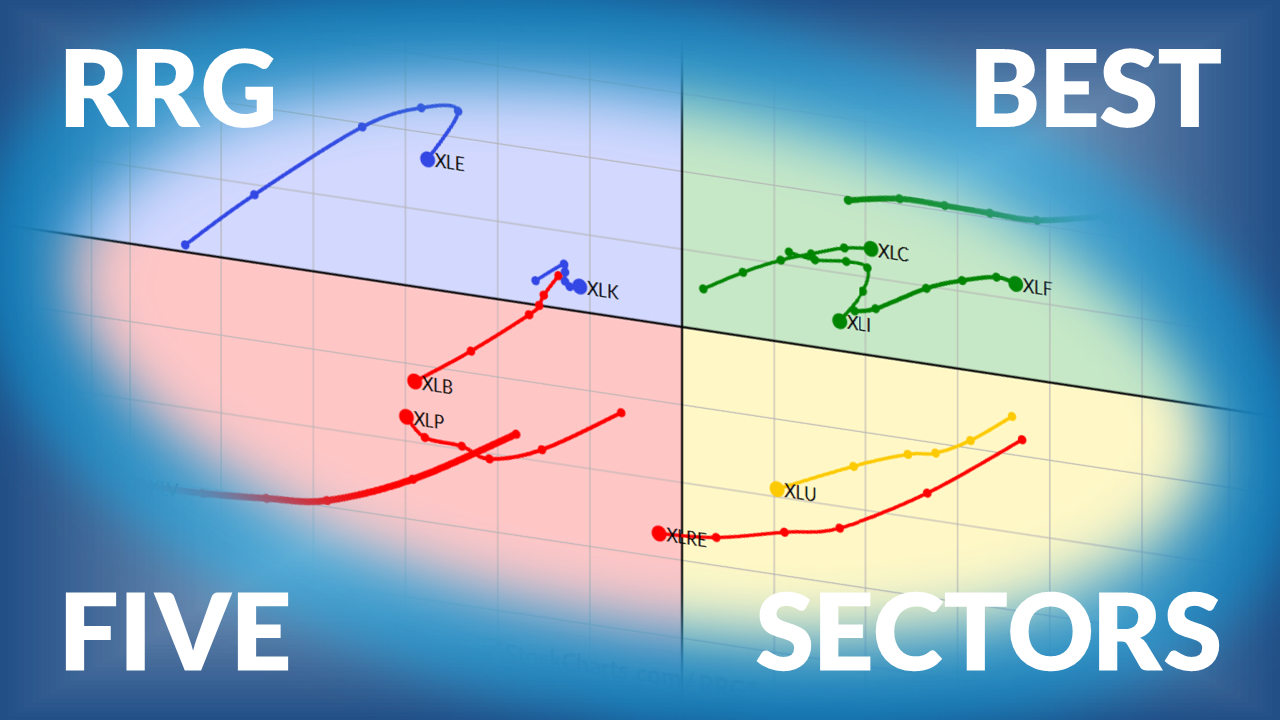
The Best Five Sectors, #30

by Julius de Kempenaer,
Senior Technical Analyst, StockCharts.com
Julius presents his weekly update on US sector rotation rankings using Relative Rotation Graphs (RRG)....
READ MORE
MEMBERS ONLY

Warning Signs in the Charts: How to Survive a Late-Summer Shakeout

by Tom Bowley,
Chief Market Strategist, EarningsBeats.com
The stock market rally may be hitting a wall as volatility spikes and bearish signals emerge. Discover key technical warnings, seasonal trends, and how traders and investors should prepare for a choppy August–September....
READ MORE
MEMBERS ONLY

Week Ahead: Nifty Tests Key Support Levels—May Weaken If Levels Violated

by Milan Vaishnav,
Founder and Technical Analyst, EquityResearch.asia and ChartWizard.ae
The Nifty closed the week lower, trading within a narrow range. Volatility also rose. Monitor short-term support levels as we head into next week. Discover which sectors are leading and which are lagging....
READ MORE
MEMBERS ONLY
August Pullback: Déjà Vu or Opportunity in Disguise?

by Jayanthi Gopalakrishnan,
Director of Site Content, StockCharts.com
Well, we got our seasonally strong July, but now, like clockwork, August has arrived, and the market sells off. It eerily echoes last August’s decline. Back then, the stock market sold off the week of August 5 on a weak jobs report, came close to its 40-week moving...
READ MORE
MEMBERS ONLY
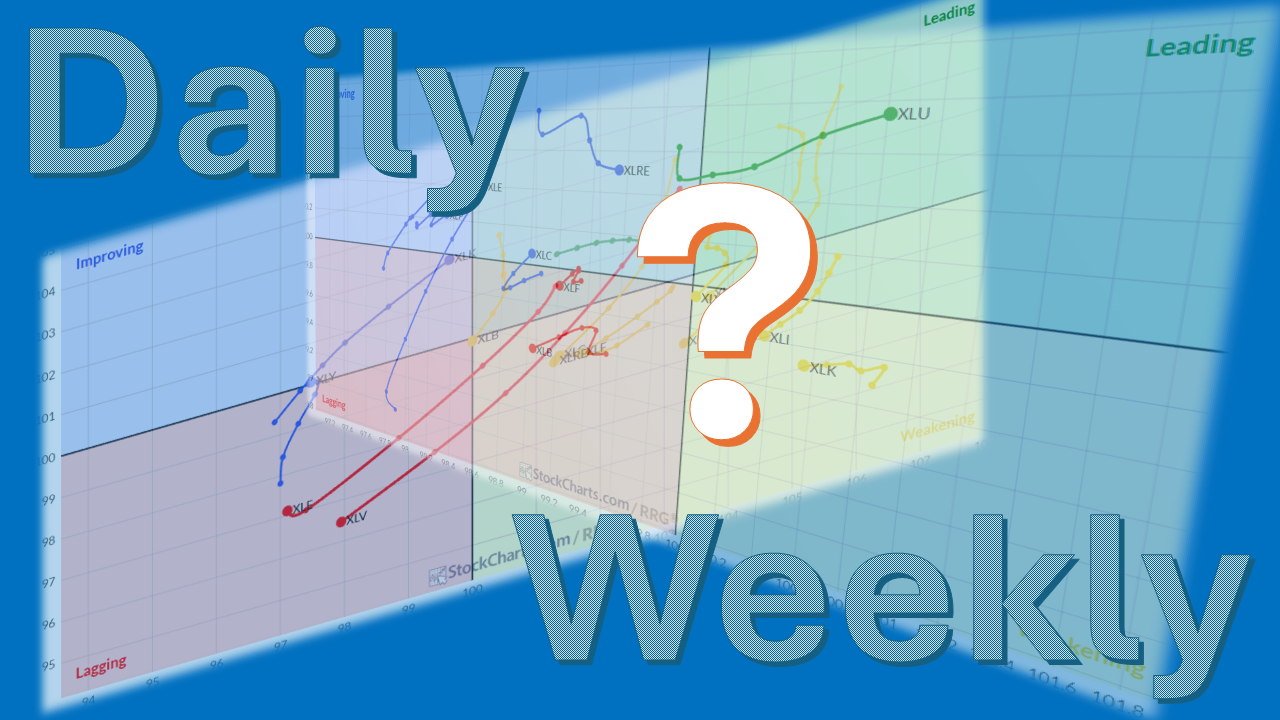
Why Daily vs. Weekly RRGs Matter in Portfolio Construction
by Julius de Kempenaer,
Senior Technical Analyst, StockCharts.com
Relative Rotation Graphs can be rendered in similar intervals as regular bar- or candlestick charts. This article explains the differences between weekly and daily RRGs....
READ MORE
MEMBERS ONLY

What Happens to Bitcoin Should QQQ Correct?

by Arthur Hill,
Chief Technical Strategist, TrendInvestorPro.com
Stock market correction risks are rising as key indicators flash warnings. Discover sector correlations with SPY, potential safe havens, and how Bitcoin's surge aligns with QQQ in this data-driven analysis....
READ MORE
MEMBERS ONLY

StockCharts Insider: What Kind of Chart Analyst Are You?

by Karl Montevirgen,
The StockCharts Insider
What are the different ways you can use technical analysis in your trading? And which is the best one for you? Today's Insider Tip: Know your charting "style" and focus on its strengths....
READ MORE
MEMBERS ONLY

Thursday's Stock Market Dive: Noise or a Warning? Let the Charts Decide
by Jayanthi Gopalakrishnan,
Director of Site Content, StockCharts.com
Was Thursday's market dip a warning sign or just noise? Explore market trends, sentiment, and sector rotation, and learn how the StockCharts Market Summary page can help you stay one step ahead....
READ MORE
MEMBERS ONLY

Meta, Microsoft Blow Past Earnings — Are These Stock Next?
by Tom Bowley,
Chief Market Strategist, EarningsBeats.com
Tom recaps a pivotal week for the markets, as the Fed holds rates steady despite signs of softening economic growth. Tom breaks down the rare dissent among Fed governors, the market’s sharp reaction during Jerome Powell’s press conference, and the technical fallout across major indexes, especially small caps...
READ MORE
MEMBERS ONLY

3 Types of Breakouts To Upgrade Your Portfolio

by David Keller,
President and Chief Strategist, Sierra Alpha Research
Use this StockCharts scan to identify three categories of stocks and ETFs that are making new three-month highs....
READ MORE
MEMBERS ONLY
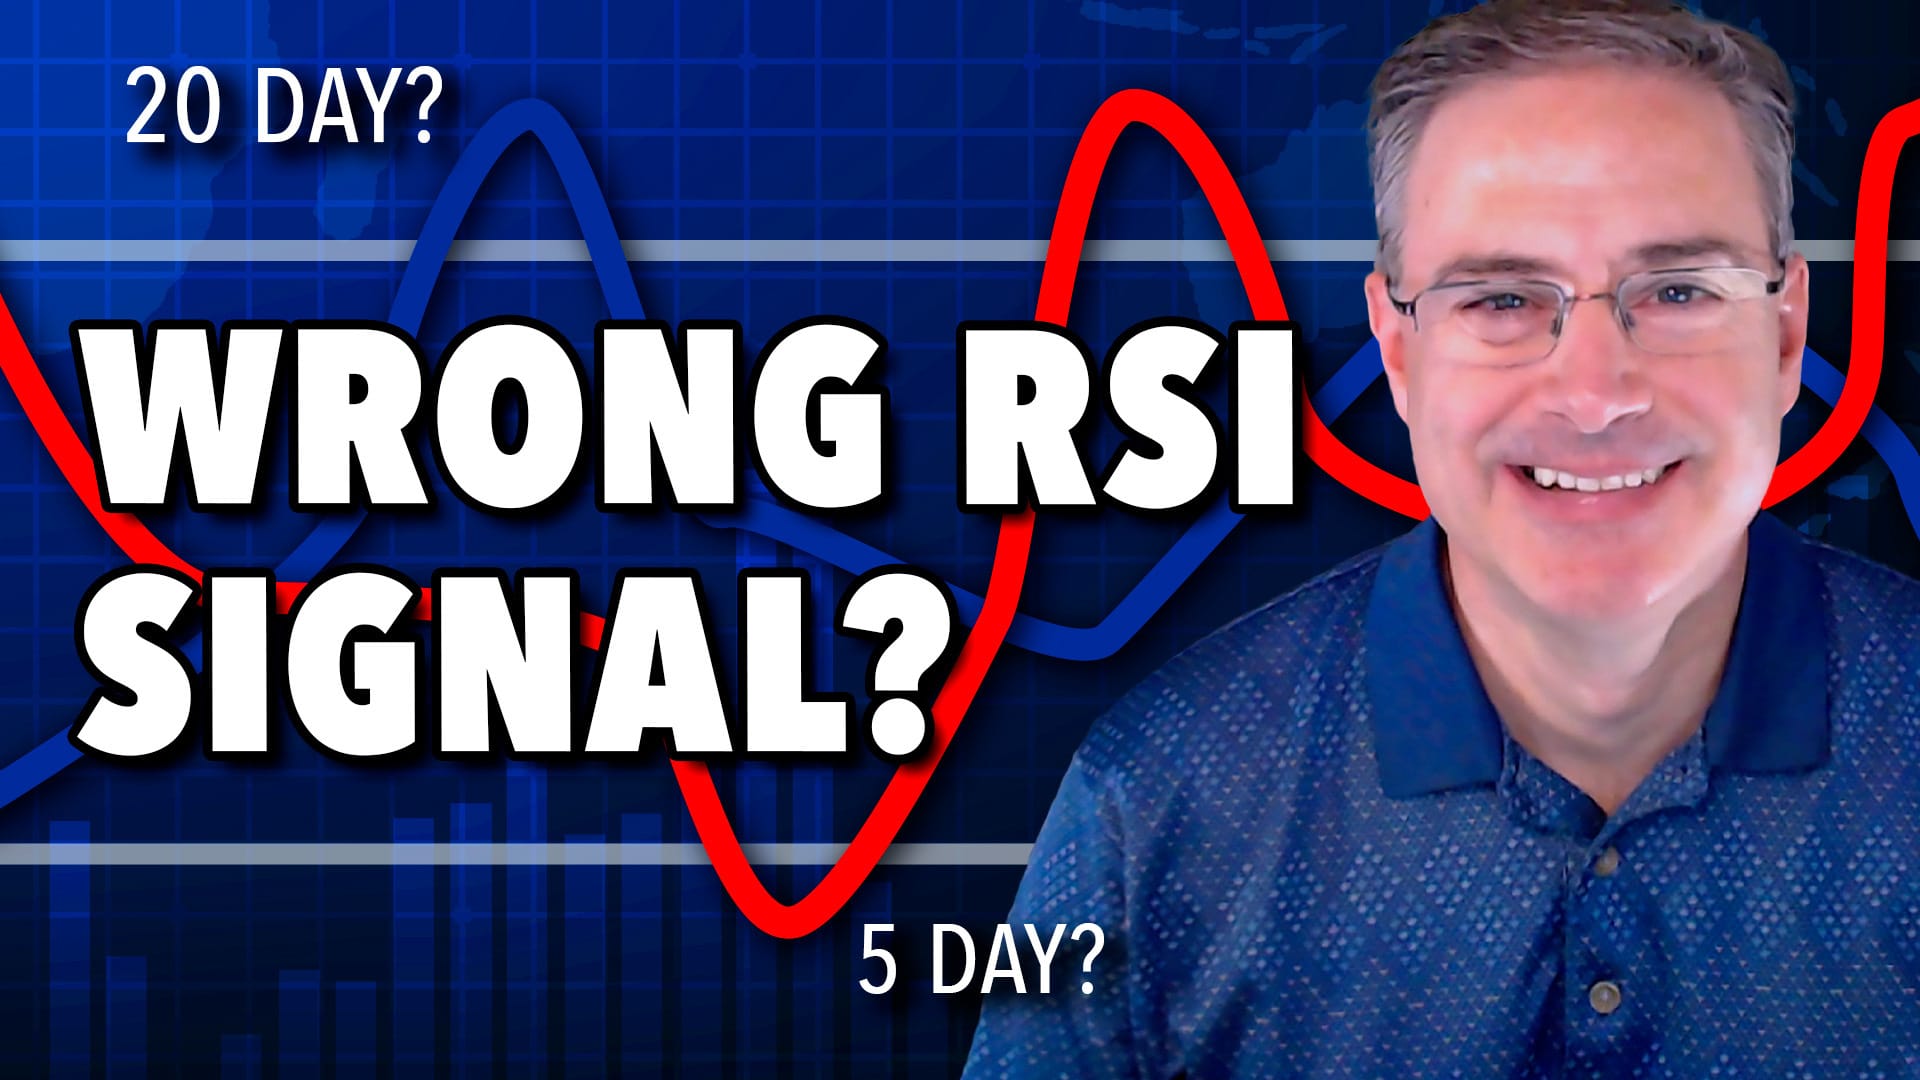
Avoid This Common RSI Mistake (And What to Do Instead)

by Joe Rabil,
President, Rabil Stock Research
Master RSI strategies with Joe! Follow along as Joe shares his refined method using dual timeframes and a two-RSI approach; see how he uses RSI-20 as a trend filter and RSI-5 as an entry signal to avoid common mistakes and enhance trading precision. Joe breaks down real...
READ MORE
MEMBERS ONLY
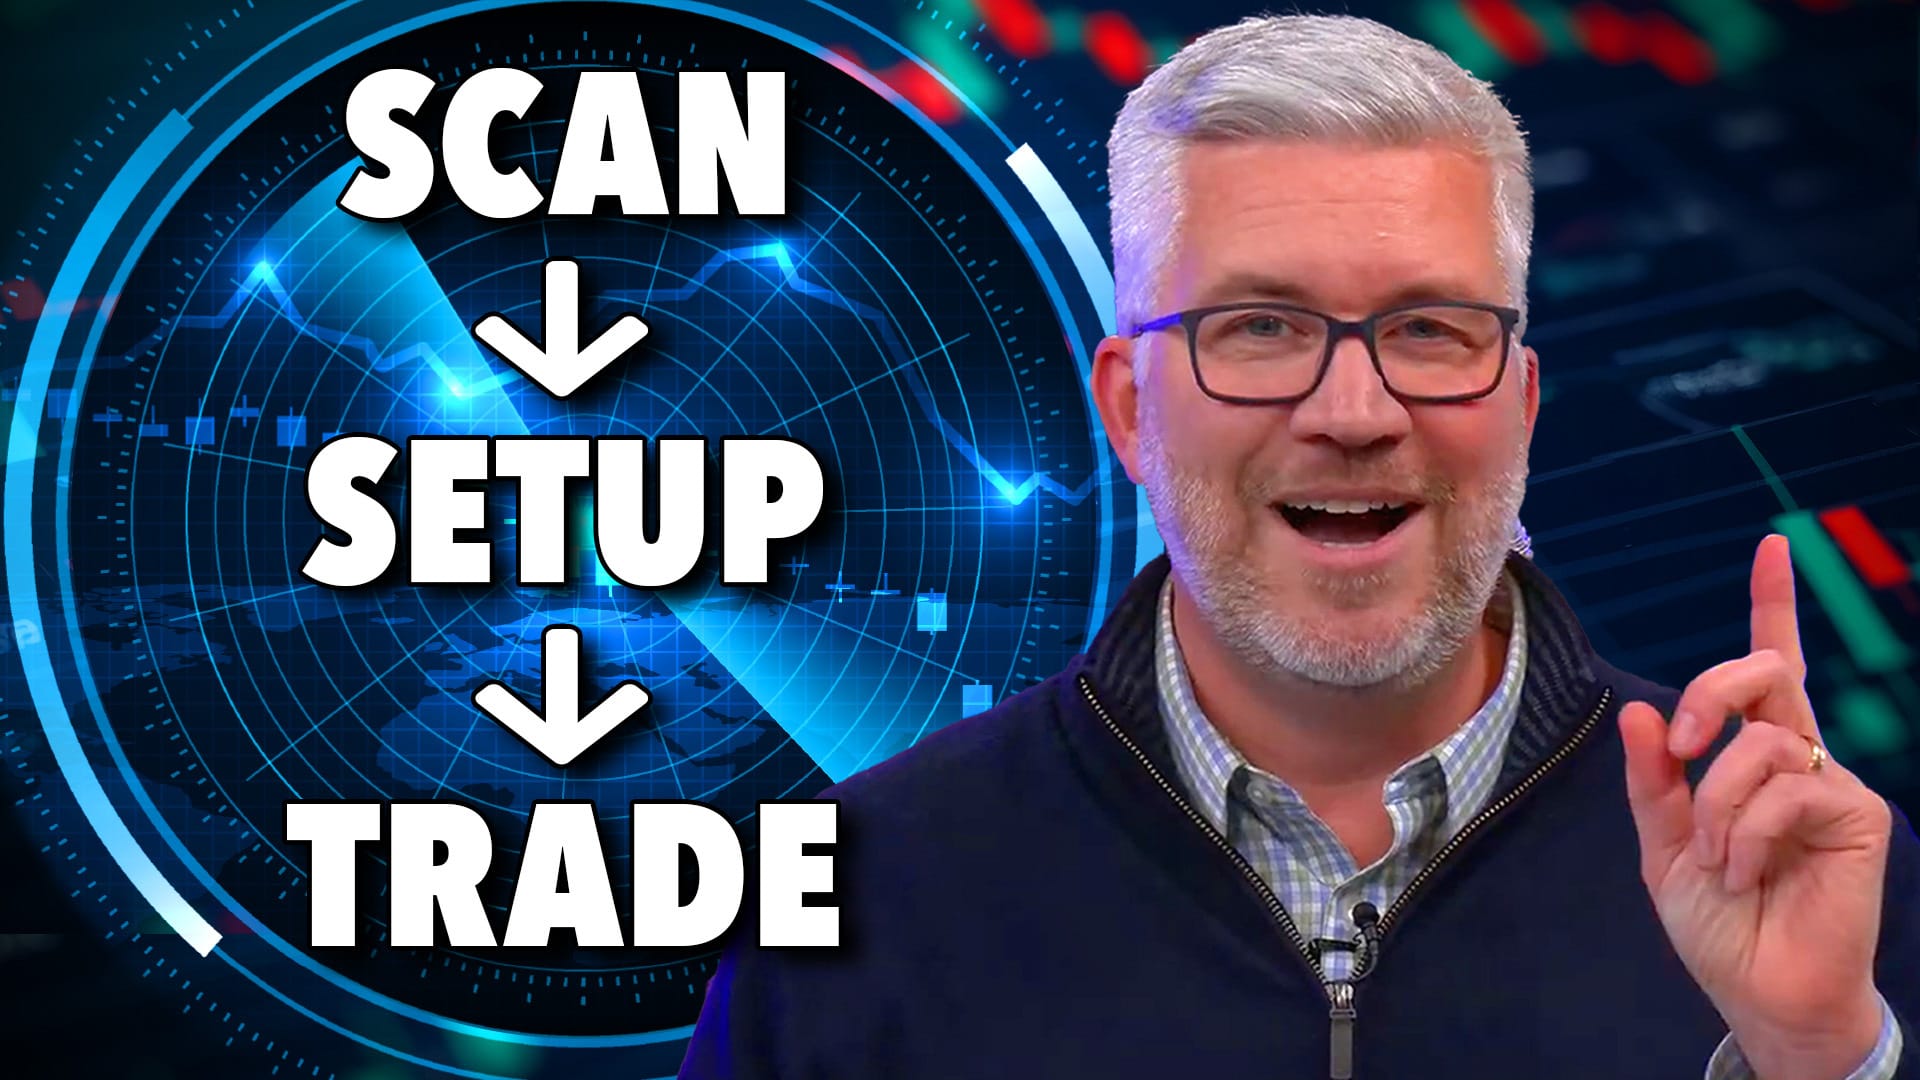
Catch Big Moves Early With This Breakout Scan!
by David Keller,
President and Chief Strategist, Sierra Alpha Research
Follow along as Dave shares the one stock scan he runs every week to uncover potential breakout candidates. He explains the three types of chart setups that frequently appear, each with their own trading implications, and walks through how he structures trades according to type. He also illustrates how to...
READ MORE
MEMBERS ONLY

RRG Reveals the Next Big Sector Moves!
by Julius de Kempenaer,
Senior Technical Analyst, StockCharts.com
In this video, Julius breaks down current market trends using Relative Rotation Graphs (RRG). He examines weekly and daily asset class rotations, highlighting key developments in stocks, commodities, bonds, the U.S. dollar, and crypto. From there, Julius analyzes sector momentum shifts, including technology, energy, and real estate, and explains...
READ MORE
MEMBERS ONLY

StockCharts Insider: Your Streetwise Guide Through the StockCharts Universe
by Karl Montevirgen,
The StockCharts Insider
Kicking off his new column, Karl Montevirgen introduces you to "The StockCharts Insider," your new guide to the ins and outs of StockCharts....
READ MORE
MEMBERS ONLY

Is It Time to Take Another Look at China?
by Martin Pring,
President, Pring Research
Here's an analysis of the recent bullish developments in the Shanghai Stock Exchange Composite Index and liquid Chinese ETFs. ...
READ MORE
MEMBERS ONLY

Before You Cast Away, Hook the Market's Key Trends on StockCharts
by Jayanthi Gopalakrishnan,
Director of Site Content, StockCharts.com
Check these must-see StockCharts signals before you cast off for the summer and see whether August's market currents say "stay the course" or "make adjustments."...
READ MORE
MEMBERS ONLY
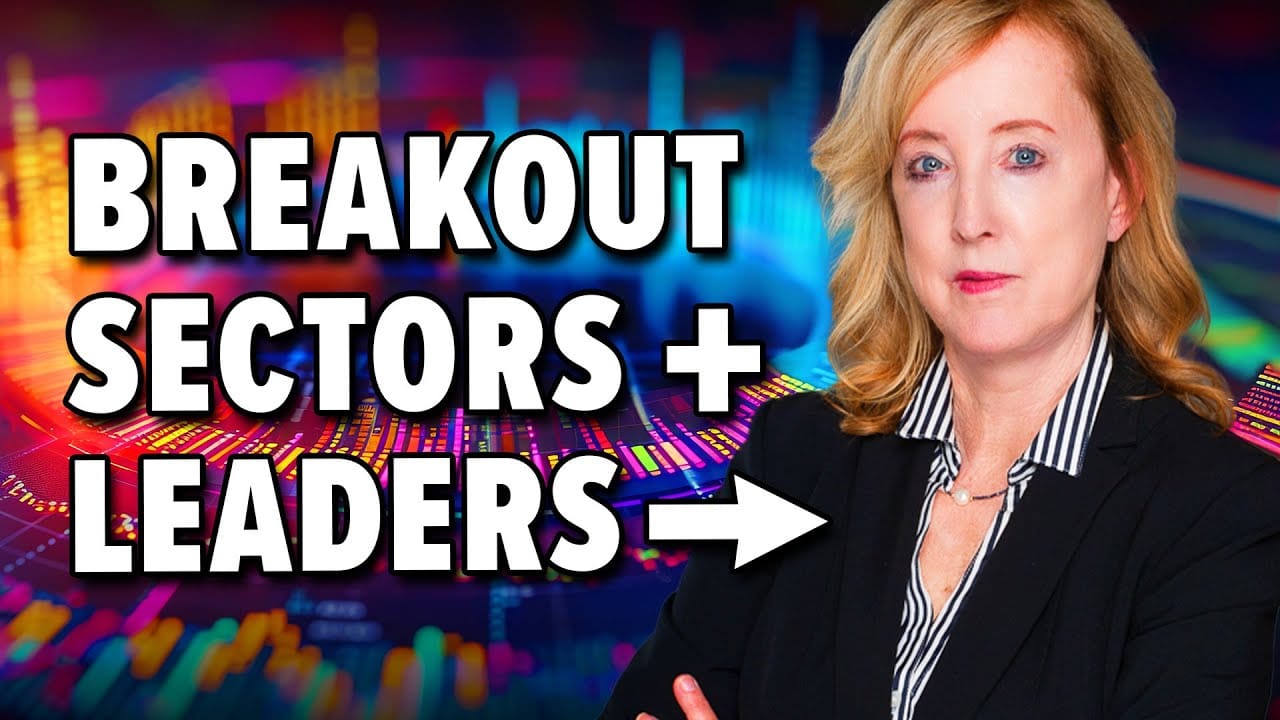
These Breakout Stocks Are Leading the Market Right Now

by Mary Ellen McGonagle,
President, MEM Investment Research
Markets hit another all-time high as rotation accelerates into biotech, software, and alt-energy names. Follow along as Mary Ellen breaks down the top-performing sectors and ETFs, including key breakouts in Bloom Energy, DoorDash, and Deckers. She also highlights meme stocks' action, examines what international leadership in...
READ MORE
MEMBERS ONLY

Is It Time For a Comeback? 3 Stocks That Might Be Turning a Corner

by Jay Woods,
Chief Global Strategist, Freedom Capital Markets
Explore technical turnaround setups for UPS stock, UNH stock price trends, and why MRK stock may offer the best risk/reward for investors this earnings season....
READ MORE
MEMBERS ONLY

Is the Charging Bull Getting Tired?

by Bruce Fraser,
Industry-leading "Wyckoffian"
Optimism surrounds the stock market indexes with lofty price targets. Could the fulfillment of Point & Figure targets mean the end of a bull market? Find out here. ...
READ MORE
MEMBERS ONLY

The Best Five Sectors, #29
by Julius de Kempenaer,
Senior Technical Analyst, StockCharts.com
Weekly update on US sector rotation using Relative Rotation Graphs...
READ MORE
MEMBERS ONLY

The Week Ahead: NIFTY Will Have a Lot Of Reactions To Offer; Stares At Important Supports
by Milan Vaishnav,
Founder and Technical Analyst, EquityResearch.asia and ChartWizard.ae
Nifty ended the week slightly lower after trading within a narrow range. With key levels in focus and technical indicators showing mixed signals, markets may remain sideways for a while....
READ MORE
MEMBERS ONLY

Using Relative Rotation Graphs to Visualize Sector Rotation
by Julius de Kempenaer,
Senior Technical Analyst, StockCharts.com
Relative Rotation Graphs or RRGs will help investors to keep an eye on relative trends that unfold within a universe. Among other things this will help to visualize sector rotation...
READ MORE
MEMBERS ONLY
A Faster Way To Your Charts
by Jayanthi Gopalakrishnan,
Director of Site Content, StockCharts.com
The stock market may be setting records, but you deserve a breather this weekend. While you’re sipping your iced tea, take just a couple of minutes to explore the brand-new navigation menu on StockCharts.com. It’ll make your next charting session a breeze.
What’s different (and...
READ MORE
MEMBERS ONLY

Will SMCI Stock Soar in 2025? Here's What the Charts Say
by Jayanthi Gopalakrishnan,
Director of Site Content, StockCharts.com
Discover why SMCI stock's steady breakout, key support levels, and AI-driven upside could reward patient investors....
READ MORE
MEMBERS ONLY

Chart Mania - 23 ATR Move in QQQ - Metals Lead 2025 - XLV Oversold - XLU Breakout - ITB Moment of Truth
by Arthur Hill,
Chief Technical Strategist, TrendInvestorPro.com
Tech stocks are heating up, utilities break out, metals lead, and homebuilders hit a moment of truth....
READ MORE
MEMBERS ONLY

S&P 500 Breaking Out Again: What This Means for Your Portfolio

by Frank Cappelleri,
Founder & President, CappThesis, LLC
The S&P 500 ($SPX) just logged its fifth straight trading box breakout, which means that, of the five trading ranges the index has experienced since the April lows, all have been resolved to the upside.
How much longer can this last? That's been the biggest question...
READ MORE
MEMBERS ONLY

Momentum Leaders Are Rotating — Here's How to Find Them
by Tom Bowley,
Chief Market Strategist, EarningsBeats.com
Is the market's next surge already underway? Find out with Tom Bowley's breakdown of where the money is flowing now and how you can get in front of it.
In this video, Tom covers key moves in the major indexes, revealing strength in transports, small caps,...
READ MORE
MEMBERS ONLY
Is META Breaking Out or Breaking Down?
by David Keller,
President and Chief Strategist, Sierra Alpha Research
The chart of Meta Platforms, Inc. (META) has completed a roundtrip from the February high around $740 to the April low at $480 – and all the way back again. Over the last couple weeks, META has pulled back from its retest of all-time highs, leaving investors to wonder what...
READ MORE
MEMBERS ONLY

Emerging Markets May Be on the Cusp of a Major Breakout
by Martin Pring,
President, Pring Research
Emerging markets, in the form of the iShares MSCI Emerging Markets ETF (EEM), have been underperforming the DJ World Index since 2010 -- but that may be about to change.
After all, Chart 1 shows that the RS line has crossed above a three-year down trendline and experienced a long-...
READ MORE
MEMBERS ONLY
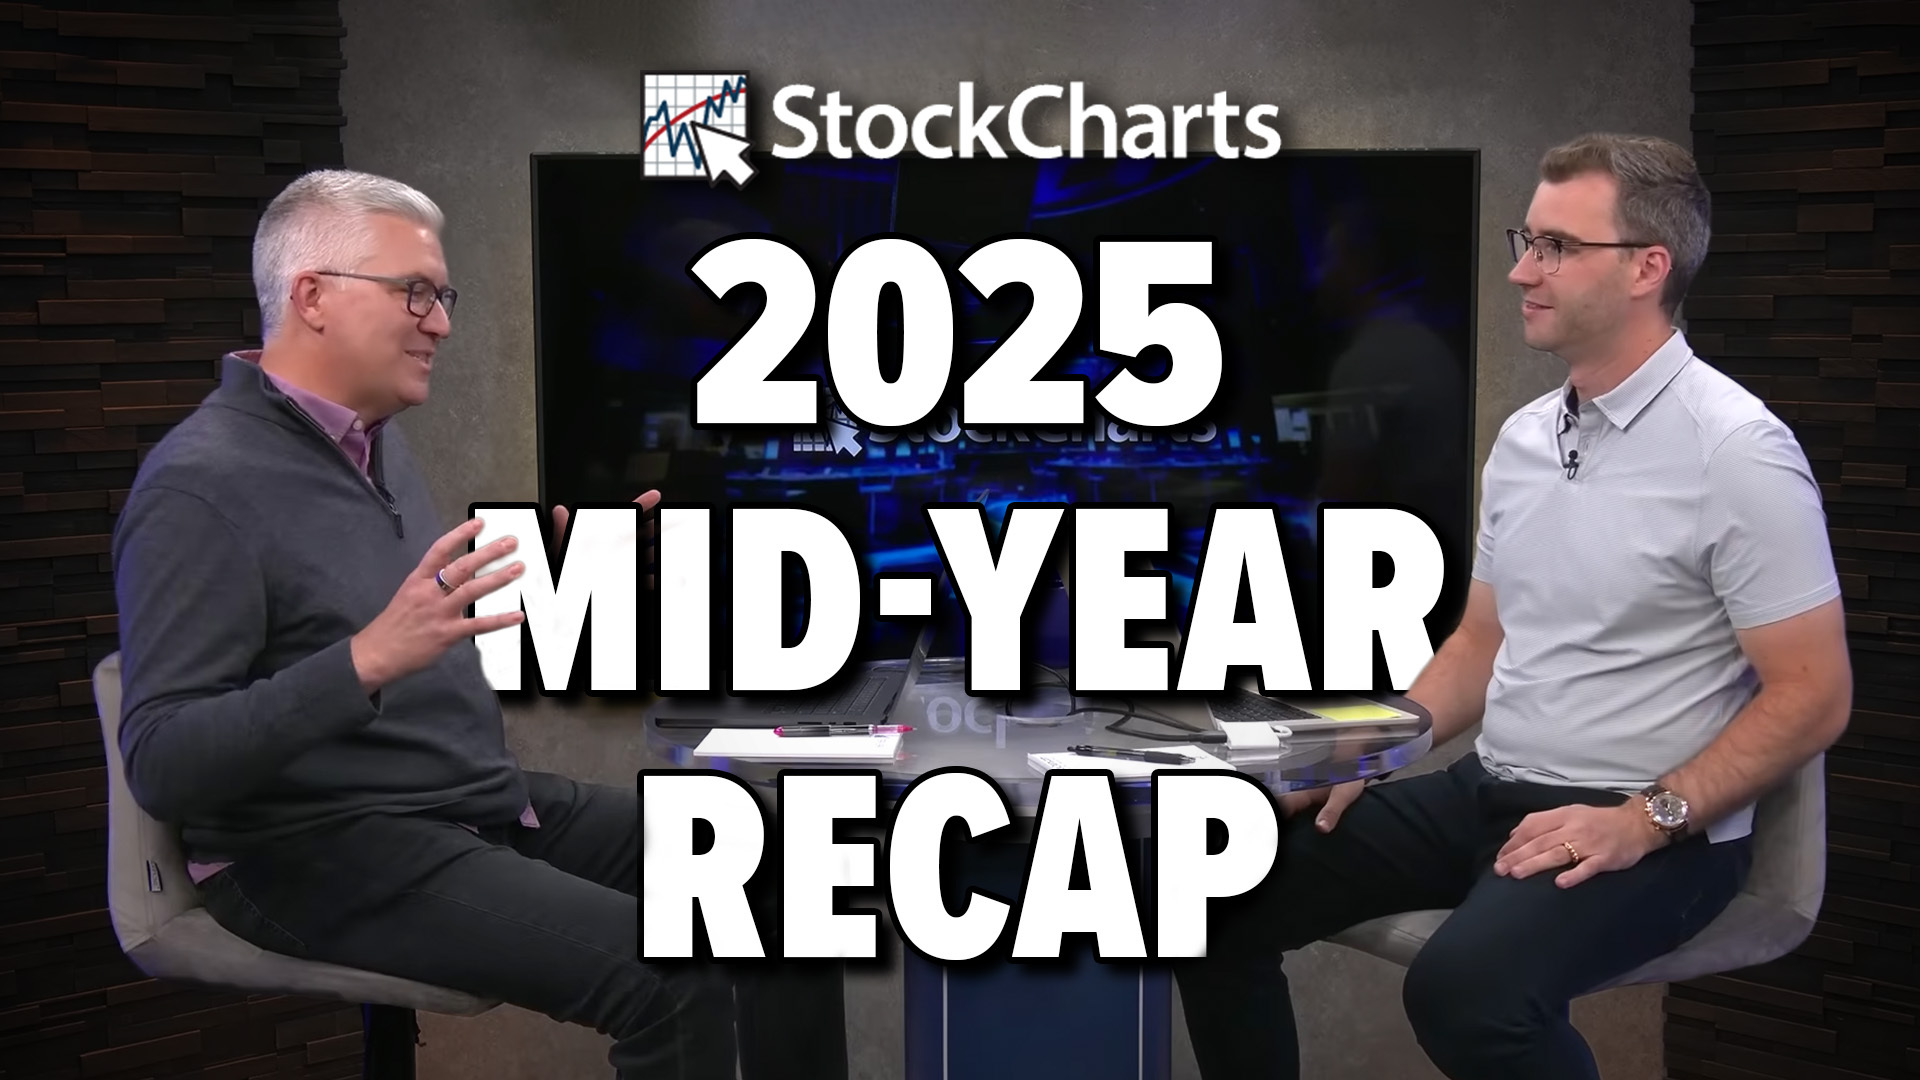
A Wild Ride For the History Books: 2025 Mid-Year Recap

by Grayson Roze,
Chief Strategist, StockCharts.com
by David Keller,
President and Chief Strategist, Sierra Alpha Research
Markets don't usually hit record highs, then risk falling into bearish territory, and spring back to new highs within six months. But that's what happened in 2025.
In this special mid-year recap, Grayson Roze sits down with David Keller, CMT, to show how disciplined routines,...
READ MORE
MEMBERS ONLY

Tech Taps the Brakes, Homebuilders Hit the Gas: See the Rotation on StockCharts Today
by Jayanthi Gopalakrishnan,
Director of Site Content, StockCharts.com
Technology stocks cool before earnings, but the Nasdaq holds above a key moving average. See rotation, support, and key charts on StockCharts to stay ready....
READ MORE
MEMBERS ONLY

The Best Five Sectors, #28
by Julius de Kempenaer,
Senior Technical Analyst, StockCharts.com
The Technology sector continues to dominate, while Industrials are rotating out of the leading quadrant....
READ MORE
MEMBERS ONLY

Week Ahead: NIFTY Violates Short-Term Supports; Still Tentatively Devoid of Any Major Triggers
by Milan Vaishnav,
Founder and Technical Analyst, EquityResearch.asia and ChartWizard.ae
The Nifty traded in a broadly sideways and range-bound manner throughout the week, ending it with a modest decline. The Index oscillated within a narrow 276-point range, between 25144.60 on the higher end and 24918.65 on the lower end, before settling mildly lower. The India VIX...
READ MORE
MEMBERS ONLY

The Real Drivers of This Market: AI, Semis & Robotics
by Mary Ellen McGonagle,
President, MEM Investment Research
In this video, Mary Ellen spotlights the areas driving market momentum following Taiwan Semiconductor's record-breaking earnings report. She analyzes continued strength in semiconductors, utilities, industrials, and AI-driven sectors, plus highlights new leadership in robotics and innovation-focused ETFs like ARK. From there, Mary Ellen breaks down...
READ MORE
MEMBERS ONLY

July Strength, Late-Summer Caution: 3 Charts to Watch
by Jayanthi Gopalakrishnan,
Director of Site Content, StockCharts.com
July seasonality is lifting the S&P 500 as breadth and bullish sentiment hold up. Discover which charts to watch before the choppier August to October stretch. ...
READ MORE
MEMBERS ONLY

Three Stocks in Focus: One Old Favorite, One Mag Name, and a Dow Comeback Story
by Jay Woods,
Chief Global Strategist, Freedom Capital Markets
This week, let's dive into three interesting stocks: a well-known Dow stalwart, a tech giant in a tug of war, and a former Dow member showing signs of revival. Whether you're looking for opportunity, caution, or something worth watching, there's a little something...
READ MORE
MEMBERS ONLY

This Market Sector is Starting to Emerge as a Leader; Can it Complete the Job?
by Martin Pring,
President, Pring Research
Many years ago, I developed a couple of indexes that were designed to give me a sense of whether industry groups benefiting from inflationary conditions were outperforming those who performed better under deflationary ones. It was my way of recognizing the fact that, in a broad sense, the business cycle...
READ MORE
MEMBERS ONLY

These HOT Industry Groups are Fueling This Secular Bull Market
by Tom Bowley,
Chief Market Strategist, EarningsBeats.com
Join Tom as he covers key inflation data, earnings season highlights, and sector rotation trends. He breaks down recent price action in major indexes like the S&P 500 and Nasdaq, with a close look at the 20-day moving average as a support gauge. Tom spotlights standout industry...
READ MORE
MEMBERS ONLY

Three Bearish Candle Patterns Every Investor Should Know
by David Keller,
President and Chief Strategist, Sierra Alpha Research
KEY TAKEAWAYS
* The shooting star pattern indicates a short-term rotation from accumulation to distribution.
* The bearish engulfing pattern suggests sellers have taken control, suggesting further weakness.
* The evening star pattern is a three-candle formation that illustrates an exhaustion of buying power.
There is no denying that the broad...
READ MORE