MEMBERS ONLY
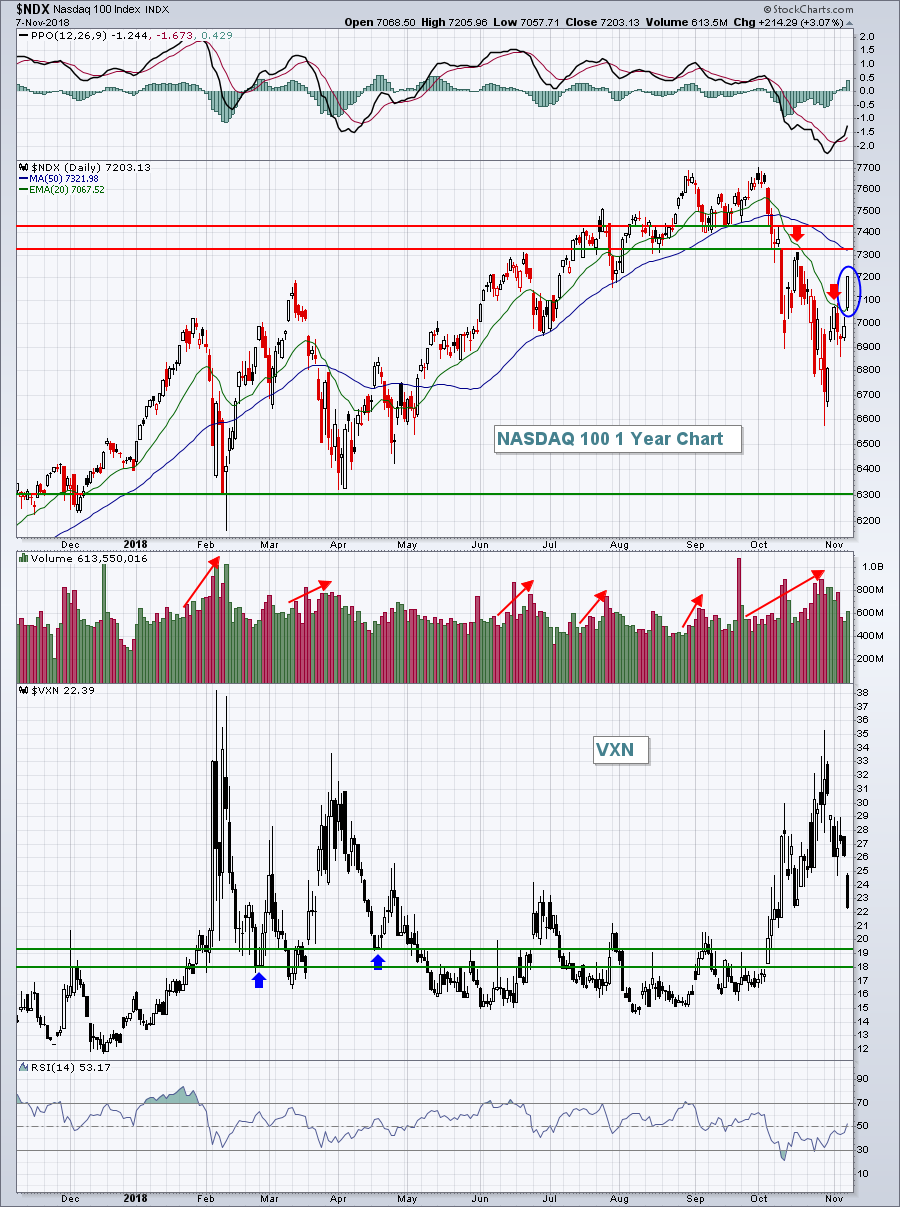
Very Bullish Sector Rotation Underscores Dow's 500 Point Gain

by Tom Bowley,
Chief Market Strategist, EarningsBeats.com
Market Recap for Wednesday, November 7, 2018
The Dow Jones surged 545 points, or 2.13%, yesterday and that index of conglomerates was a laggard. NASDAQ stocks exploded nearly 200 points higher, or 2.64%, to extend what's been a very impressive rally after October's massacre....
READ MORE
MEMBERS ONLY

Healthcare Sector Stands Out - Plus HealthCare Providers, Medical Devices, a New High Scan and Nine Stocks

by Arthur Hill,
Chief Technical Strategist, TrendInvestorPro.com
* Healthcare Sector Shows Leadership.
* Big Moves in %Above 50-day EMA.
* Healthcare Providers and Medical Devices Break Out.
* HealthCare Providers Lead New High List.
* Nine Healthcare Stocks to Watch.
... Strong Breadth within Healthcare
... The chart below shows the %Above 200-day EMA indicator for nine of the sector SPDRs. Note that we...
READ MORE
MEMBERS ONLY
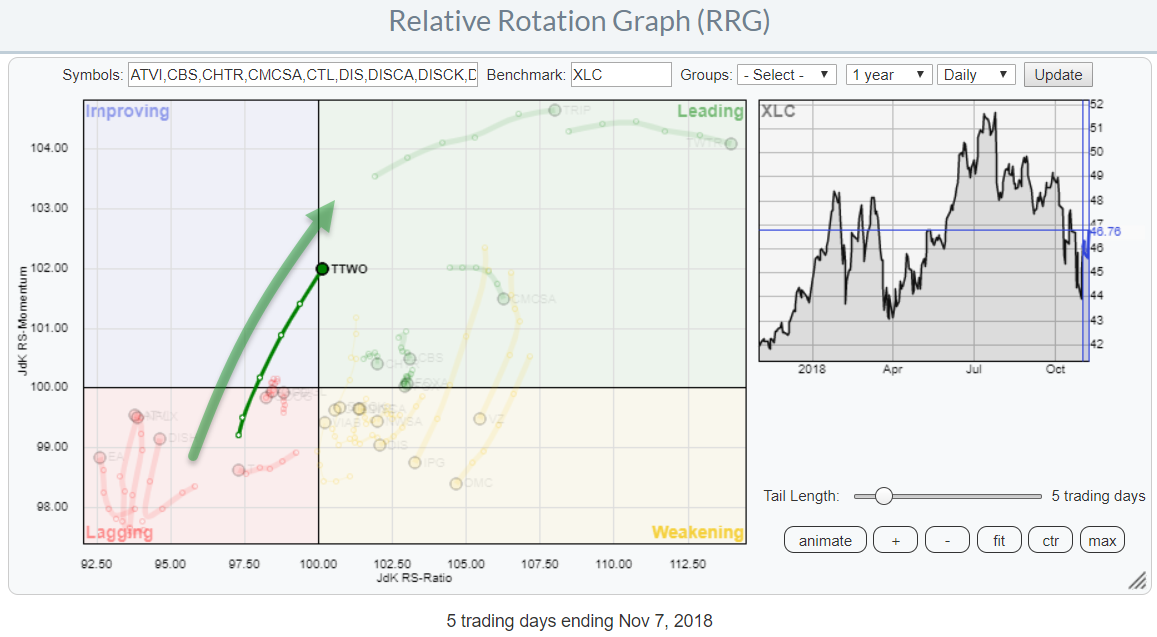
It takes two to tango for TTWO

by Julius de Kempenaer,
Senior Technical Analyst, StockCharts.com
While browsing through some Relative Rotation Graphs, looking for DITC candidates, my eye fell on TTWO inside the Communications Services sector.
XLC itself is inside the weakening quadrant vs SPY but very close to the benchmark, meaning that the performance of the sector is very close to that of SPY....
READ MORE
MEMBERS ONLY

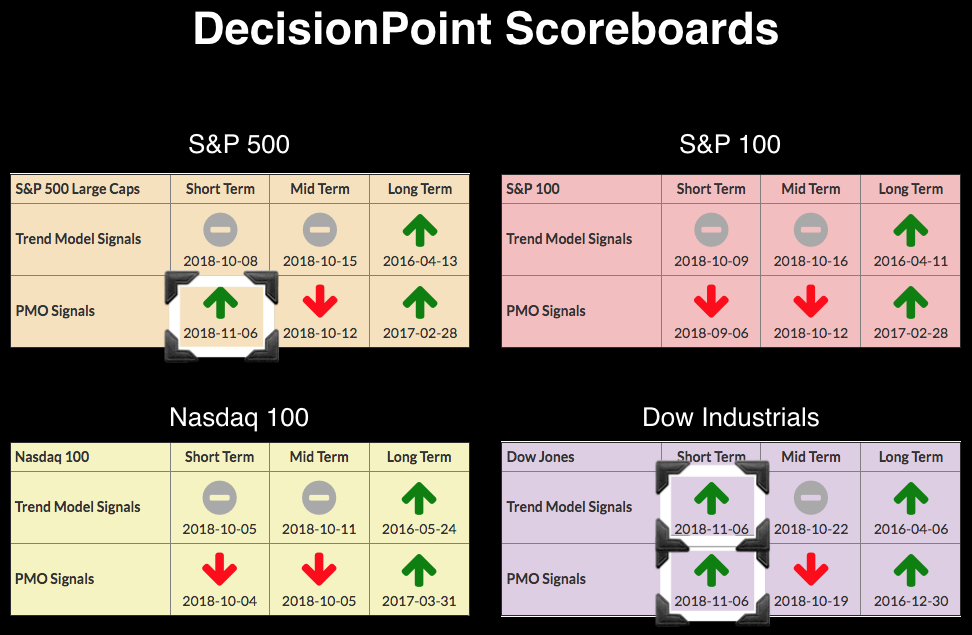
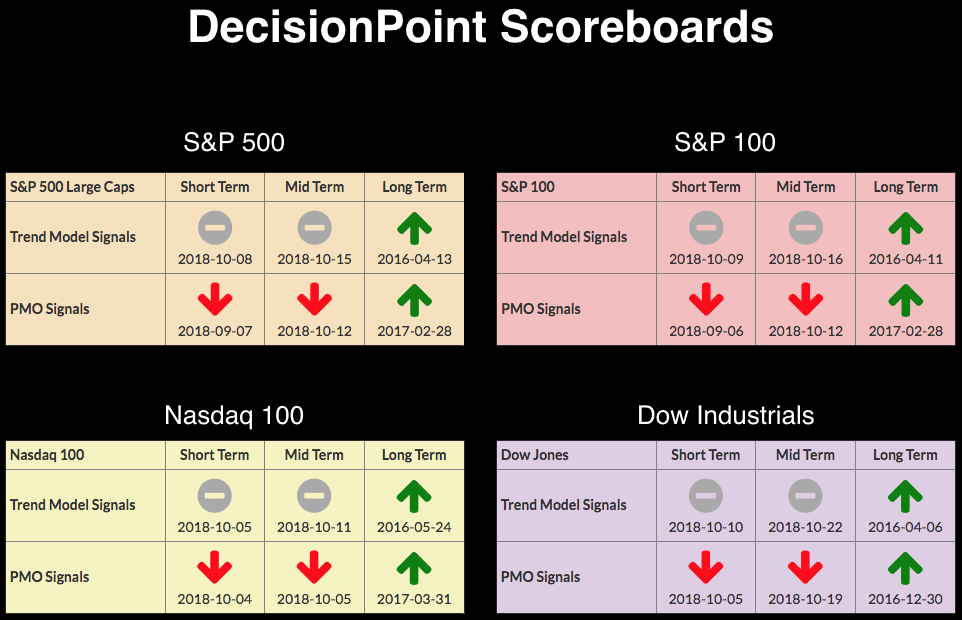
DP Alert: Momentum Shift - New PMO BUY Signals on DP Scoreboards

by Erin Swenlin,
Vice President, DecisionPoint.com
Lots of new BUY signals are appearing on the DecisionPoint Scoreboards in the short-term timeframe. This is good news for bulls, but I don't think they can breathe easy just yet. This rally reminds me of the last big rally we had in October that was not fueled...
READ MORE
MEMBERS ONLY
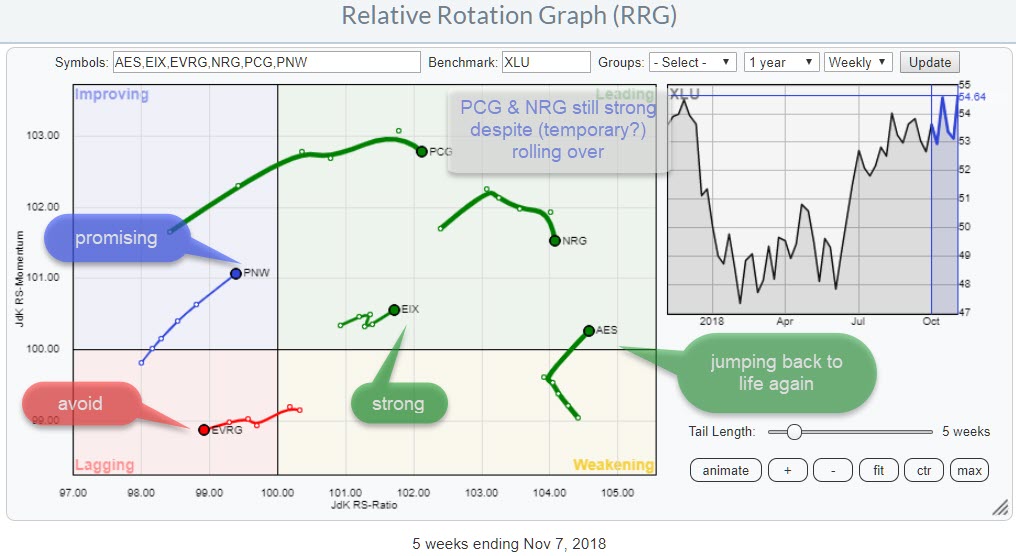
Some utility stocks worth paying attention to
by Julius de Kempenaer,
Senior Technical Analyst, StockCharts.com
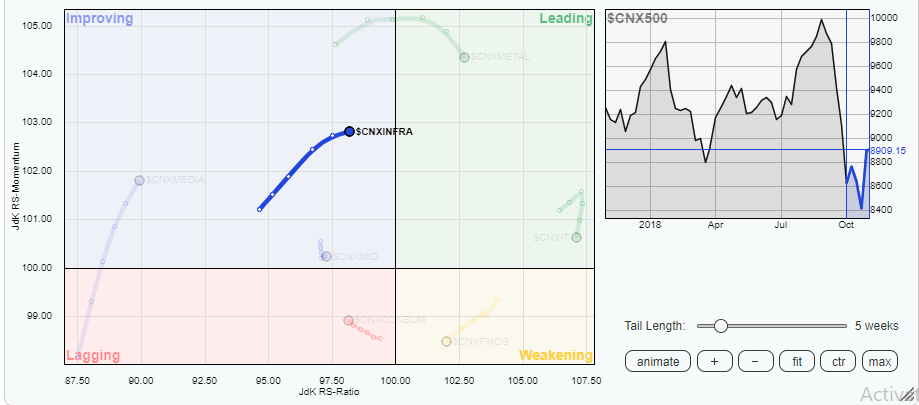
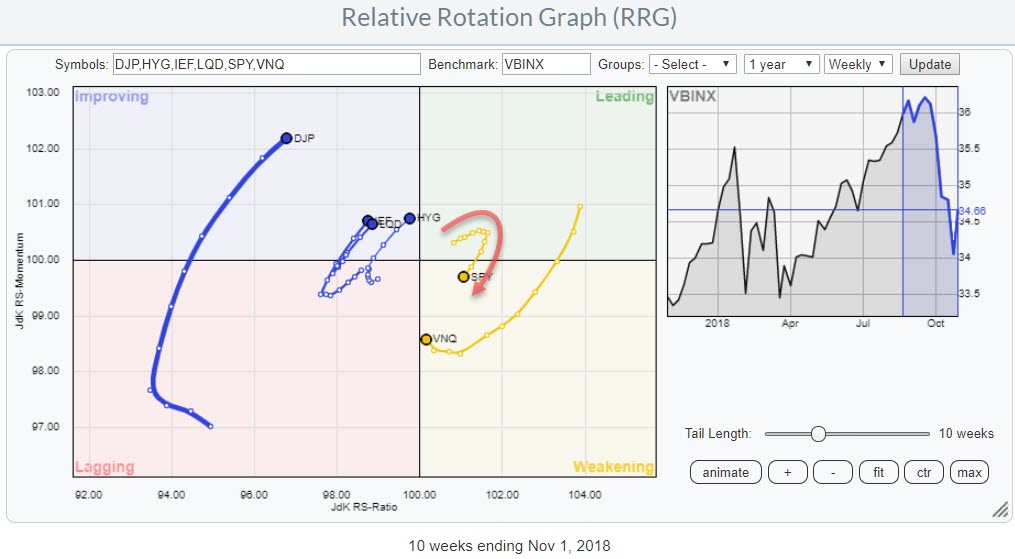
The relative rotation graph above shows a selection of stocks in the utilities sector. I have created this zoomed in version for better visibility. The fully populated RRG can be found here.
In this post, I will highlight a few of the stocks shown in the picture. As XLU is...
READ MORE
MEMBERS ONLY
DP Bulletin: Dow and SPX Log New BUY Signals
by Erin Swenlin,
Vice President, DecisionPoint.com
The Dow and SPX both triggered PMO BUY signals after the close yesterday. In addition, the Dow printed a ST Trend Model BUY signal. I will be writing a more comprehensive blog this evening on these signal changes that occurred on the close yesterday. I just wanted to give everyone...
READ MORE
MEMBERS ONLY

THE DOW LEADS NOVEMBER REBOUND -- THE S&P 500 IS BACK ABOVE ITS 200-DAY LINE -- SO ARE THE QQQ AND XLK -- HEALTH CARE PROVIDERS LEAD THE XLV -- SO ARE ABBOTT LABS, JOHNSON & JOHNSON, AND MERCK

by John Murphy,
Chief Technical Analyst, StockCharts.com
THE DOW LEADS STOCK UPTURN ... Major stock indexes are building on their November gains on the day after the midterm elections. The Dow is leading on the upside. Chart 1 shows the Dow Industrials already trading above chart resistance at 25,800 and trying to clear its 50-day average. Chart...
READ MORE
MEMBERS ONLY
Railroads Provide Us Market Clues And Right Now They're Bullish
by Tom Bowley,
Chief Market Strategist, EarningsBeats.com
Market Recap for Tuesday, November 6, 2018
All eleven sectors rose on Tuesday with materials (XLB, +1.64%) leading as the U.S. Dollar Index ($USD) closed at its lowest level in nearly two weeks. All of our major indices had similar gains, from 0.55% to 0.68%, as...
READ MORE
MEMBERS ONLY

This Big Pharma Stock is Closing in on a New High
by Arthur Hill,
Chief Technical Strategist, TrendInvestorPro.com
Johnson & Johnson (JNJ) started the year on the wrong foot with a double digit decline the first six months. After hitting a 52-week low in late May, the stock turned around and advanced some 20% the next four months. Even though the stock remains below the January high, the...
READ MORE
MEMBERS ONLY

Monitoring the Bounce in the Major Index ETFs, key Sectors, Tech-related ETFs and a Dozen Stocks
by Arthur Hill,
Chief Technical Strategist, TrendInvestorPro.com
* Short-term Bounce Extends.
* XLY and XLF Lead Rebound.
* SKYY and SOXX Lead Tech-related ETFs.
* Gold Holds Breakout.
* Crude Hits Moment-of-Truth.
* Bonds Continue to March South.
* Stocks to Watch: DIS, VZ, CSCO, MSFT, MA, V and JNJ.
... Short-term Bounce Extends
Stocks were deeply oversold in late October and there were several...
READ MORE
MEMBERS ONLY

Last Chance For Gold To Rally?

by Martin Pring,
President, Pring Research
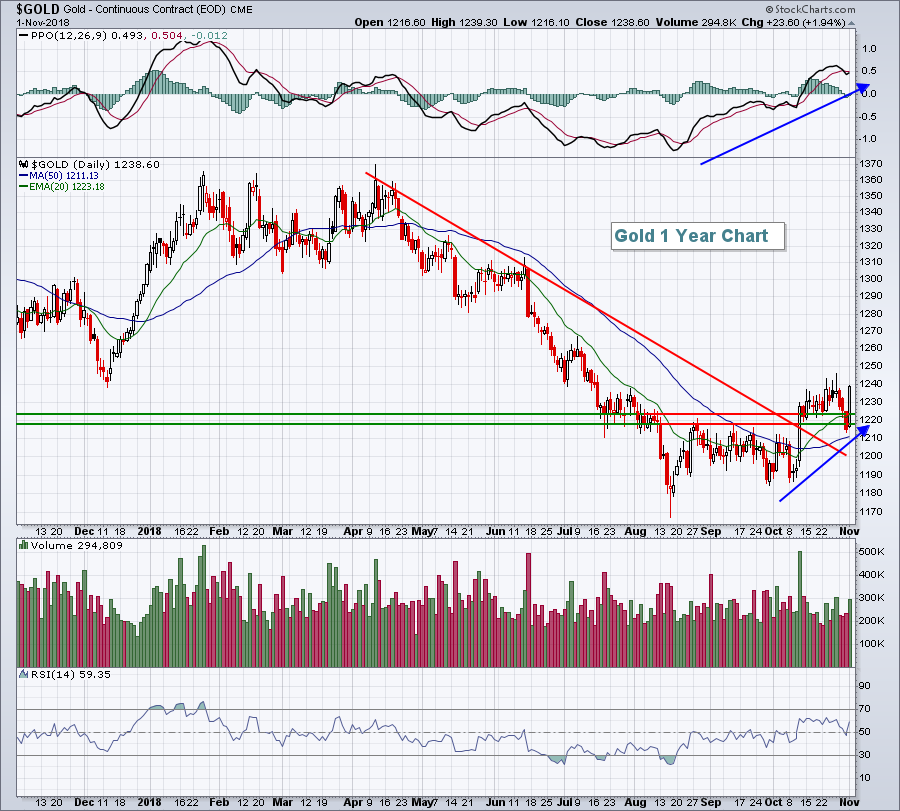
* The Long-Term Picture
* Price Action Characteristics are Bearish
* Gold Share Breadth is Negative
* The Now or Never Chart
The Long-Term Picture
Gold was in a secular bull market between 2001 and 2011. It then sold off into 2014 and has been essentially range bound ever since. Chart 1 shows that...
READ MORE
MEMBERS ONLY
November 2018 Market Roundup with Martin Pring
by Martin Pring,
President, Pring Research
The Market Roundup Video For November is now available.
Good luck and good charting,
Martin J. Pring
The views expressed in this article are those of the author and do not necessarily reflect the position or opinion ofPring Turner Capital Groupof Walnut Creek or its affiliates....
READ MORE
MEMBERS ONLY
Bulls Avert Near-Term Breakdown But Caution Prevails
by Tom Bowley,
Chief Market Strategist, EarningsBeats.com
Market Recap for Monday, November 5, 2018
Bifurcated market action dominated on Monday. The Dow Jones and S&P 500 gapped higher and traded higher throughout nearly all of the session. The NASDAQ and Russell 2000, on the other hand, struggled throughout most of the day with an afternoon...
READ MORE
MEMBERS ONLY
Interesting Trade Set-up; Breakout expected

by Milan Vaishnav,
Founder and Technical Analyst, EquityResearch.asia and ChartWizard.ae
NIFTY Infrastructure Index ($CNXINFRA) has seen considerable improvement in its performance over past couple of weeks. After relatively under-performing for the most part of 2018, this Sector Index has shown strong improvement in its Relative Momentum when bench-marked against the broader Index NIFTY500 ($CNX500). It is seen continuing with its...
READ MORE
MEMBERS ONLY

Using PnF Charts for Intraday Trading

by Bruce Fraser,
Industry-leading "Wyckoffian"
Point and Figure charts are useful tools for more than calculating price objectives. Many Wyckoffians start their analysis with PnF charts and then turn to vertical bar charts when and if needed. Classic Wyckoff analysis uses a combination of vertical and PnF charts. But it is excellent practice to develop...
READ MORE
MEMBERS ONLY
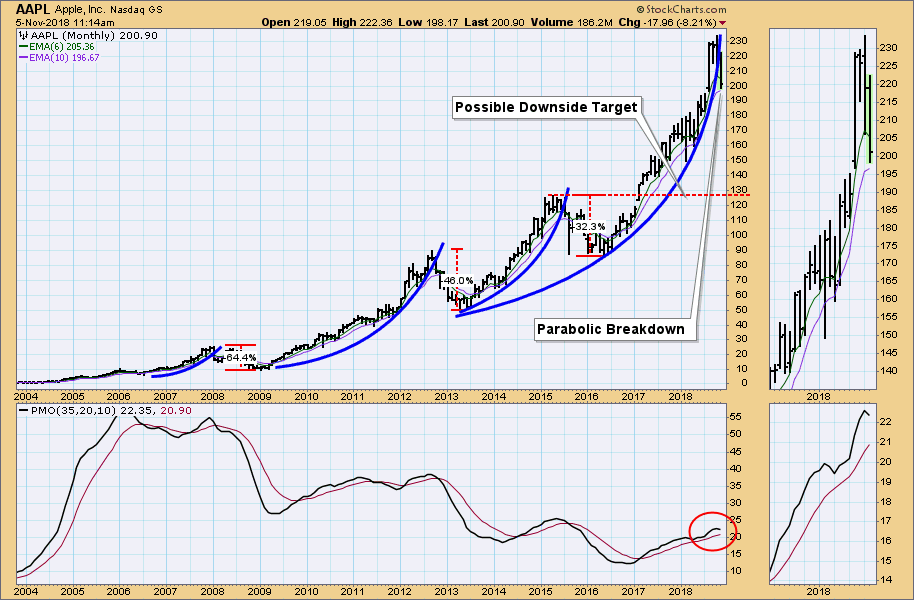
AAPL: Another Parabolic Breakdown

by Carl Swenlin,
President and Founder, DecisionPoint.com
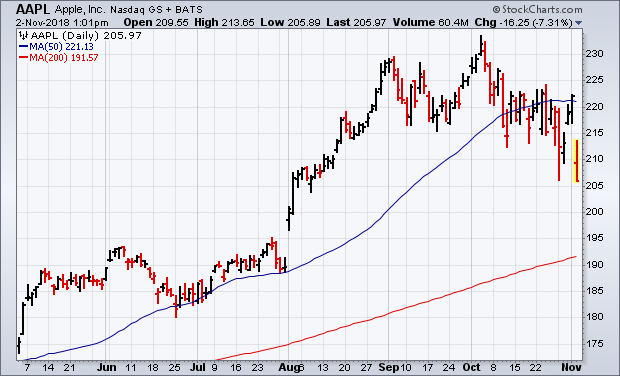
Apple, Inc. (AAPL) is nothing if not repetitive. AAPL experiences frenzied, parabolic advances that are followed by equally dramatic corrections. This has happened no less than three times in the last 11 years with an average correction of -48%. Now it appears to be happening again, as price has recently...
READ MORE
MEMBERS ONLY

How to (not) Trade the Elections
by Arthur Hill,
Chief Technical Strategist, TrendInvestorPro.com
The US elections are on Tuesday and the financial press is full of tips based on possible outcomes. Basing a financial decision on a news event means we must get two things right. First, we must successfully predict the news (election results). Second, we must then successfully predict the market&...
READ MORE
MEMBERS ONLY
Transports Are A Big Deal And Here's What The Chart Is Saying
by Tom Bowley,
Chief Market Strategist, EarningsBeats.com
Market Recap for Friday, November 2, 2018
Traders were anxiously awaiting jobs data last week. First, it was a solid ADP employment report on Wednesday morning that helped to lift U.S. equities. But the biggie was on Friday and we all held our collective breath as the numbers were...
READ MORE
MEMBERS ONLY

Markets, News and the Percentage of Stocks above the 50-day EMA
by Arthur Hill,
Chief Technical Strategist, TrendInvestorPro.com
* Markets and News.
* S&P 500 Gets Oversold Bounce.
* %Above 200-day EMA Plunges.
* Range Change for %Above 20-day EMA.
* %Above 50-day EMA Forms Small Divergence.
... Markets and News
...Writing a market commentary before the election seems a bit foolhardy, but the election results do not figure into my analysis....
READ MORE
MEMBERS ONLY
3 Upcoming Earnings Reports I Can't Wait To See
by Tom Bowley,
Chief Market Strategist, EarningsBeats.com
I'm not a fan of buying (or short selling) stocks and holding them into quarterly earnings reports. It's simply too difficult to manage risk. Yes, there are options strategies that you can employ to reduce risk so we could debate back and forth the merits of...
READ MORE
MEMBERS ONLY
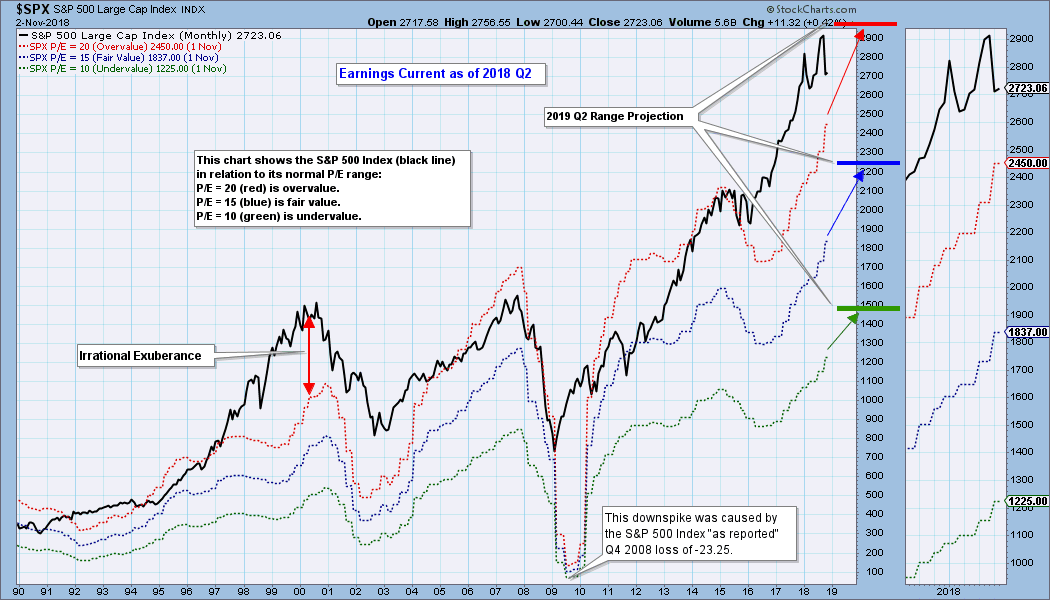
Market Overvalued Even on Forward Earnings
by Carl Swenlin,
President and Founder, DecisionPoint.com
Charts of fundamental data are as useful as price charts in helping us visualize fundamental context and trends. In the case of earnings, the following chart shows us where the S&P 500 would have to be in order to have an overvalued P/E of 20 (red line)...
READ MORE
MEMBERS ONLY
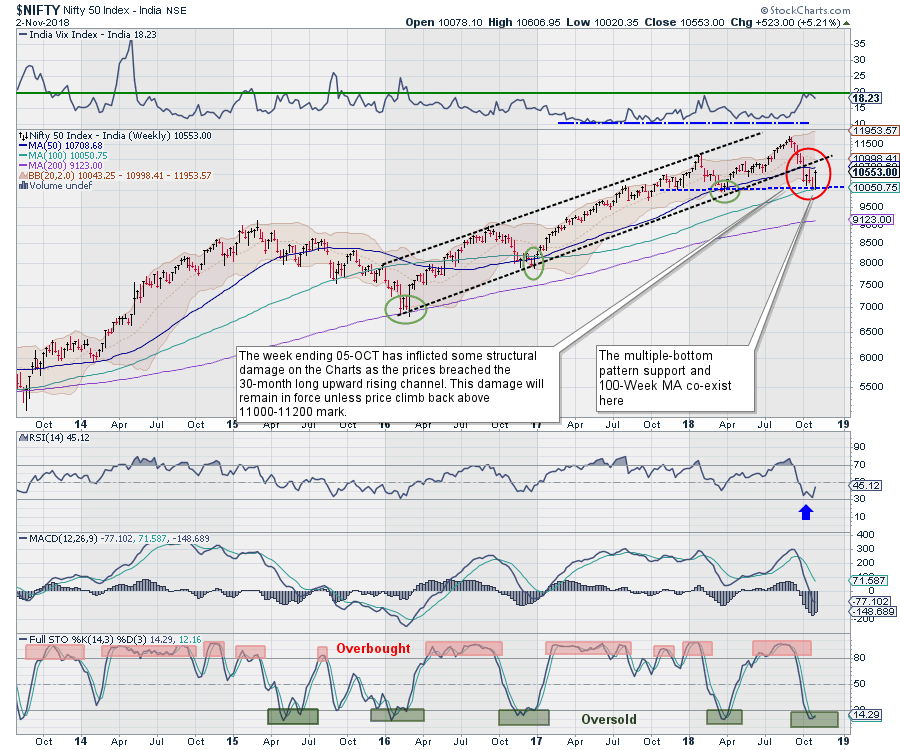
Week Ahead for Nifty: Markets likely to remain broadly range bound amid truncated week and festivities
by Milan Vaishnav,
Founder and Technical Analyst, EquityResearch.asia and ChartWizard.ae
In our previous Weekly Note, we had mentioned that despite remaining structurally damaged, the Equities might witness a technical pullback. The levels of 10026 which was the Weekly 100-Week MA last week (which is 10050 presently), acted as a support for the Markets. The benchmark Index NIFTY50 witnessed a much...
READ MORE
MEMBERS ONLY
Introducing Brian Livingston And His New StockCharts Blog, "Muscular Investing"

by Grayson Roze,
Chief Strategist, StockCharts.com
To kick off the new month, I'm thrilled to announce another all-star addition to our StockCharts commentary team. Brian Livingston, author of the recently-released book Muscular Portfolios, will be sharing his investing insights and money management wisdom through a new weekly blog, Muscular Investing.
Brian's background...
READ MORE
MEMBERS ONLY
DP weekly Wrap: Not a Good BUY Signal
by Carl Swenlin,
President and Founder, DecisionPoint.com
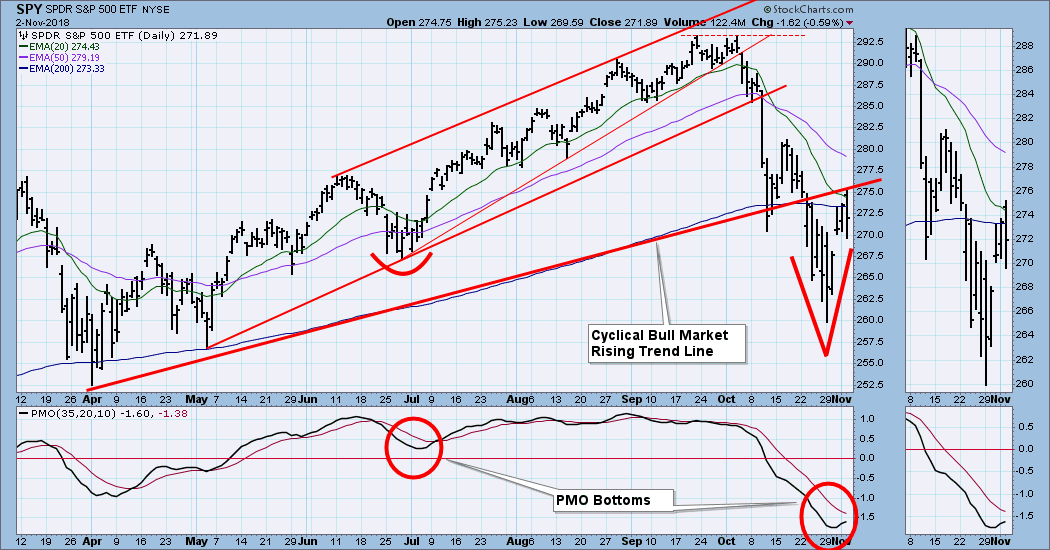
In the Weekly Wrap I have been saying that a short-term buy of SPY should not be considered until the daily PMO turns up. As it happens, the PMO turned up on Thursday, but I must confess that I wasn't thrilled. When the Price Momentum Oscillator (PMO) turns...
READ MORE
MEMBERS ONLY

A Precious Metal that Actually Acts Precious
by Arthur Hill,
Chief Technical Strategist, TrendInvestorPro.com
Gold, silver and platinum suffered selling pressure over the last few years, but palladium attracted buying pressure and outperformed. It is one of the few precious metals trading near a 52-week high and in a long-term uptrend.
The first chart shows three year performance for the continuous futures contracts for...
READ MORE
MEMBERS ONLY
Big Drop in Apple Hurts Tech Sector and The Nasdaq Which Are Leading Today's Stock Retreat
by John Murphy,
Chief Technical Analyst, StockCharts.com
Editor's Note: This article was originally published in John Murphy's Market Message on Friday, November 2nd at 12:28pm ET.
It's usually not a good sign when the market's biggest stock takes a big hit. That's especially true when it...
READ MORE
MEMBERS ONLY
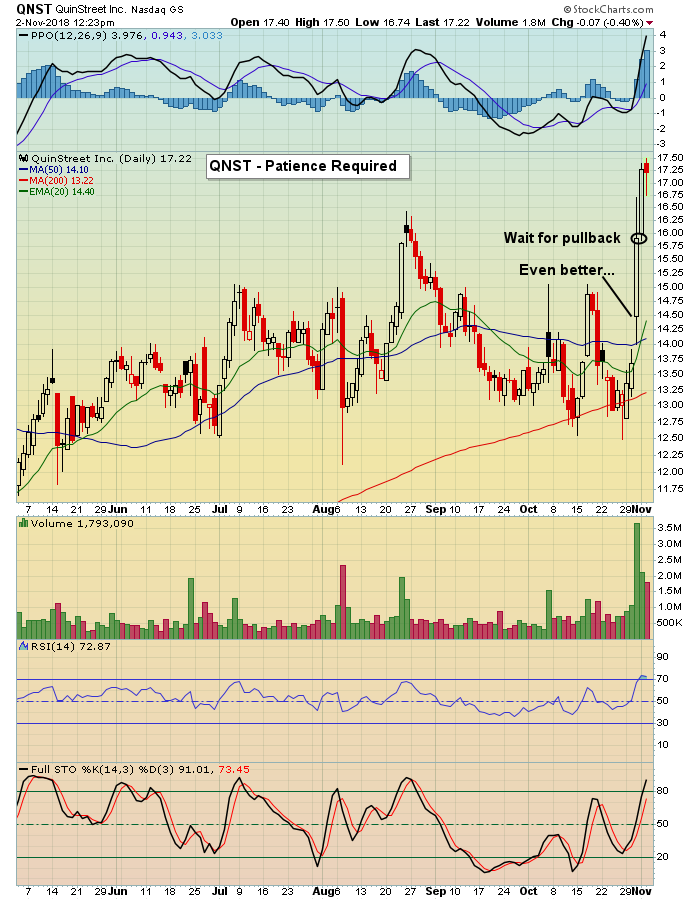
Be Prepared to Pounce on the "Best of the Best"

by John Hopkins,
President and Co-founder, EarningsBeats.com
We're deep into earnings season, which means patient traders can put themselves into a position to profit handsomely. The process starts by identifying those companies that beat earnings expectations and gap up sharply on strong volume, because these are the types of stocks that traders will be watching...
READ MORE
MEMBERS ONLY
Two stocks in the Consumer Staples sector that could offer shelter when needed.
by Julius de Kempenaer,
Senior Technical Analyst, StockCharts.com
In this blog post, I want to do a quick top-down analysis to arrive at a few stocks that could help investors to provide shelter in case the current hiccup in the market is ..... well a "hiccup."
The Relative Rotation Graph above shows the rotation of various asset...
READ MORE
MEMBERS ONLY

BIG DROP IN APPLE HURTS TECH SECTOR AND THE NASDAQ WHICH ARE LEADING TODAY'S STOCK RETREAT -- BOTH MAY BE FAILING TESTS OF THEIR 200-DAY AVERAGES -- THE S&P 500 IS ALSO STALLING AT MOVING AVERAGE LINES -- HOURLY BARS SHOW OVERHEAD RESISTANCE BARRIERS
by John Murphy,
Chief Technical Analyst, StockCharts.com
APPLE FALLS ON GOOD NEWS ... It's usually not a good sign when the market's biggest stock takes a big hit. That's especially true when it happens the day after the company reported its fourth consecutive quarter of record revenue and profits. But that'...
READ MORE
MEMBERS ONLY

Survey Results: The Top 10 Reasons Investors Told Us Why Routines and Organized ChartLists Matter

by Gatis Roze,
Author, "Tensile Trading"
In our last Traders Journal blog, Grayson and I extended an invitation to our readers to share their experiences with the Tensile Trading ChartPack. The spectrum of responses was diverse, broad and extremely insightful. We found it motivational and encouraging that so many investors have “found their stride”, as one...
READ MORE
MEMBERS ONLY
Apple (AAPL) Disappoints, But Nonfarm Payrolls Soar Past Estimates
by Tom Bowley,
Chief Market Strategist, EarningsBeats.com
Market Recap for Thursday, November 1, 2018
The U.S. Dollar Index ($USD) absorbed its largest decline in several months and that finally triggered buying in the materials sector (XLB, +2.81%). Gold ($GOLD) was a big beneficiary for sure as it climbed nearly 2%, one of its largest advances...
READ MORE
MEMBERS ONLY

Comparing The Differences Between The February And October Declines
by Martin Pring,
President, Pring Research
* Key moving averages violated in October
* The world peaked in January
* What happened to sectors and breadth?
* February versus October conclusion
* Those pesky bonds
Key Moving Averages Violated in October
So far, 2018 has seen two sharp shakeouts in the market, specifically the ten-day special in early February and the...
READ MORE
MEMBERS ONLY

Weekly Market Review & Outlook (with video) - Assessing October
by Arthur Hill,
Chief Technical Strategist, TrendInvestorPro.com
* Assessing the Damage in October.
* Testing the 10 and 12 Month MAs.
* S&P 500 Breaks Key Moving Average.
* Bonds Decline along with Stocks.
* Global Stocks Are Weak.
* REITs are Holding Up, But.
* Commodities Weaken.
* Gold Holds Breakdown on Monthly Chart.
* Dollar Strengthens against Euro.
* Note from the Art&...
READ MORE
MEMBERS ONLY
Advantages and Disadvantages of Using Breadth

by Greg Morris,
Veteran Technical Analyst, Investor, and Author
Consider a period of distribution (market topping process) such as 1987, 1999, 2007, 2011, etc. As an uptrend slowly ends and investors seek safety, they do so by moving their riskier holdings such as small cap stocks, into what is perceived to be safer large cap and blue-chip stocks. This...
READ MORE
MEMBERS ONLY
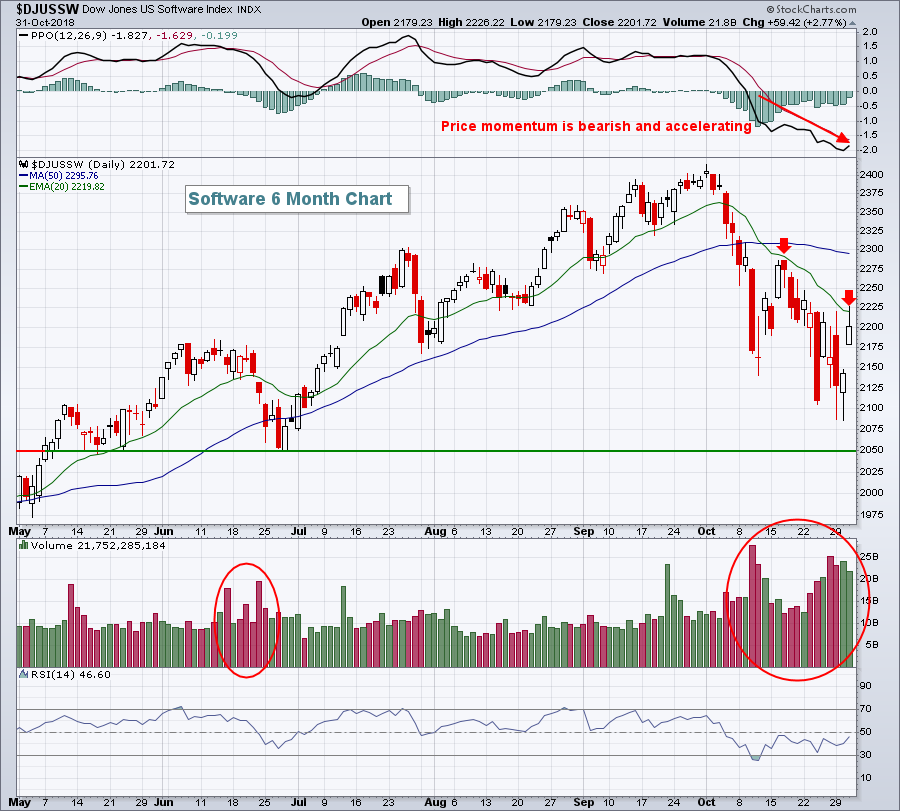
Software Hits Key Resistance....And Fails; S&P 500 Shares Similar Fate
by Tom Bowley,
Chief Market Strategist, EarningsBeats.com
Market Recap for Wednesday, October 31, 2018
Let's start with the positives from Wednesday's action. First, all of our major indices rebounded and finished higher on the session, led by the more aggressive NASDAQ and NASDAQ 100. These two indices had been crushed both on an...
READ MORE
MEMBERS ONLY
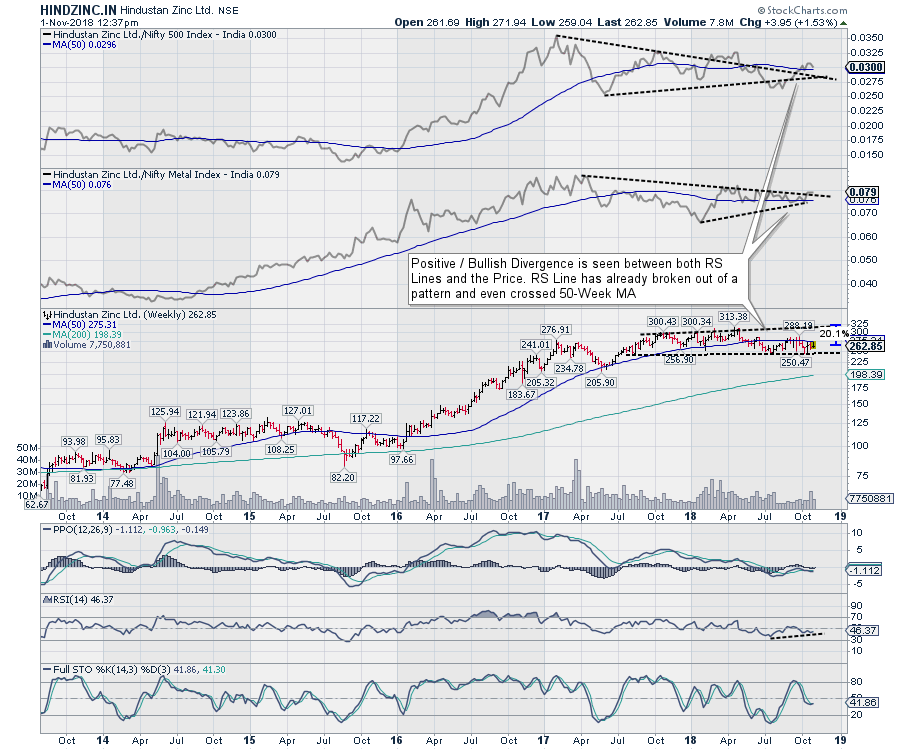
Follow-Up on Stock discussed on Oct 30 because of Corporate Action
by Milan Vaishnav,
Founder and Technical Analyst, EquityResearch.asia and ChartWizard.ae
On October 30, we discussed on three stocks on NIFTY Metal Index ($CNXMETAL) that deserved our attention. This note can be found here. There was a Corporate Action yesterday, i.e. on Oct. 31, in the stock Hindustan Zinc Limited (HINDZINC.IN) that of a Dividend payout. This has resulted...
READ MORE
MEMBERS ONLY
DP Alert: Monthly Charts Go "Final"
by Erin Swenlin,
Vice President, DecisionPoint.com
It's been some time since I've written about the monthly charts. Carl usually is the lucky one to cover them given the end of the month often hits on a Friday when he writes the Weekly Wrap. I thought today I'd cover the monthly...
READ MORE
MEMBERS ONLY

SHORT-TERM STOCK BOTTOM APPEARS TO BE IN PLACE -- SMALL AND MIDCAP INDEXES BOUNCE OFF FEBRUARY LOWS -- S&P 500 BOUNCES OFF SUPPORT -- AND MAY BE HEADING FOR A RETEST OF ITS 200-DAY AVERAGE
by John Murphy,
Chief Technical Analyst, StockCharts.com
SMALL AND MIDCAP STOCKS INDEXES BOUNCE OFF FEBRUARY LOWS... A lot of technical signs point to a short-term bottom in place for stocks. That suggests that major stock indexes will try to regain some of their October losses. The big question is how much of those losses. Before getting to...
READ MORE
MEMBERS ONLY

Campbell Soup is Looking Rather Bland
by Arthur Hill,
Chief Technical Strategist, TrendInvestorPro.com
Soup season is upon us, but Campbell Soup ($CPB) is having none of it as the stock trends lower and lags its sector, the Consumer Staples SPDR (XLP).
First and foremost, the long-term trend is down with a 52-week low in June, the 50-day below the 200-day and the 200-day...
READ MORE
MEMBERS ONLY
Relief Rally Begins, How Long Might This Last?
by Tom Bowley,
Chief Market Strategist, EarningsBeats.com
Market Recap for Tuesday, October 30, 2018
Today's article will be limited as I'm having technical difficulties sharing charts, but I'll give you my thoughts. Yesterday's action and reversal was important as our volatility measures - VIX and VXN - are at...
READ MORE