MEMBERS ONLY

Bottoms Up Part II

by Martin Pring,
President, Pring Research
* Positive breadth characteristics
* VIX is less fearful
* Short-term oscillators starting to get extremely oversold
* How about trend?
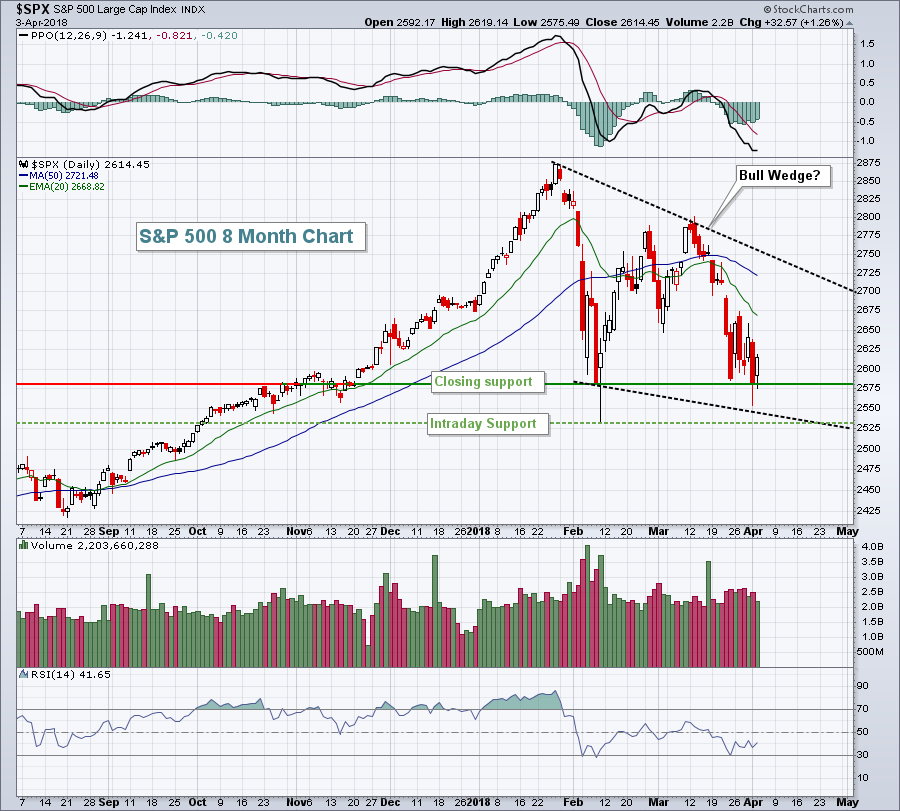
Last week I suggested that the market may be in the process of forming a double bottom. This week we take that possibility one step forward. Whenever the non-financial cable networks run a...
READ MORE
MEMBERS ONLY
A Volatility War Has Been Declared

by Tom Bowley,
Chief Market Strategist, EarningsBeats.com
Special Note
I typically post a blog article every day that the U.S. stock market is open. If you'd like to receive my blog articles as soon as they're published, you can subscribe (for FREE) by scrolling to the bottom of this article, typing your...
READ MORE
MEMBERS ONLY
Market Round Up April 2018
by Martin Pring,
President, Pring Research
Here is a link to the April edition of Market Round Up for 2018.
Martin-Pring-Market-Roundup-April-2018 from StockCharts.com on Vimeo.
Good luck and good charting,
Martin J. Pring
The views expressed in this article are those of the author and do not necessarily reflect the position or opinion of Pring...
READ MORE
MEMBERS ONLY
General Comments on Trend Following

by Greg Morris,
Veteran Technical Analyst, Investor, and Author
Since there are many new readers, I thought an overview on trend following might be appropriate. As I have stated often, I use a market analysis methodology called trend following. Sometimes it should be called trend continuation. Why? My trend analysis works on the thoroughly researched concept that once a...
READ MORE
MEMBERS ONLY
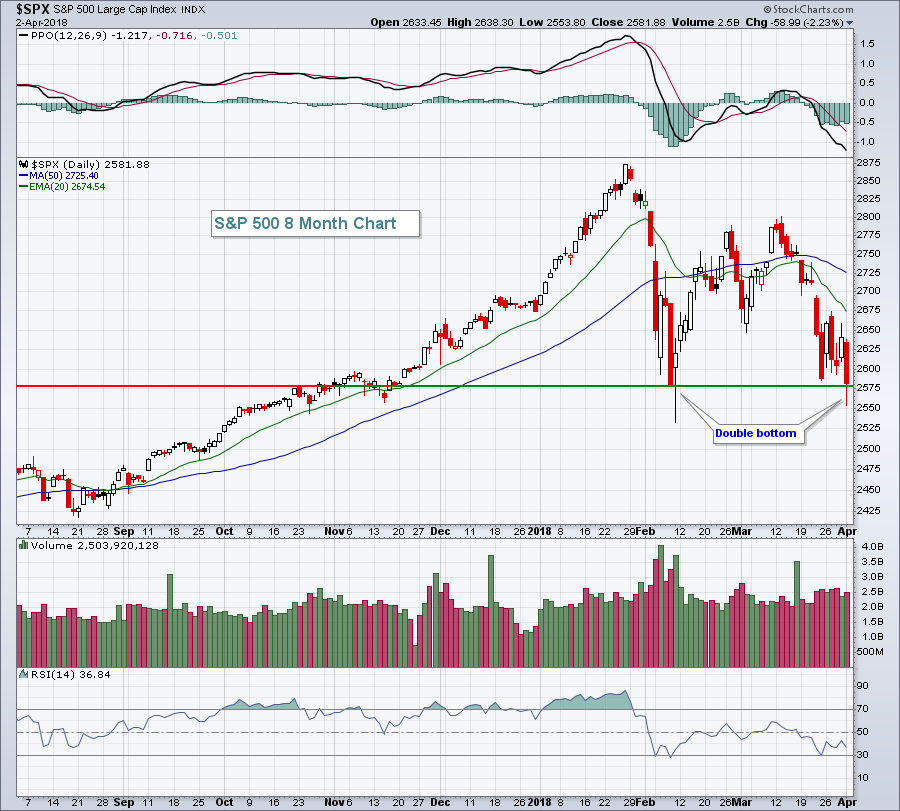
U.S. Stocks Slide As S&P 500 Prints Double Bottom
by Tom Bowley,
Chief Market Strategist, EarningsBeats.com
Market Recap for Monday, April 2, 2018
It was a big down day on Wall Street with eight of nine sectors down 2% or more. Only the defensive utilities (XLU, -0.77%) were able to minimize its losses, with the more aggressive consumer discretionary (XLY, -2.82%) and technology (XLK,...
READ MORE
MEMBERS ONLY
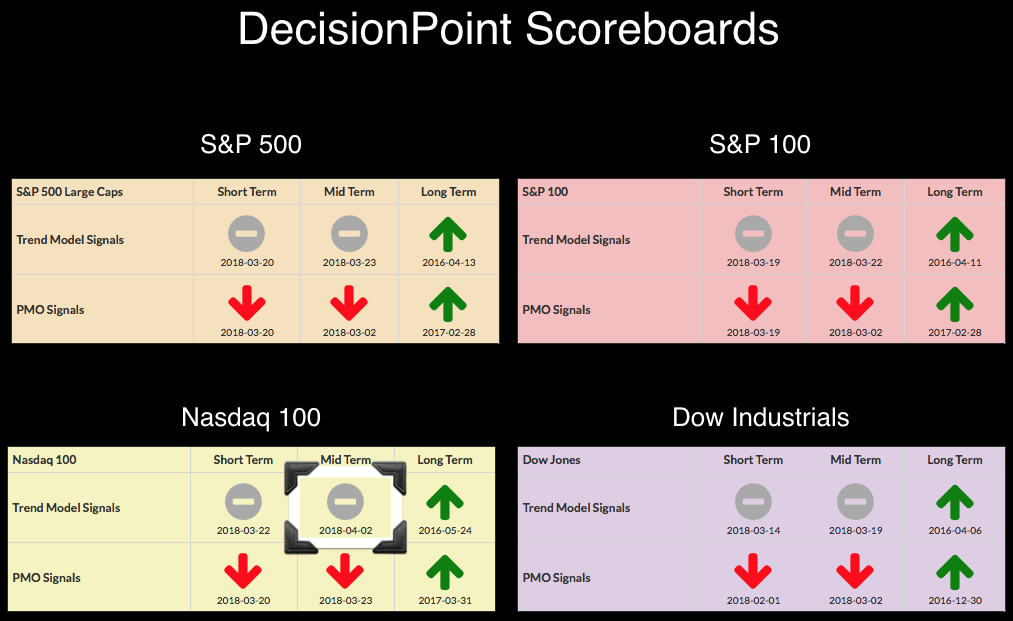
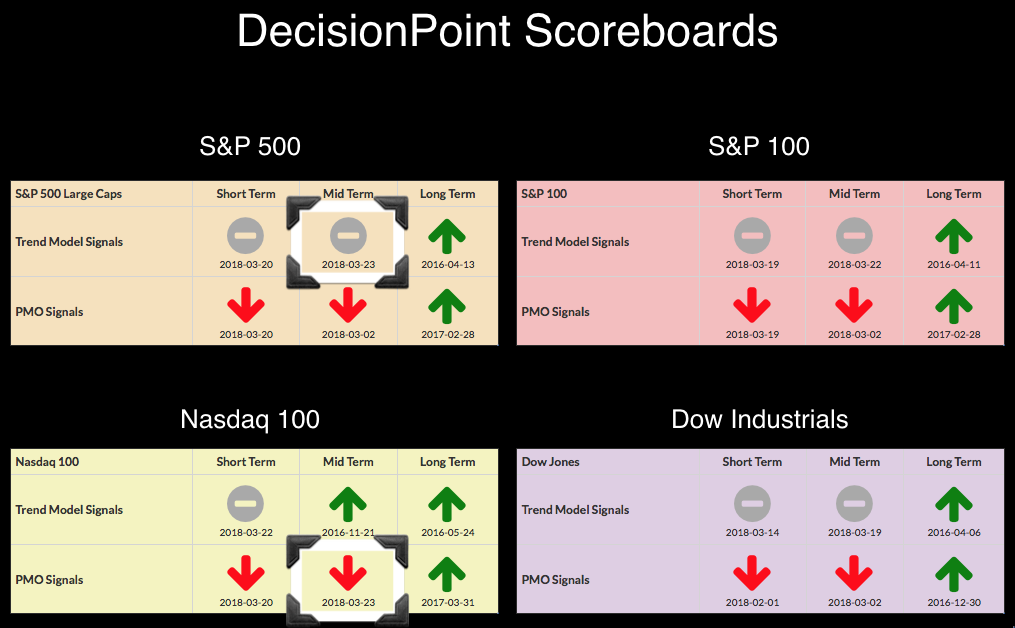
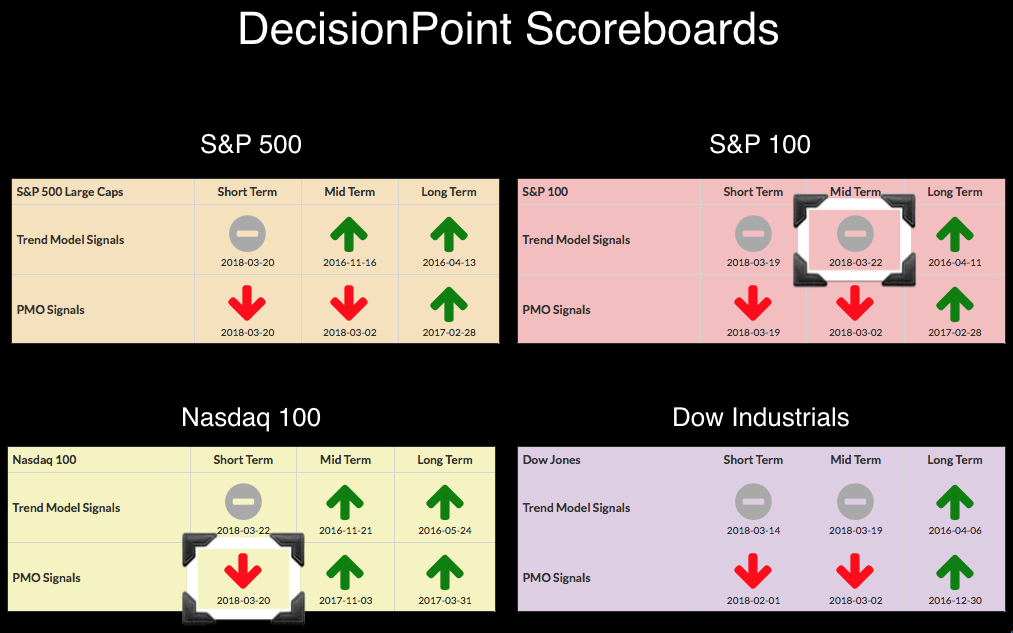
Intermediate-Term Trend Model NEUTRAL Triggered on NDX - No ITTM BUY Signals on SPDRs

by Erin Swenlin,
Vice President, DecisionPoint.com
Today the NDX succumbed to peer pressure and dropped its Intermediate-Term Trend Model BUY signal. The Scoreboards below are clear: Long term has a bullish bias, but serious damage has been done in the short and intermediate terms.
The IT Trend Model signals are based on 20/50-EMA crossovers in...
READ MORE
MEMBERS ONLY

STOCKS START THE SECOND QUARTER UNDER HEAVY SELLING -- 200-DAY MOVING AVERAGES ARE BEING THREATENED -- ALL MARKET SECTORS END IN THE RED -- CONSUMER DISCRETIONARY AND TECHNOLOGY STOCKS ARE AMONG BIGGEST LOSERS

by John Murphy,
Chief Technical Analyst, StockCharts.com
MAJOR STOCK INDEXES RETEST UNDERLYING SUPPORT LEVELS ... Stocks started the second quarter under heavy selling pressure. Some major stock indexes saw losses in excess of 2%. Today's selling is resulting in retests of important underlying support levels. Chart 1 shows the Dow Industrials touching its 200-day average but...
READ MORE
MEMBERS ONLY

DSW Takes the Lead with a New High

by Arthur Hill,
Chief Technical Strategist, TrendInvestorPro.com
The S&P 500 is well below its January high and trading near its February low. DSW, in contrast, hit a 52-week high last week and is clearly leading the market.
The chart shows DSW with a choppy advance from mid August to mid November and then a choppy...
READ MORE
MEMBERS ONLY

The Range Narrows on the S&P 500 - Plus 3 ETFs, Energy and 5 Stocks
by Arthur Hill,
Chief Technical Strategist, TrendInvestorPro.com
* A Narrowing Range for the S&P 500.
* A Bearish Pennant or Higher Low?
* Not Always the End of the World.
* Three Industry Group ETFs to Watch (ITA, ITB, IAI).
* Energy ETFs Continue Consolidation.
* Stocks to Watch (APC, HAL, MSFT, INTC, ATVI).
A Narrowing Range for the S&...
READ MORE
MEMBERS ONLY
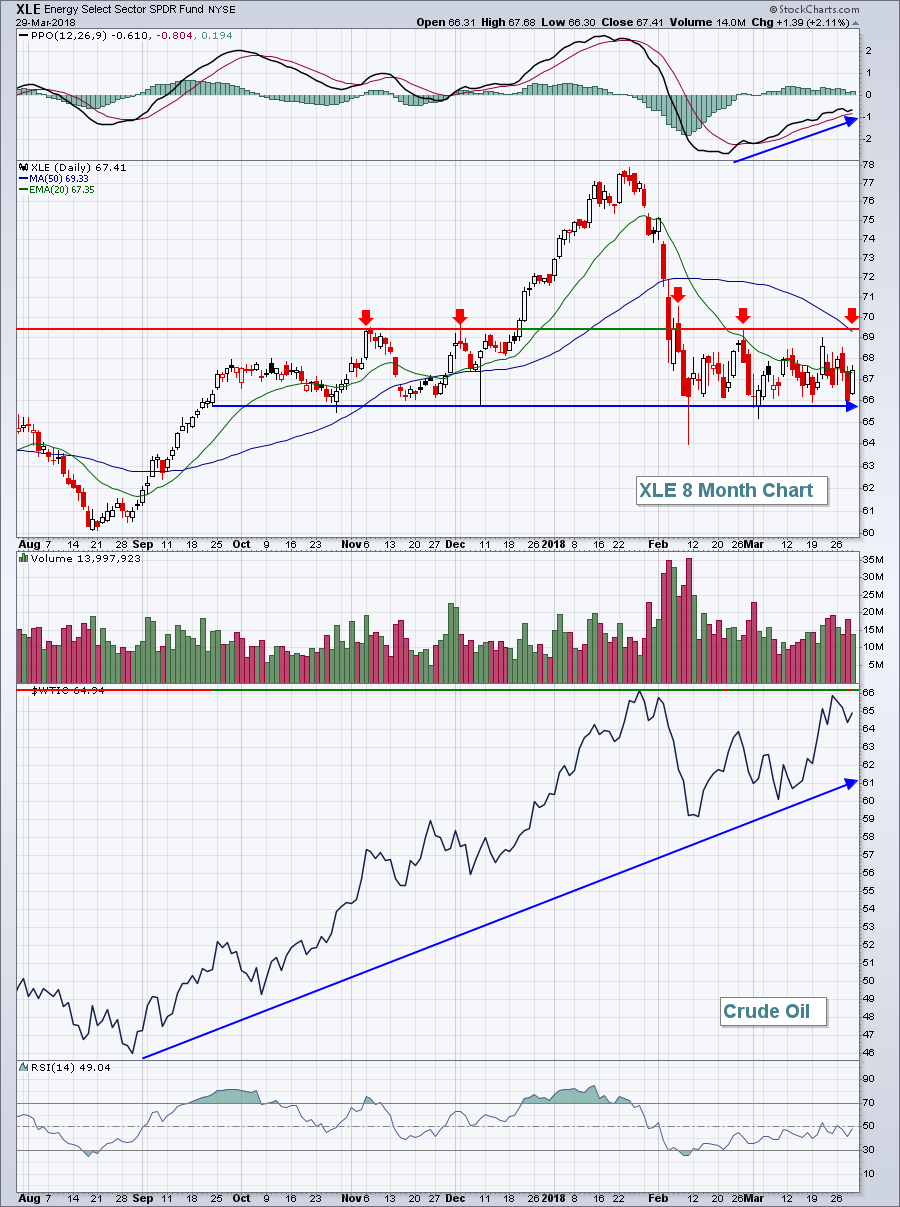
Energy Bounces Off Of Rock Solid Support......Again
by Tom Bowley,
Chief Market Strategist, EarningsBeats.com
Market Recap for Thursday, March 29, 2018
The energy ETF (XLE, +2.11%) surged off of key price support at 66.00 and there's reason to believe that this rally could last a bit longer. Crude oil prices ($WTIC) outperformed the XLE during the month of March and...
READ MORE
MEMBERS ONLY

Detect Rotation with PnF Charts

by Bruce Fraser,
Industry-leading "Wyckoffian"
The winds are shifting in the financial markets. Often Point and Figure charts offer a perspective that other chart types might obscure. Point and Figure chart construction is minimalistic. It keeps the important price swings and discards the rest. PnF charting lends itself to techniques for estimating price objectives from...
READ MORE
MEMBERS ONLY

Putting things into perspective for the FB face-plant

by Julius de Kempenaer,
Senior Technical Analyst, StockCharts.com
Facebook has been making headlines recently. Not only in the newspapers and online news services but also in some of the blogs at Stockcharts.com.
With hindsight everything is easy and we can find many “signals” that “would have” given us early warning signals that we “should” have seen and...
READ MORE
MEMBERS ONLY

THE FIRST QUARTER WASN'T THAT BAD FOR STOCKS -- THE VANGUARD TOTAL STOCK MARKET ETF LOST LESS THAN 1% -- SOCIAL MEDIA ETF IS BOUNCING OFF CHART SUPPORT -- SO IS AN ETF OF BANK STOCKS -- GLOBAL X COPPER MINERS ETF BOUNCES OFF ITS 200-DAY AVERAGE
by John Murphy,
Chief Technical Analyst, StockCharts.com
VANGUARD TOTAL STOCK MARKET ETF LOST LESS THAN 1%... Despite all the volatility during the first quarter, the first three months of 2018 weren't really that bad. The Dow Industrials were the biggest losers with a quarterly drop of -2.5%. The broader S&P 500 Index...
READ MORE
MEMBERS ONLY

Why ETFs Are Best-of-Breed for Only 50% of Your Asset Classes

by Gatis Roze,
Author, "Tensile Trading"
Investors have once again been misled by the media, bamboozled by Blackrock, duped and frisked by the financial community. Exchange traded funds (ETFs) are not the panacea for every asset class as they all want you to believe they are.
In my own portfolio, approximately 45% of my asset classes...
READ MORE
MEMBERS ONLY

Weekly Market Review & Outlook - Green Shoots Appearing
by Arthur Hill,
Chief Technical Strategist, TrendInvestorPro.com
* To Bounce or Not To Bounce.
* %Above 200-day EMA at Inflection Point.
* Fewer New Lows in March.
* Seasonality is Quite Bullish in April.
* A Big Triangle for the S&P 500.
* Playing the Swings within the Triangle.
* QQQ is Not Broken.
* Small-caps are Showing Relative Strength.
* Gold Falls back...
READ MORE
MEMBERS ONLY
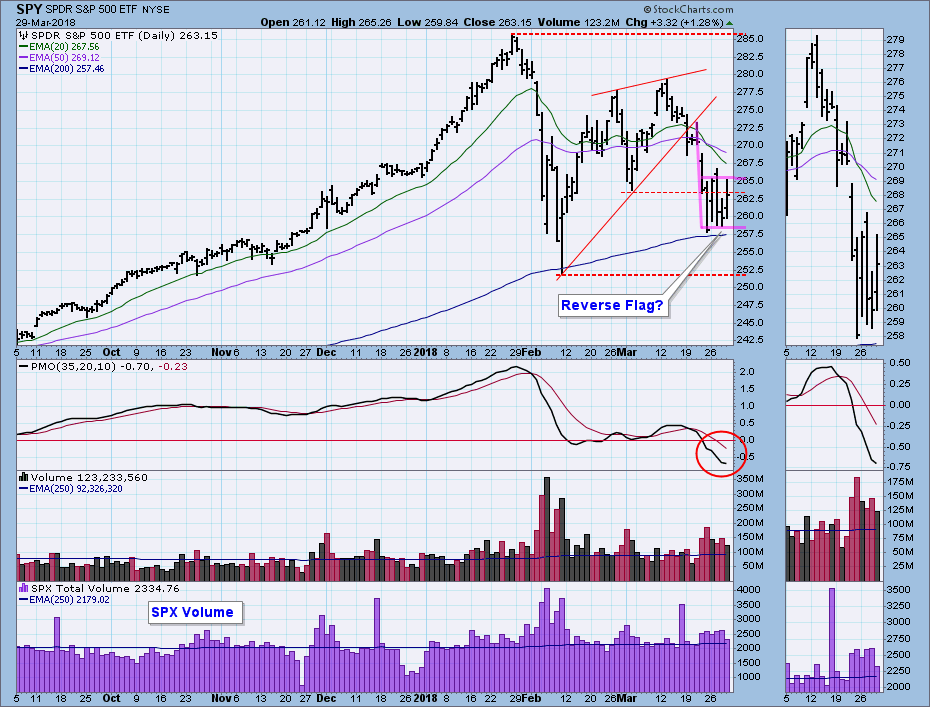
DP Weekly/Monthly Wrap: Is That a Reverse Flag?

by Carl Swenlin,
President and Founder, DecisionPoint.com
Last week the market broke down from a rising wedge pattern and dove into a scary decline. This week was choppy and wild, but price stayed within a somewhat ragged range that looks to me like a bearish reverse flag formation. Price remained above the 200EMA, and every day volume...
READ MORE
MEMBERS ONLY

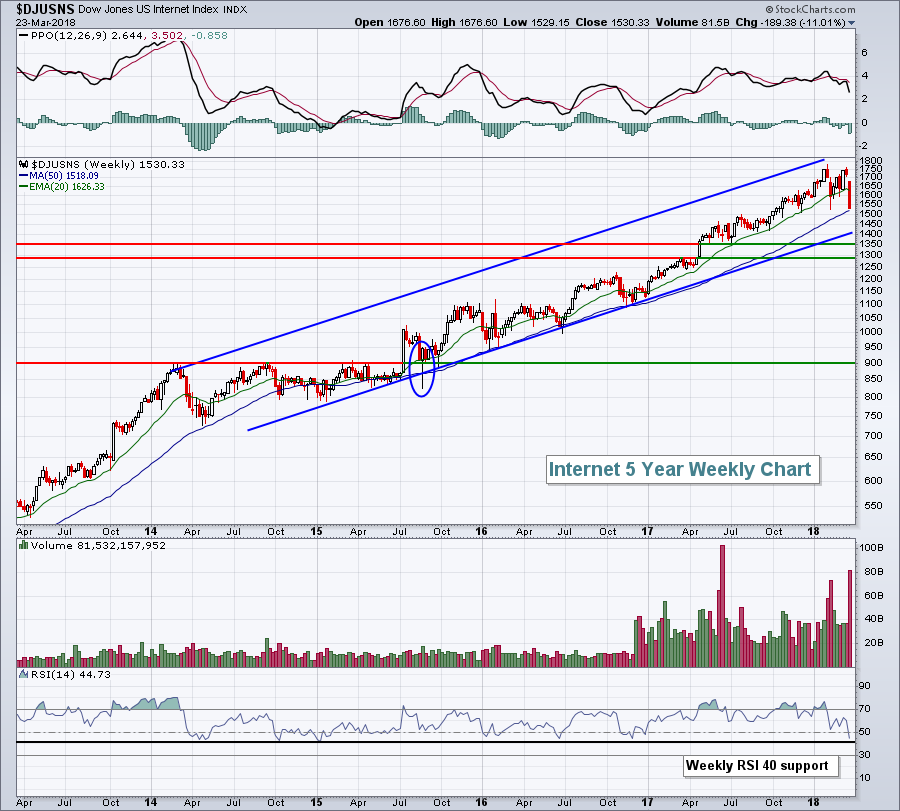
Bottoms Up?
by Martin Pring,
President, Pring Research
* Is the market forming a double bottom?
* Short-term indicators suggest the bottoming process is nearly complete
Sometimes a technical event or characteristic becomes very popular very quickly as a lot of people write and blog about them. Usually, the expectations based on those forecasts are not met. For example, every...
READ MORE
MEMBERS ONLY

SystemTrader - Putting the Put-Call Ratio Through the Wringer
by Arthur Hill,
Chief Technical Strategist, TrendInvestorPro.com
* Introduction and Overview.
* A Historical Look at the Ratio.
* Put Volume Surges to Multi-year Levels.
* The Eye-Ball Signals.
* Putting Together a System.
* Running the Numbers.
* Conclusions.
...The Put-Call Ratio is getting a lot of attention lately so I took a stab at building a trading system around this indicator.
Sentiment...
READ MORE
MEMBERS ONLY
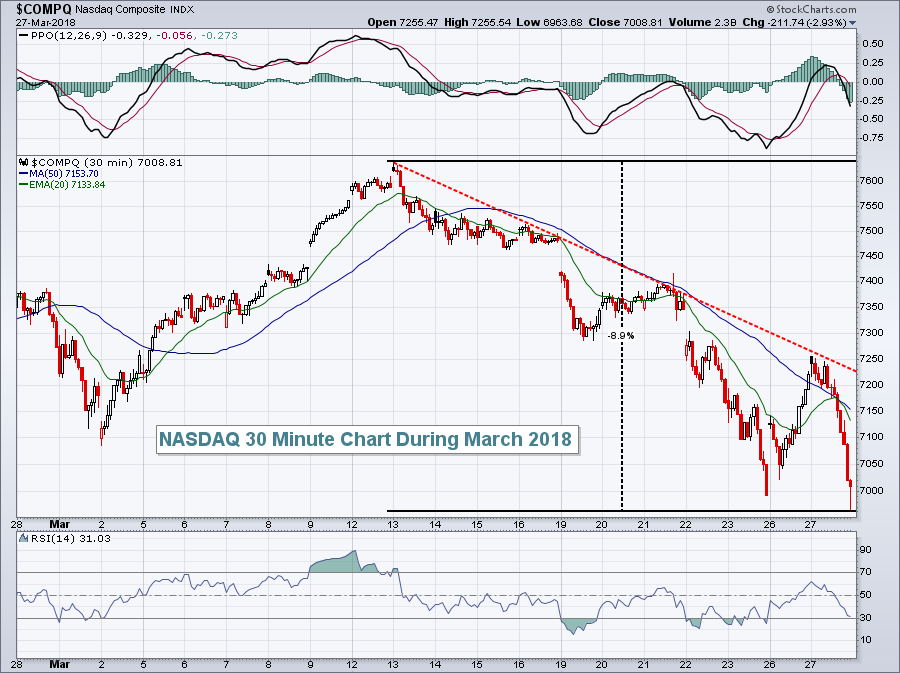
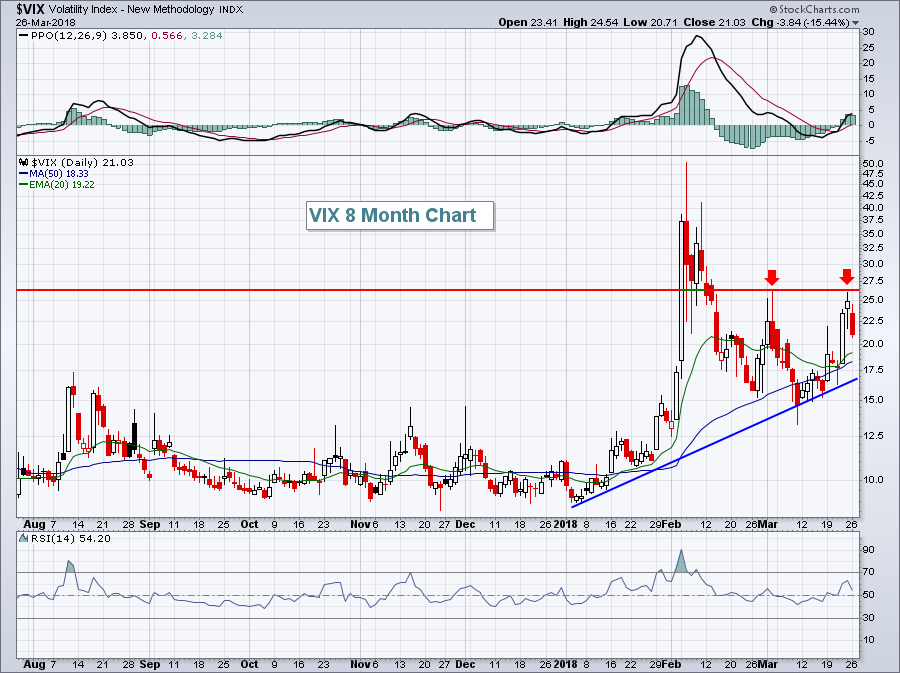
Wednesday's Reversal In NASDAQ 100 Volatility Gauge Could Signal End Of Selling
by Tom Bowley,
Chief Market Strategist, EarningsBeats.com
Market Recap for Wednesday, March 28, 2018
The U.S. stock market settled down on Wednesday and that could be very good news for the bulls. High volatility ($VIX) has stunned equity traders the past two months after a 15 month period of little volatility. But on Wednesday, the VIX...
READ MORE
MEMBERS ONLY
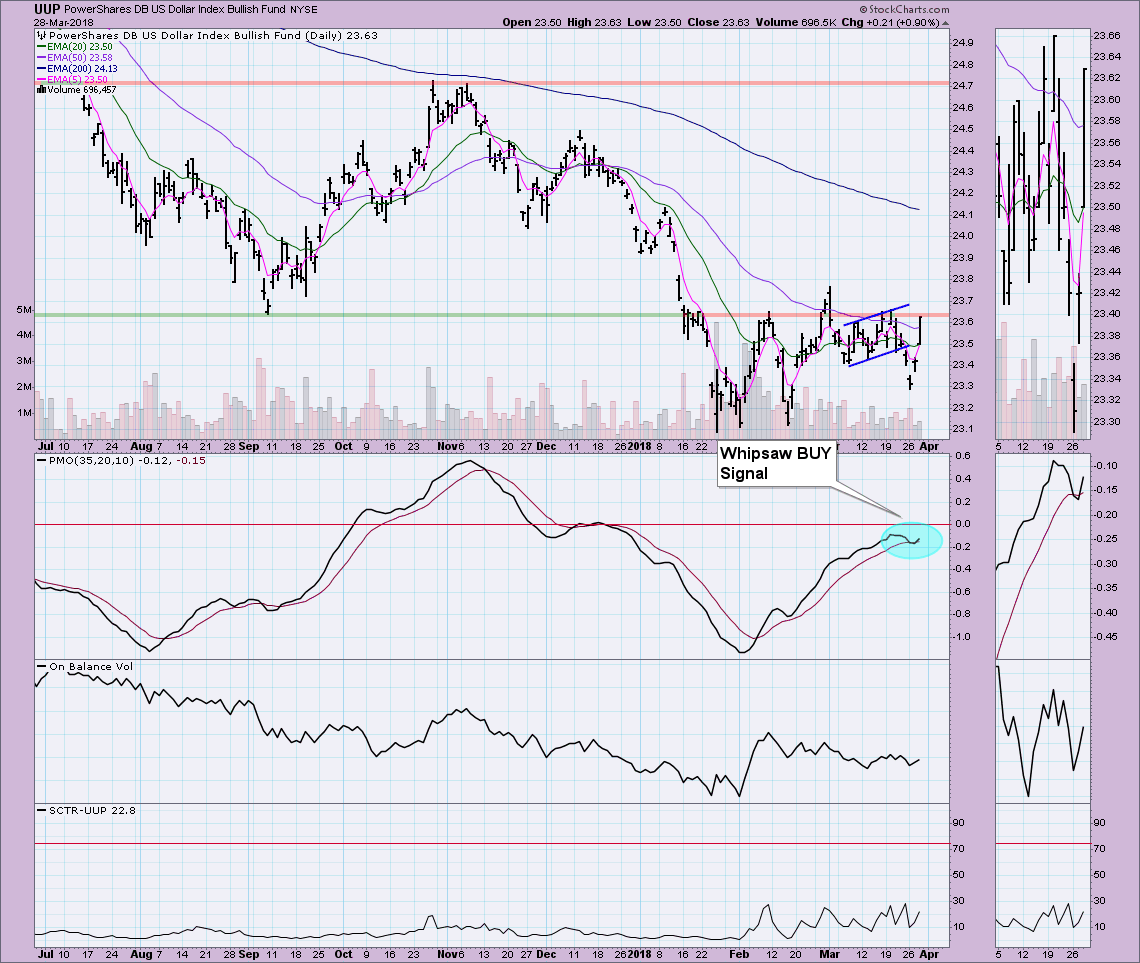
New ST PMO BUY Signal for UUP - Sector Rotation On Defense
by Erin Swenlin,
Vice President, DecisionPoint.com
The Dollar has been poised for a breakout for some time. The PMO has been rising nicely, but UUP has been banging its head on overhead resistance with not much success. Looking at the big picture, relative strength has been shuffling toward defensive sectors like Consumer Staples and Utilities which...
READ MORE
MEMBERS ONLY

MAJOR US STOCK INDEXES ARE TRYING TO STABILIZE NEAR 200-DAY AVERAGES AND FEBRUARY LOW -- TECHNOLOGY STOCKS ARE WEIGHING ON THE MARKET -- ESPECIALLY FAANG STOCKS -- BUT FACEBOOK LOOKS OVERSOLD WHILE ALPHABET IS TESTING CHART SUPPORT
by John Murphy,
Chief Technical Analyst, StockCharts.com
DOW AND THE S&P 500 ARE RETESTING 200-DAY LINES ... The Dow and the S&P 500 are still in the process of retesting underlying support levels near their 200-day averages and February lows. Chart 1 shows the Dow Industrials retesting its February intra-day low at 23,400...
READ MORE
MEMBERS ONLY

Pfizer Bounces within Uptrend
by Arthur Hill,
Chief Technical Strategist, TrendInvestorPro.com
The pickings are slim as the market corrects and may charts turn ugly. I am noticing some strength in big pharma with Merck (MRK) up in March and Pfizer (PFE) holding above the early February low (so far).
The chart shows PFE with a zigzag uptrend since June. The stock...
READ MORE
MEMBERS ONLY
FAANG Stocks Slammed, NASDAQ Plummets
by Tom Bowley,
Chief Market Strategist, EarningsBeats.com
Market Recap for Tuesday, March 27, 2018
I've discussed since early February the difficulty in trading a market with an elevated Volatility Index ($VIX). While returns can be awesome when you make great calls, the opposite is true when your timing is less than perfect. Here's...
READ MORE
MEMBERS ONLY
Technology And Financials Bounce Back Strongly, U.S. Equities Surge
by Tom Bowley,
Chief Market Strategist, EarningsBeats.com
Market Recap for Monday, March 26, 2018
It was an impressive rally on Wall Street on Monday. All nine sectors advanced at least 1%. The four aggressive sectors - technology (XLK, +3.80%), financials (XLF, +3.24%), consumer discretionary (XLY, +2.95%) and industrials (XLI, +2.42%) - were the...
READ MORE
MEMBERS ONLY
SPX and XLF Trigger IT Trend Model Neutral on Friday and NDX Loses IT PMO BUY Signal
by Erin Swenlin,
Vice President, DecisionPoint.com
After day with the SPX up 2.72% and the NDX up 3.78%, it may seem strange to be talking about the loss of BUY signals on the DecisionPoint Scoreboards. My answer is that one day does not a bull market make. However, I'm not on board...
READ MORE
MEMBERS ONLY

S&P 500 Notebook
by Bruce Fraser,
Industry-leading "Wyckoffian"
I make lots of notes on my charts. As conditions unfold I have a sense for what my thinking was and whether adjustments need to be made in tactics. In the ‘good old days’ stock charts were plotted by hand and notes were jotted onto charts; now we have wonderful...
READ MORE
MEMBERS ONLY
An RSI Failure Swing in Ross Stores
by Arthur Hill,
Chief Technical Strategist, TrendInvestorPro.com
The S&P 500 was shaken with a plunge below its 200-day SMA on Friday and this gives chartists a reference point to compare with other charts.
Personally, I do not think moving averages represent support or resistance levels. Moving averages provide price points that chartists can use to...
READ MORE
MEMBERS ONLY

SystemTrader - Would you have the Nerve? - Revisiting Mean-Reversion and Adding Leverage
by Arthur Hill,
Chief Technical Strategist, TrendInvestorPro.com
* Universe, Market Regime and Ground Rules.
* Know Your Indicators.
* Sample Signals for IJR and QQQ.
* Testing the Big Four.
* Plotting Equity and Drawdowns.
* Testing Four Leveraged ETFs.
* Conclusions and Caveat Emptor!
Introduction and Overview...
Stocks fell sharply the last two weeks and RSI became oversold for most major index ETFs....
READ MORE
MEMBERS ONLY
Very Weak Financials Drive Dow Jones To Lowest Close in 2018
by Tom Bowley,
Chief Market Strategist, EarningsBeats.com
Market Recap for Friday, March 23, 2018
All of our major indices tumbled on Friday, but none are struggling quite the same as the Dow Jones, which fell another 425 points on Friday to close at its lowest level since November 2017. There are likely three reasons for this relative...
READ MORE
MEMBERS ONLY

Aftcasting
by Greg Morris,
Veteran Technical Analyst, Investor, and Author
Wall Street is loaded with experts who make forecasts on the future market direction and market level many times a day. If you see a rather serious technical analyst on television, you can count on the talking head interviewer to ask him/her where the market is going. They must...
READ MORE
MEMBERS ONLY

THE ALL COUNTRY WORLD INDEX IS HEADED FOR A TEST OF FEBRUARY SUPPORT -- SO IS THE S&P 500 WHICH IS ALSO TESTING A TRENDLINE EXTENDING BACK TO THE START OF 2016 -- FINANCIALS AND TECHNOLOGY ARE THE BIGGEST SECTOR LOSERS
by John Murphy,
Chief Technical Analyst, StockCharts.com
WORLD STOCK INDEX HEADED FOR A TEST OF ITS FEBRUARY LOW AND ITS 200-DAY AVERAGE... Stocks around the world had a terrible week. Foreign stocks fell along with the U.S. That's not unusual since global stocks become tightly correlated on the way down. Selling in Chinese stocks...
READ MORE
MEMBERS ONLY
Interest Rates. How High?
by Bruce Fraser,
Industry-leading "Wyckoffian"
The Federal Reserve Bank (Fed) has indicated their intention to raise interest rates during 2018 and 2019. In fact, US Treasury interest rates have been rising for quite some time. We have been following the movement of bond prices with a Wyckoffian eye during this downtrend of prices (click here...
READ MORE
MEMBERS ONLY

Breadth: Weighing Active Bullish Signals Against New Bearish Signals
by Arthur Hill,
Chief Technical Strategist, TrendInvestorPro.com
* Another Bearish Breadth Thrust.
* High-Low Percent Indicators Remain Bullish.
* %Above 200-day Indicators Dip below 50%.
* Index Table Remains Bullish.
* Sector Breadth Highlights.
* Bottom Line: Still a Bull Market.
Breadth Overview ...
The following breadth assessment is based on three breadth indicators. First, the 10-day EMA of AD Percent is used to...
READ MORE
MEMBERS ONLY
DP Weekly Wrap: Sixteen-Month BUY Signal Ends
by Carl Swenlin,
President and Founder, DecisionPoint.com
This week the rising wedge we had identified resolved downward, as expected. Once that happened, we needed to provide a context that could help determine an initial downside target, so we focused on the double top confirmation line, drawn across the low between the tops. That line was violated on...
READ MORE
MEMBERS ONLY

Weekly Market Review & Outlook (with Video) - As the Roller Coaster Turns
by Arthur Hill,
Chief Technical Strategist, TrendInvestorPro.com
* The 2018 Roller Coaster Continues.
* High-Low Line Turns Down for XLY.
* SPY Leads the Wedge Break Downs.
* XLF, XLV, XLY and XLB Break Wedge Lines.
* When Oversold is Not Such an Opportunity.
* XLI Breaks Triangle Support.
* Breakaway Gaps for XLK.
* Gold Bounces off Support Zone.
* Oil Holds Breakout.
* Notes from...
READ MORE
MEMBERS ONLY
Trade War Fears Send U.S. Stocks Reeling
by Tom Bowley,
Chief Market Strategist, EarningsBeats.com
Market Recap for Thursday, March 22, 2018
Let me start today's article by saying that the stock market loathes uncertainty. Traders love boring small gains day after day with subtle, anticipated pullbacks to key moving averages or short-term price support levels. You can always tell when the stock...
READ MORE
MEMBERS ONLY

NYSE Composite Draws Closer To Its 200-day And 12-month Moving Averages
by Martin Pring,
President, Pring Research
* Breadth is more of a positive than a negative factor
* Global breadth is also positive
* Dow Diffusion Indicator close to a buy signal
* Consumer cyclicals versus technology
Since early February, the US equity market, in the form of the NYSE Composite, has been in a trading range. This is flagged...
READ MORE
MEMBERS ONLY
Climactic Indicators Suggest Dead Cat Bounce Ahead - NDX and OEX Neutral Signals
by Erin Swenlin,
Vice President, DecisionPoint.com
Two more BUY signals were lost on the DecisionPoint Scoreboards. We haven't seen the Intermediate-Term Trend Model Neutral signals on the Scoreboards in over a year. This consistent deterioration is worrisome and combined with bearish chart patterns and indicators, I'd have to say the correction is...
READ MORE
MEMBERS ONLY

DOW AND S&P 500 BREAK TRENDLINE SUPPORT -- NASDAQ 100 FALLS BELOW 50-DAY AVERAGE -- INTERNET SOCIAL MEDIA STOCKS CONTINUE TO LEAD TECHNOLOGY SECTOR LOWER -- TENCENT HOLDINGS REFLECTS HEAVY SELLING IN CHINESE STOCKS
by John Murphy,
Chief Technical Analyst, StockCharts.com
U.S. STOCK INDEXES BREAK SUPPORT LINES ... Major U.S. stock indexes are under heavy selling today and are breaking some important support lines. Chart 1 shows the Dow Industrials falling below a trendline extending back to early February. That signals a possible drop back to its February intra-day low...
READ MORE
MEMBERS ONLY
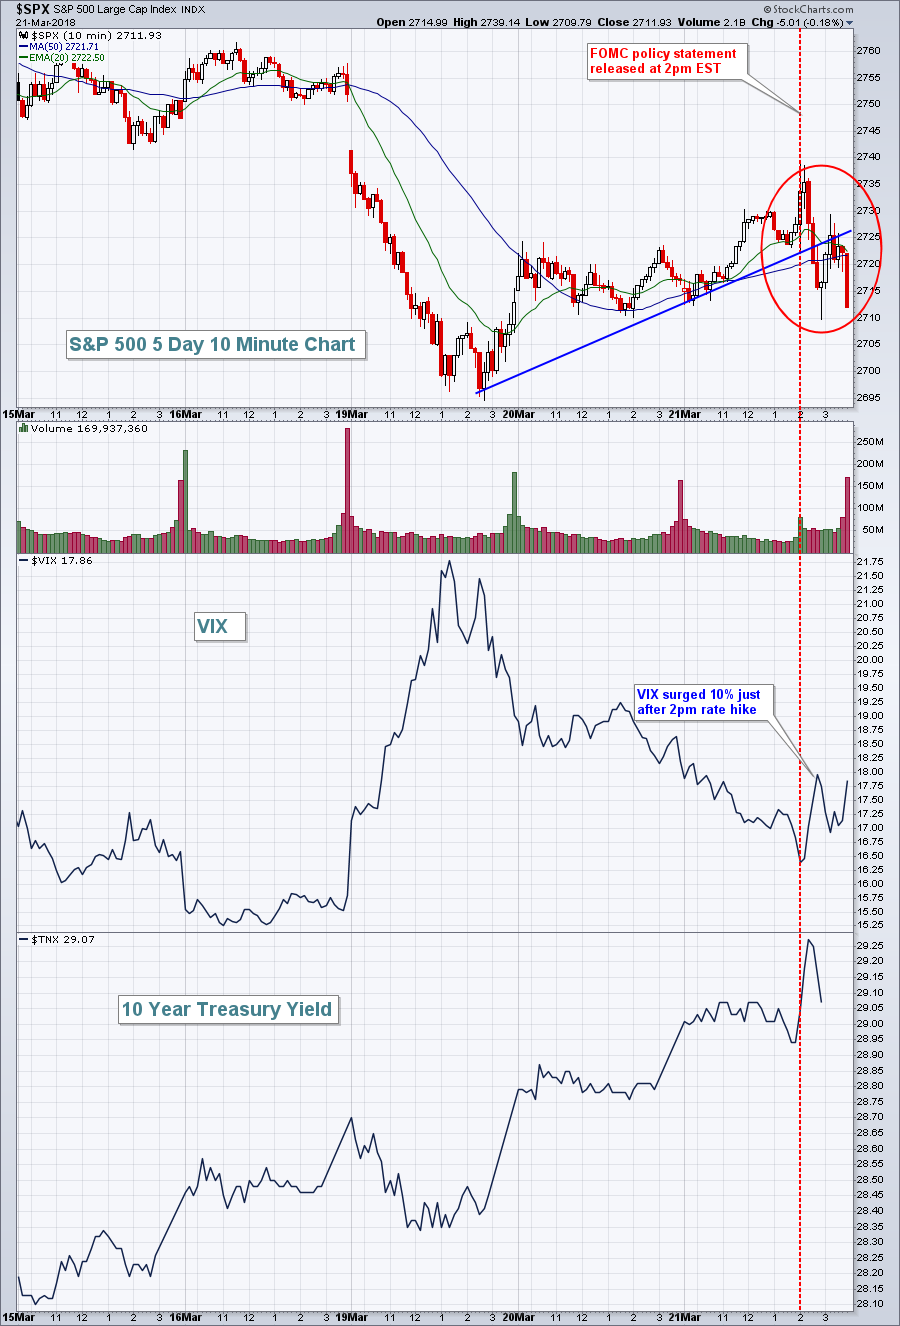
Fed Raises Quarter Point, Energy Soars
by Tom Bowley,
Chief Market Strategist, EarningsBeats.com
Market Recap for Wednesday, March 21, 2018
It was a volatile session on Wednesday, particularly after 2pm EST when the FOMC policy statement was released. In Fed Chairman Jerome Powell's first meeting as Fed Chief, the Fed raised the benchmark funds rate a quarter point from 1.50%...
READ MORE