MEMBERS ONLY

Weekly Market Review & Outlook - A Mean-Reversion Strategy for Sectors and Major Index ETFs in 2018

by Arthur Hill,
Chief Technical Strategist, TrendInvestorPro.com
.... SPY Hits Another New High
.... A Mean-Reversion Strategy for 2018
.... Breadth Symbols for Other ETFs
.... Time off for Happy Holidays!!
.... IJR Follows QQQ with Flag Breakout
.... Defensive Sectors Lag as Energy Takes the Lead
.... Oil Goes for a Triangle Breakout
.... Oil & Gas Equip & Services SPDR Pops (plus XOP)...
READ MORE
MEMBERS ONLY
Energy And Banks Dominate The Trading Session; All Major Indices Advance

by Tom Bowley,
Chief Market Strategist, EarningsBeats.com
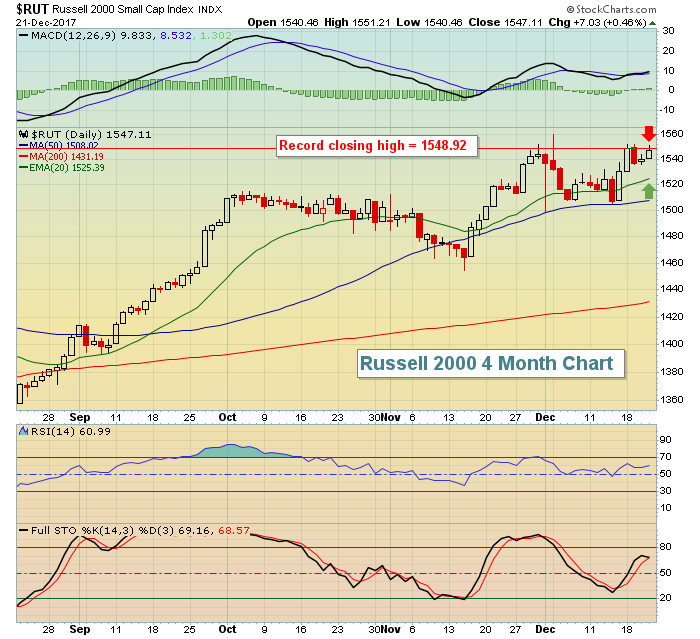
Market Recap for Thursday, December 21, 2017
In afternoon trading, all of the major indices except the NASDAQ appeared headed for another record all-time high close. But a late afternoon selling bug hit Wall Street and much of those earlier gains disappeared. The small cap Russell 2000 was able to...
READ MORE
MEMBERS ONLY

The Yield Curve Is Not Forecasting A Recession Right Now

by Martin Pring,
President, Pring Research
* What message is the yield curve giving?
* Secular reversal in short-term bond yields is being signalled
* Energy sector breaks to the upside
* Energy strength may breathe life into the CRB Composite
What message is the yield curve giving?
Despite what you may be reading, the yield curve is not forecasting...
READ MORE
MEMBERS ONLY
DP Bulletin: Dollar (UUP) ITTM SELL Signal - ITTM Neutral Signals for XLU and RYU

by Erin Swenlin,
Vice President, DecisionPoint.com
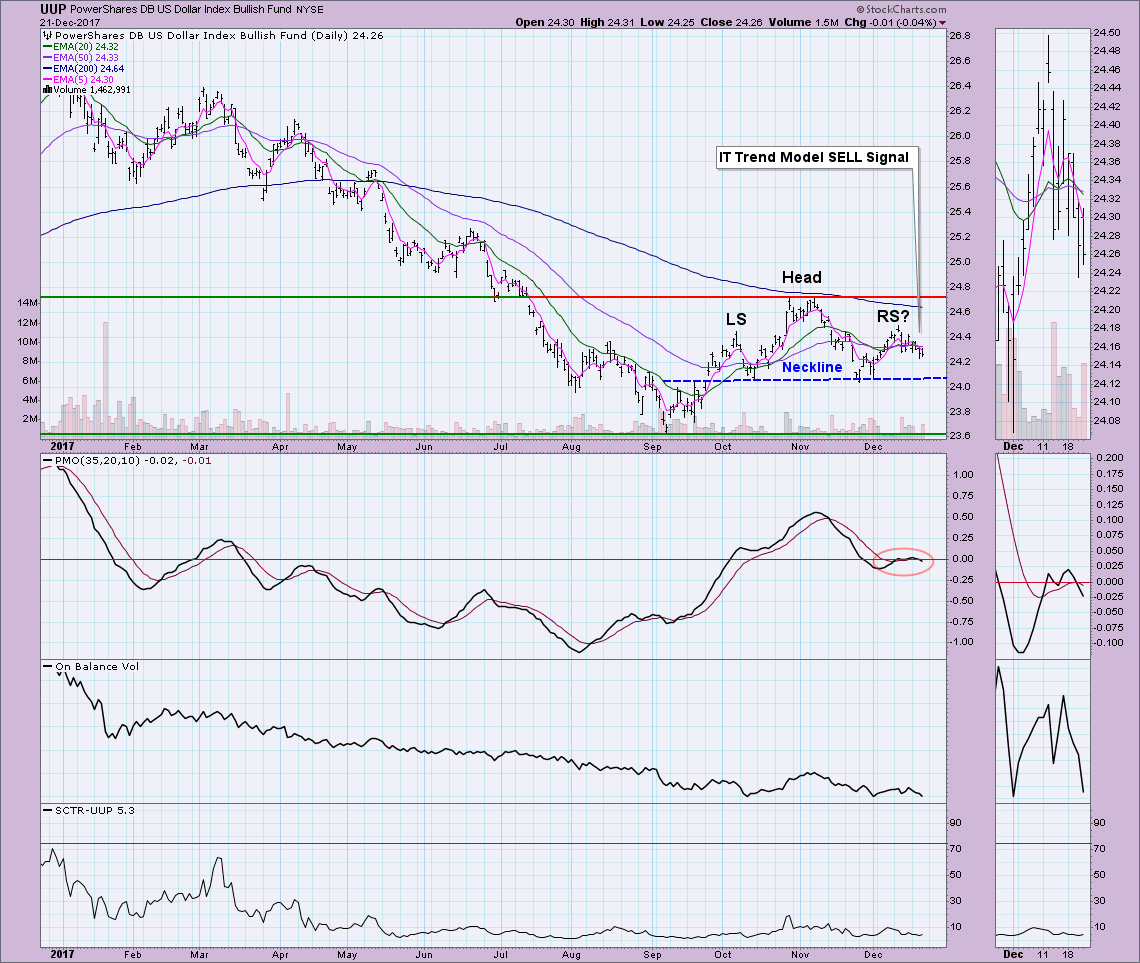
The Dollar (UUP) continues to form a bearish head and shoulders pattern in textbook fashion. The decline continues and consequently, there was a negative 20/50-EMA crossover BELOW the 200-EMA which constitutes an Intermediate-Term Trend Model (ITTM) SELL signal. For the Utilities SPDR (XLU) and Utilities Equal-Weight (RYU), new ITTM...
READ MORE
MEMBERS ONLY
Schlumberger Ends Downtrend, Now Looks To Confirm Price Breakout
by Tom Bowley,
Chief Market Strategist, EarningsBeats.com
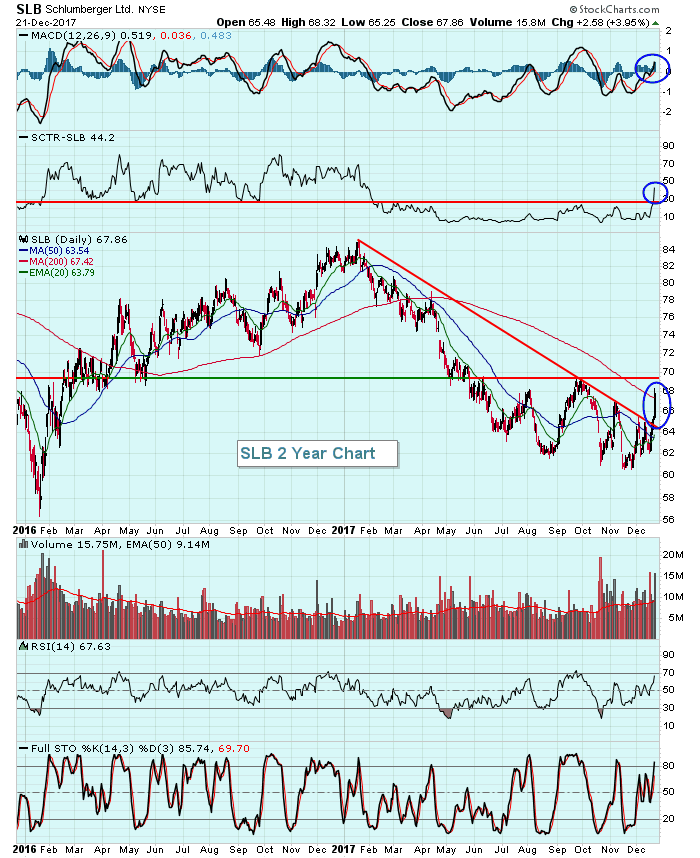
The energy ETF (XLE) has been blistering hot this week and today its three largest holdings - Exxon Mobil (XOM at 23%), Chevron Corp (CVX at 17%) and Schlumberger (SLB at 7%) - all had some form of a breakout. XOM surged to its highest close since January. CVX closed...
READ MORE
MEMBERS ONLY

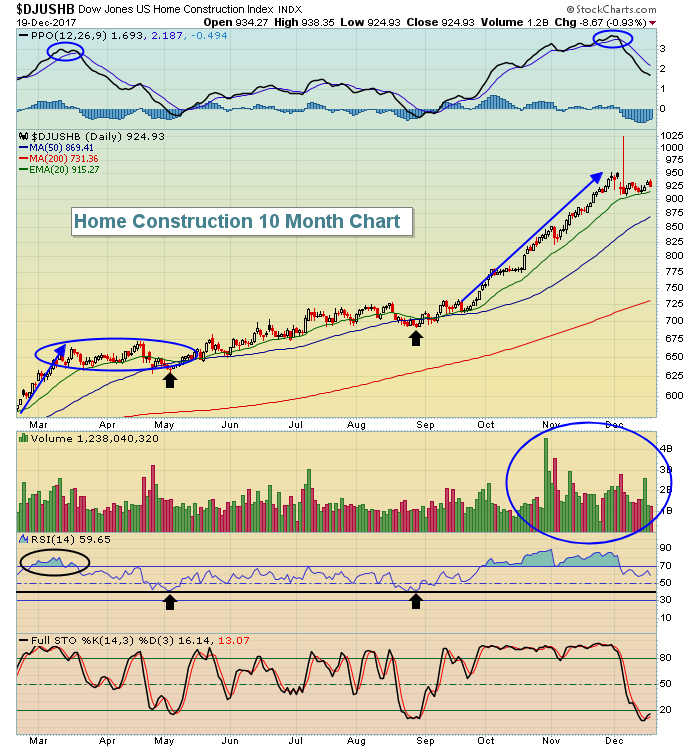
DOW JONES HOME CONSTRUCTION INDEX REACHES ELEVEN YEAR HIGH BUT STILL LOOKS CHEAP ON A RELATIVE STRENGTH BASIS -- US HOME CONSTRUCTION ISHARES ARE HAVING A STRONGER YEAR THAN THE S&P HOMEBUILDER SPDR -- ENERGY SPDR HITS ELEVEN MONTH HIGH

by John Murphy,
Chief Technical Analyst, StockCharts.com
DOW JONES HOME CONSTRUCTION INDEX REACHES ELEVEN-YEAR HIGH... Recent reports of strong home sales and home construction have boosted stocks tied to the housing sector. The low inventory of existing homes available for sale argues for even more homebuilding in the year ahead. All of which bodes well for the...
READ MORE
MEMBERS ONLY
Energy Breaks Out As Oil Equipment & Services Strengthen
by Tom Bowley,
Chief Market Strategist, EarningsBeats.com
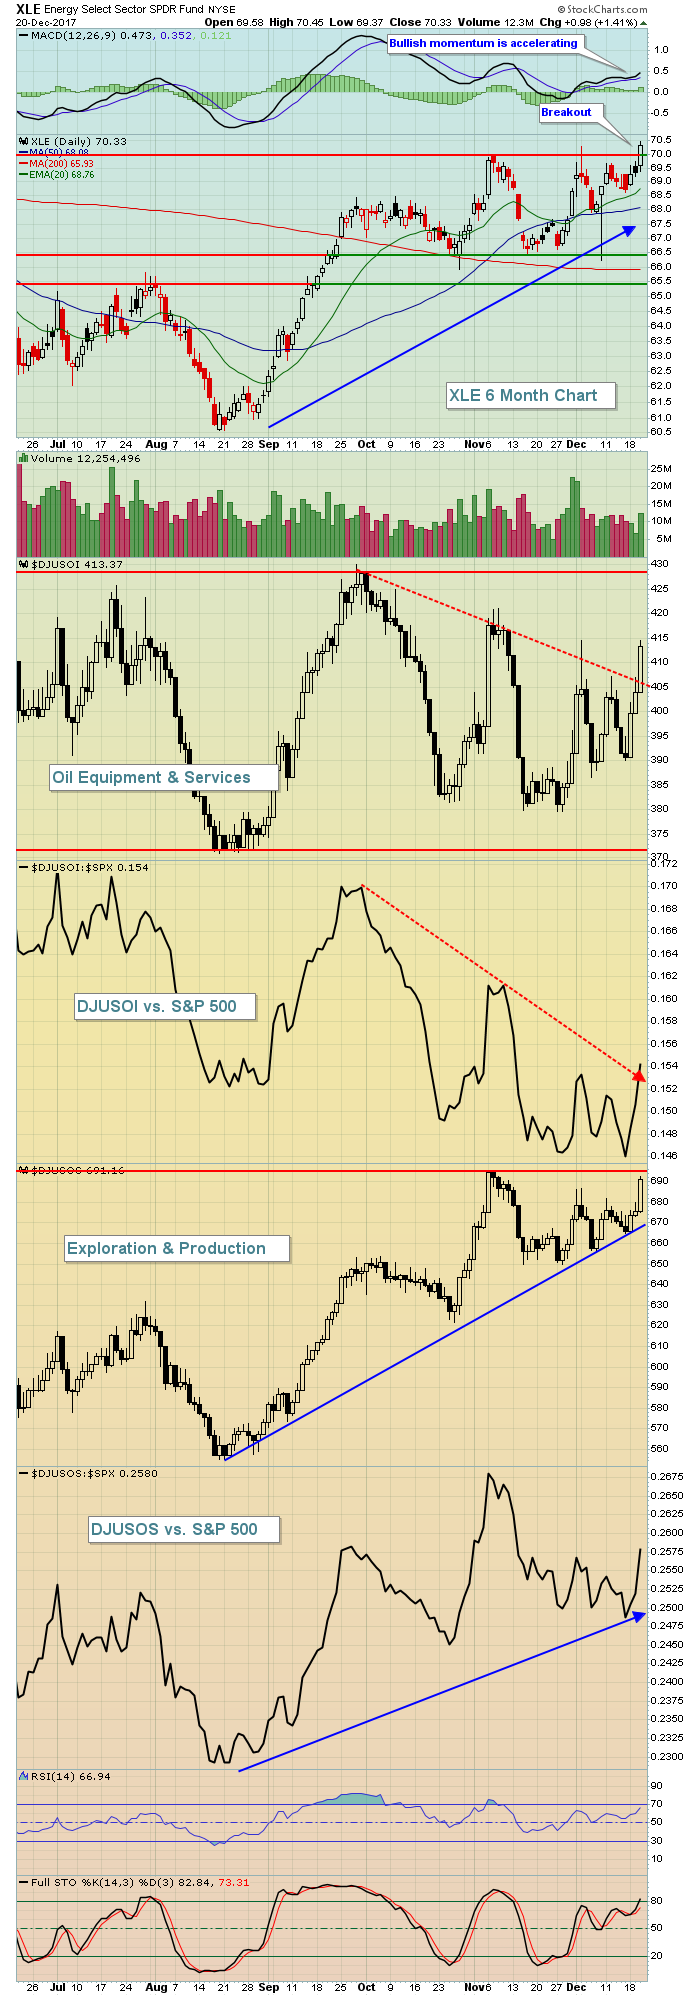
Market Recap for Wednesday, December 20, 2017
It's been a rough road for oil equipment & services stocks ($DJUSOI, +2.33%). They haven't broken down below summer lows, but they also haven't kept pace with the energy sector as a whole either. Yesterday'...
READ MORE
MEMBERS ONLY

DP Alert: UUP PMO SELL Signal - IT Indicators Toppy
by Erin Swenlin,
Vice President, DecisionPoint.com
The DecisionPoint Scoreboards remain completely "green". Hard to argue with the strength of this bull market in all three timeframes. However, the intermediate-term indicators are trying to top and have a negative crossover. ST indicators continue to fall. The Dollar looks very weak and it is getting more...
READ MORE
MEMBERS ONLY

TEN-YEAR TREASURY YIELD CLIMBS TO NINE-MONTH HIGH -- LONG-TERM TREASURY BOND CHART LOOKS BEARISH -- RELATIVE STRENGTH ANALYSIS SHOWS RISING RATES HURTING UTILITIES AND REITS -- BUT BOOSTING FINANCIALS
by John Murphy,
Chief Technical Analyst, StockCharts.com
10-YEAR TREASURY YIELD HITS NINE-MONTH HIGH ... Chart 1 shows the 10-Year Treasury yield climbing another 3 basis points today to the highest level since March (2.49%). That's most likely tied to the impending passage of the tax bill before Congress with expectations for faster economic growth and...
READ MORE
MEMBERS ONLY
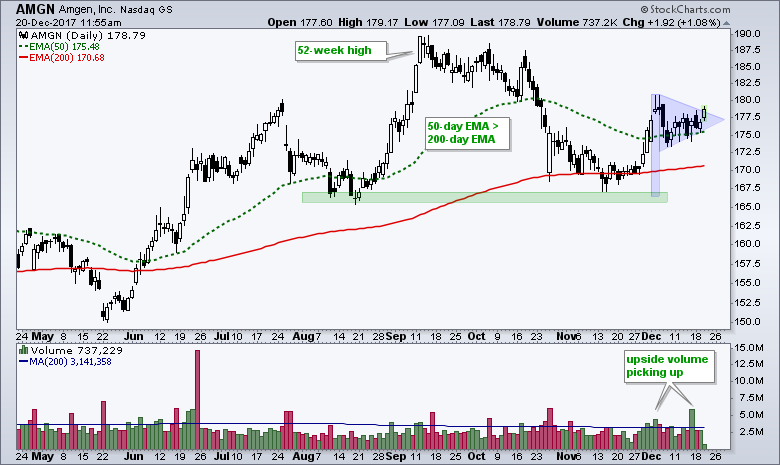
Amgen Goes for a Pennant Break
by Arthur Hill,
Chief Technical Strategist, TrendInvestorPro.com
Amgen (AMGN) is one of these stocks that is leading year-to-date, but lagging over the last three months. Year-to-date, the stock is up around 25% and the S&P 500 SPDR is up around 22%. Over the last three months, the stock is down around 4% and the S&...
READ MORE
MEMBERS ONLY
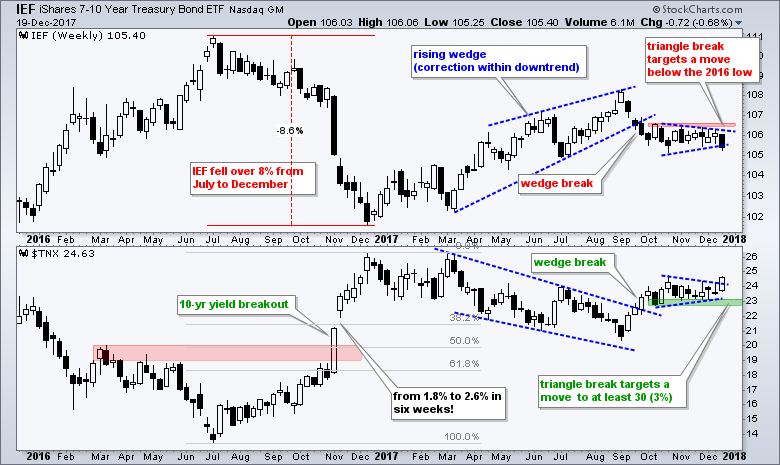
A Big Theme Emerges for 2018 - Long-term Price Targets (with Salt) for XLF and KRE
by Arthur Hill,
Chief Technical Strategist, TrendInvestorPro.com
* A Big Theme to Consider for 2018
* 10-yr T-Yield Targeted above 3%
* An Outsized Move for the 30-yr Yield
* Rising Rates Negative for Gold, XLU and IYR
* Rising Rates Positive for Finance Sector
* Price Targets for XLF and KRE
A Big Theme to Consider for 2018
The 20+ YR T-Bond...
READ MORE
MEMBERS ONLY
Treasury Yields Soar, On Verge Of Key Breakout
by Tom Bowley,
Chief Market Strategist, EarningsBeats.com
Market Recap for Tuesday, December 19, 2017
Housing data released the past couple days has been extremely hot with the housing price index well above expectations and then yesterday housing starts and building permits both easily surpassing Wall Street consensus estimates. This data has been expected by the stock market...
READ MORE
MEMBERS ONLY

Using Volatility Index Charts to Analyze Short-Term Trading Conditions
by Erin Swenlin,
Vice President, DecisionPoint.com
I am often asked why I use an inverted scale on my Volatility Index charts. The answer is that I find it to be an excellent overbought/oversold indicator in the short term when it's flipped. Typically it is said that if the VIX is low that is...
READ MORE
MEMBERS ONLY

10-YEAR BOND YIELD SURGES TO TWO-MONTH HIGH AND MAY BE ON VERGE OF UPSIDE BREAKOUT -- FOREIGN YIELDS ARE ALSO JUMPING -- THAT'S PUSHING BOND PRICES SHARPLY LOWER -- UTILITIES AND REITS ARE STARTING TO SHOW SERIOUS UNDERPERMANCE
by John Murphy,
Chief Technical Analyst, StockCharts.com
10-YEAR TREASURY YIELD SURGES... The daily bars in Chart 1 show the 10-Year Treasury yield ($TNX) jumping 7 basis points today to the highest level in two months in one of the biggest daily gains this year. That puts the yield within striking distance of its late October intra-day peak...
READ MORE
MEMBERS ONLY
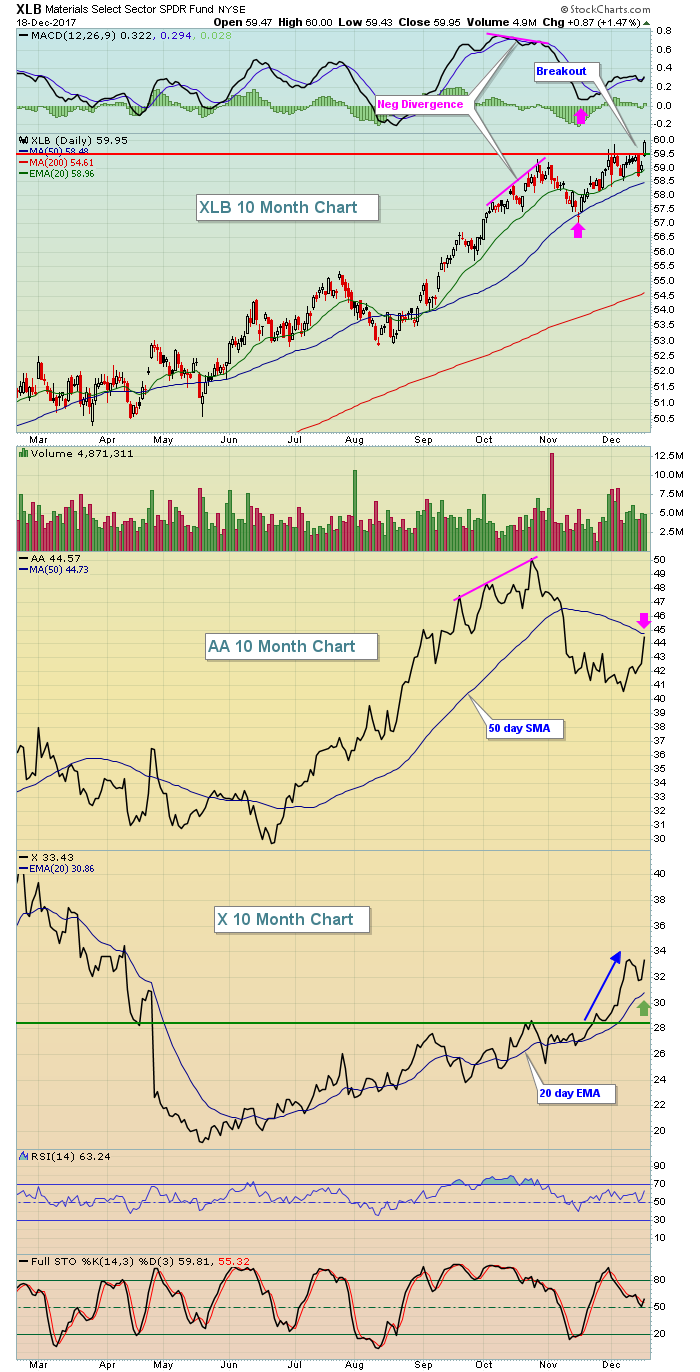
USX, Alcoa Lead Strong Materials Sector; Russell 2000 Breaks Out
by Tom Bowley,
Chief Market Strategist, EarningsBeats.com
Market Recap for Monday, December 18, 2017
Rotation is powerful during bull markets and Monday's action was a perfect illustration. On November 15th, both the materials sector and small cap stocks were clear market laggards, but over the past 4-5 weeks we've seen both areas gather...
READ MORE
MEMBERS ONLY
Semis Surge - Biotech ETFs Struggle - Oil and XES Stall - H&R Block, Albemarle, Teekay and 4 More
by Arthur Hill,
Chief Technical Strategist, TrendInvestorPro.com
.... Small, Equal-weight and Large-cap Sector Leaders
.... Industry Group ETF Leaders
.... Semis Surge from Oversold Levels
.... Biotech ETFs Struggle, but Remain Bullish
.... Oil Consolidates within Uptrend
.... XES Forms Ascending Triangle
.... H&R Block Holds Breakout Zone
.... Albemarle Takes One Step Back
.... Teekay Bids to End Long Correction
.... Stocks to Watch:...
READ MORE
MEMBERS ONLY
DP Alert: PMO BUY for NDX Finally - Gold Sentiment Suggests Rally
by Erin Swenlin,
Vice President, DecisionPoint.com
The only red arrow left on the DP Scoreboards was erased today as the NDX triggered a PMO BUY signal on the daily chart. The last time we saw no red on the Scoreboards, it lasted about two days. The bull winds are blowing hard, so I think this all...
READ MORE
MEMBERS ONLY

STEEL STOCKS LEAD MATERIALS TO NEW RECORD -- STEEL ETF NEARS FIVE-YEAR HIGH -- STEEL LEADERS INCLUDE NUCOR AND STEEL DYNAMICS -- S&P METALS AND MINING SPDR ACHIEVES BULLISH BREAKOUT -- STOCKS HAVE ANOTHER STRONG DAY
by John Murphy,
Chief Technical Analyst, StockCharts.com
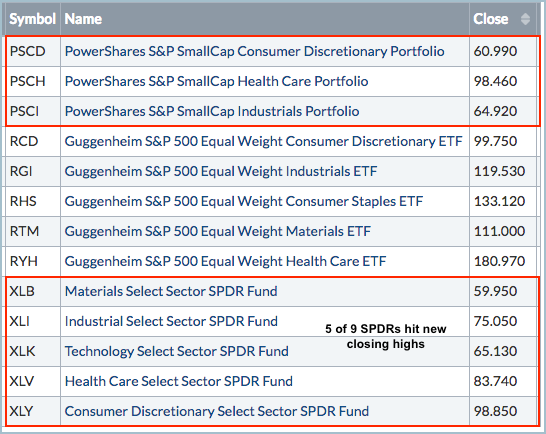
MATERIALS SPDR HITS NEW RECORD ... In a strong market day, materials led stocks higher. Chart 1 shows the Materials Select SPDR (XLB) breaking out to a new record. The XLB has been finding support along its 50-day average. The XLB/SPX ratio (top of chart) has been lagging behing the...
READ MORE
MEMBERS ONLY
Analog Devices Turns at Key Retracement Zone
by Arthur Hill,
Chief Technical Strategist, TrendInvestorPro.com
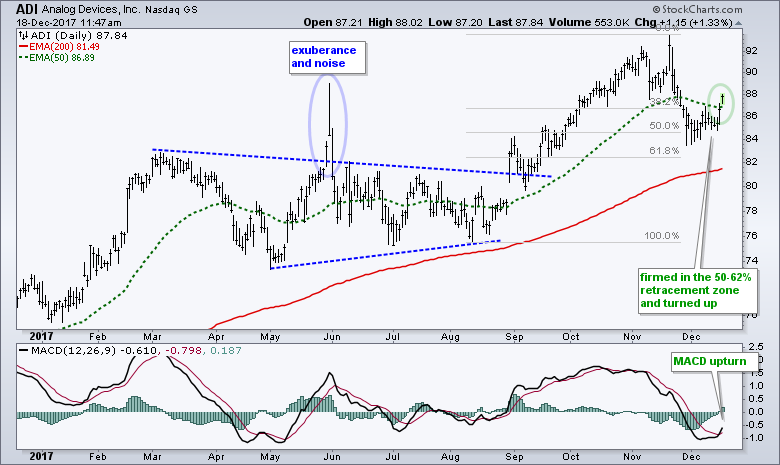
There is a certain ebb and flow in an uptrend where the advances consistently outpace the pullbacks. Think of it as two steps forward and one step backward. The chart for Analog Devices (ADI) shows a big move to new highs from August to November and then a 50-62% retracement...
READ MORE
MEMBERS ONLY
RRG shows two sectors continuing to carry SPY higher and three sectors to avoid going into the new year

by Julius de Kempenaer,
Senior Technical Analyst, StockCharts.com
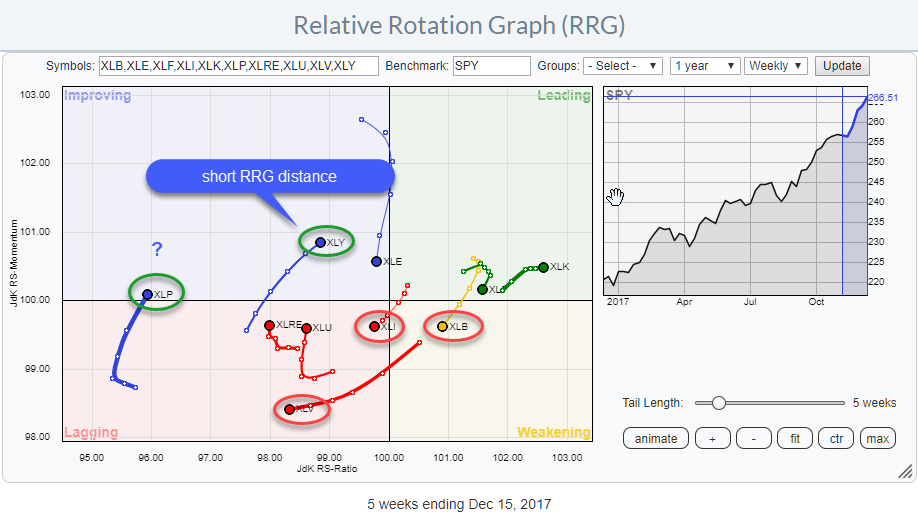
The Relative Rotation Graph for US sectors is showing us three sectors to avoid but also two which may offer good potential.
Inside the leading quadrant, we find XLK and XLF still being the strongest sector in US equity market based on their JdK RS-Ratio reading.
Energy (XLE) started heading...
READ MORE
MEMBERS ONLY
Russell 2000 Leads Friday's Strong Advance; Small Caps Ready To Explode
by Tom Bowley,
Chief Market Strategist, EarningsBeats.com
Market Recap for Friday, December 15, 2017
Friday's action was extremely bullish. I always love to see "trend days", where prices rise across the board from opening to closing bells. Strength was found in all of our major indices with the Russell 2000 (small caps) leading...
READ MORE
MEMBERS ONLY
NASDAQ and Microsoft Hit New Records, Russell 2000 Ishares Bounce
by John Murphy,
Chief Technical Analyst, StockCharts.com
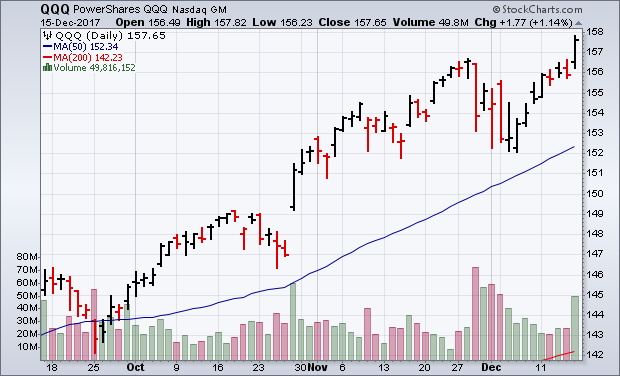
The Nasdaq finally joined the Dow and S&P 500 in record territory on Friday. Chart 1 shows the PowerShares QQQ exceeding its November peak at week's end, and in heavy trading. The QQQ is based on the Nasdaq 100 index which includes the 100 largest non-financial...
READ MORE
MEMBERS ONLY
The Best Traders Have This One Common Trait And They Never Waver

by John Hopkins,
President and Co-founder, EarningsBeats.com
This may sound way too easy, but successful traders manage risk. They don't care about losing money on trades that don't work. They exit those trades and put their capital to work in a better trade. Many trading services will try to WOW you with a...
READ MORE
MEMBERS ONLY

Year-End Cleanup

by Bruce Fraser,
Industry-leading "Wyckoffian"
Two favorite tools of Wyckoffians are Relative Strength analysis and Point and Figure (PnF) charting (Horizontal Method). As the year comes to a conclusion let’s reflect back on some case studies and bring them up to date.
‘In Gear with Relative Strength’ (click here for a link) profiled two...
READ MORE
MEMBERS ONLY
Here Are Five Solid Small Cap Trades And A Powerful ChartList For 2018
by Tom Bowley,
Chief Market Strategist, EarningsBeats.com
Happy holidays! I want to wish everyone a joyous holiday season and here's to a happy, healthy and prosperous 2018! Thank you so much for all your support of StockCharts.com in 2017!
To better understand the reasoning for the stocks selected below, you first need to understand...
READ MORE
MEMBERS ONLY

TECHNOLOGY IS WEEK'S STRONGEST SECTOR AND HITS NEW HIGH -- SO DOES THE NASDAQ 100 -- MICROSOFT WAS ONE OF THE BIG REASONS WHY -- RUSSELL 2000 ISHARES BOUNCE OFF 50-DAY AVERAGE -- SMALL CAPS SHOULD BENEFIT FROM TAX CUT
by John Murphy,
Chief Technical Analyst, StockCharts.com
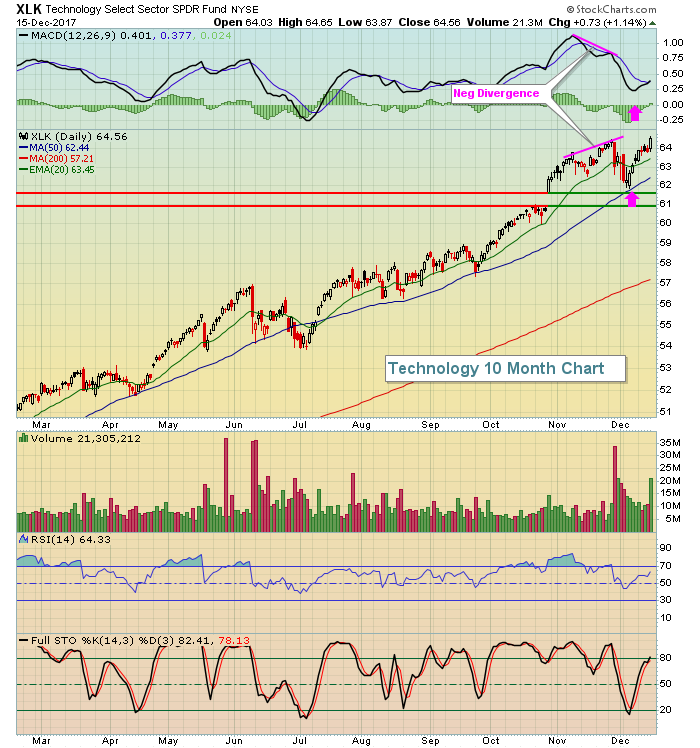
TECHNOLOGY HAS A STRONG WEEK... After leading the market higher for most of the year, technology stocks saw some profit-taking near the end of November, and have lagged behind the rest of the market since then. This week, however, technology was the market's strongest sector. And that was...
READ MORE
MEMBERS ONLY
Overbought - And Built to Stay That Way
by Arthur Hill,
Chief Technical Strategist, TrendInvestorPro.com
Overbought and oversold are funny terms. Well, actually, they are not that funny when you really think about it. Overbought is often overused in an uptrend and oversold is over used in a downtrend. Let's focus on overbought because that seems to be the term du jour right...
READ MORE
MEMBERS ONLY
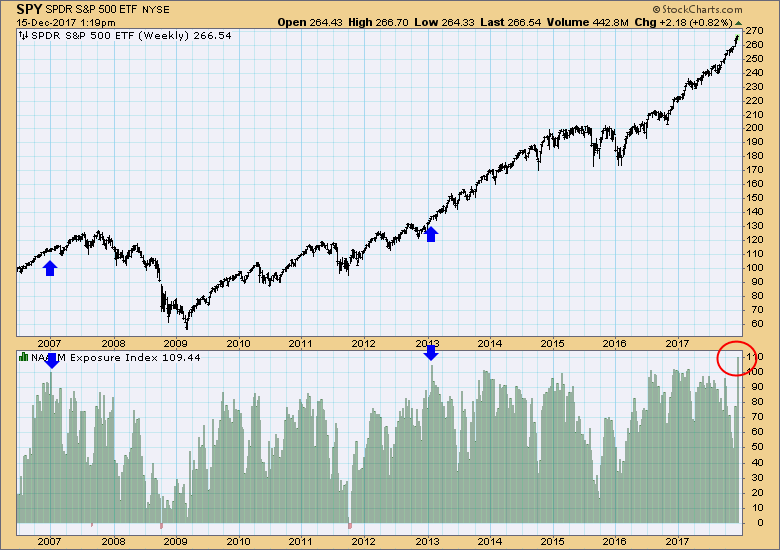
DP Weekly Wrap: NAAIM Exposure Index Highest Reading Ever

by Carl Swenlin,
President and Founder, DecisionPoint.com
This week the National Association of Active Investment Managers (NAAIM) Exposure Index reached the highest reading since its inception in 2006. Rather than stay 100% invested, NAAIM members will raise or lower their fund's market exposure based upon their assumptions regarding future market action. The potential range of...
READ MORE
MEMBERS ONLY

Charts I'm Stalking: Action Practice #24

by Gatis Roze,
Author, "Tensile Trading"
Put a man on a bicycle and he’ll surprise you.
Put a man on a machine and he’ll amaze you.
Teach him asset allocation and he’ll electrify you!
Due to the unusual number of new subscribers who read my Traders Journal blog about Asset Allocation, I’ve...
READ MORE
MEMBERS ONLY
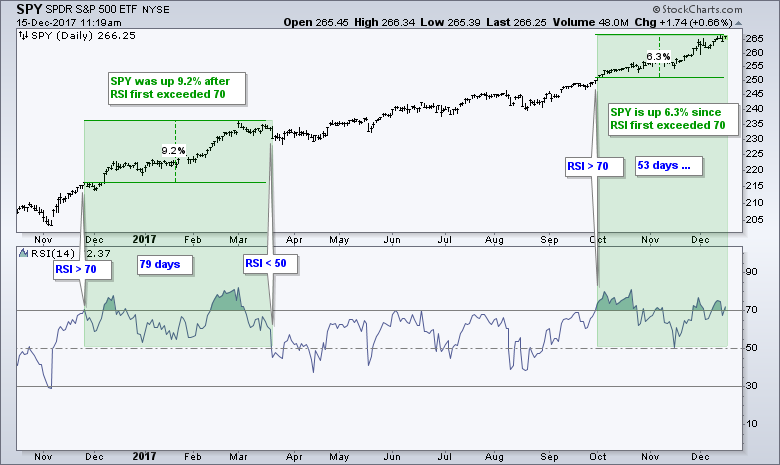
Weekly Market Review & Outlook (with Video) - Day 53 Since Becoming "Overbought"
by Arthur Hill,
Chief Technical Strategist, TrendInvestorPro.com
---- Day 53 Since Becoming "Overbought"
---- Small-cap Underperformance Becomes Pronounced
---- IJR Forms Bull Flag
---- SPY Hits New High as QQQ Breaks Flag
---- What's Up (literally) with TLT?
---- Junk Bonds Continue to Weaken
---- XLU with Bull Flag and Oversold CCI
----...
READ MORE
MEMBERS ONLY
Disney-Fox Deal Lifts Broadcasting, Consumer Discretionary
by Tom Bowley,
Chief Market Strategist, EarningsBeats.com
Market Recap for Thursday, December 14, 2017
Walt Disney (DIS) announced plans to purchase $52 billion of 21st Century Fox (FOXA) assets and that lifted both the broadcasting & entertainment index ($DJUSBC) and the consumer discretionary sector (XLY, +0.31%), not to mention both DIS (+2.75%) and FOXA (+6....
READ MORE
MEMBERS ONLY

Is Santa Claus Really Coming to Town for Small Caps?
by Erin Swenlin,
Vice President, DecisionPoint.com
I haven't talked Small Caps in quite awhile and I think there are some interesting points that need to be made--good and bad. First, the technicals on the S&P 600 are not looking good at all. However, Tom Bowley, my co-host on MarketWatchers LIVE and fellow...
READ MORE
MEMBERS ONLY
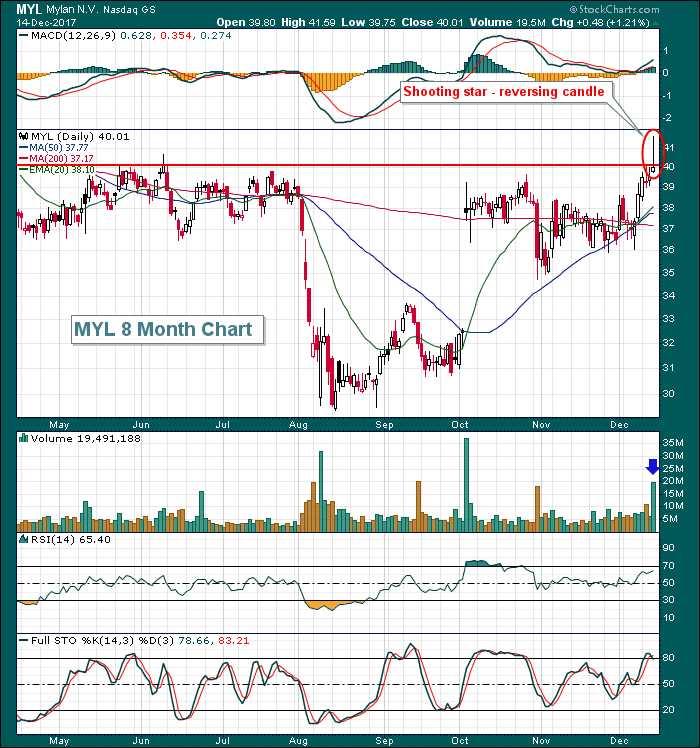
Did Mylan's Shooting Star Candle Mark A Near-Term Top?
by Tom Bowley,
Chief Market Strategist, EarningsBeats.com
We'll soon find out. But, as a short-term trader, I'd have sold Mylan (MYL) into the close today. A close above 40.09 on heavy volume would confirm a breakout. Today, MYL hit 41.59 intraday, but fell all the way back to close at 40....
READ MORE
MEMBERS ONLY

What's The Market Going To Do When The Tax Bill Is Passed?
by Martin Pring,
President, Pring Research
* General thoughts on the discounting process
* Short-term indicators poised for, but not yet signalling a decline
General thoughts on the discounting process
There is an old adage on Wall Street to the effect that traders should, in the case of war, sell the rumor and buy on the sound of...
READ MORE
MEMBERS ONLY

DISNEY AND FOX SURGE TOGETHER -- TIFFANY BREAKS OUT WHILE NIKE CONTINUES TO RUN -- DELTA AND SOUTHWEST CLIMB TO NEW HIGHS
by John Murphy,
Chief Technical Analyst, StockCharts.com
DISNEY AND FOX SURGE ... The announcement that Walt Disney was buying $66 billion worth of assets from Fox sent both stocks surging today. And they helped make cyclical stocks the day's biggest gainer. Chart 1 shows Disney (DIS) surging more than 3% to the highest closing level since...
READ MORE
MEMBERS ONLY
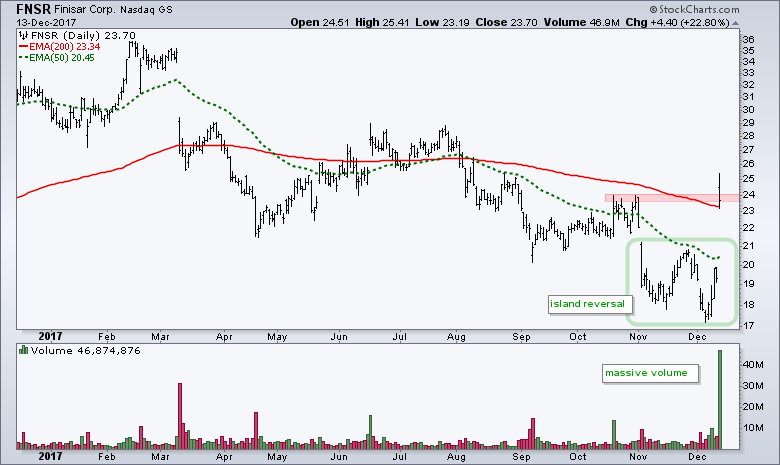
Finisar Forges an Island Reversal (What now?) - Lumentum Hits Retracement and II-VI Corrects within Uptrend - Plus 4 More
by Arthur Hill,
Chief Technical Strategist, TrendInvestorPro.com
.... Selectively Consuming News
.... Finisar and VCSELs
.... Narratives are Dangerous
.... Finisar Forges an Island Reversal
.... Lumentum Firms near Key Retracement
.... II-VI Corrects within Uptrend
.... Stocks to Watch (CENX, JJU, PRGO, LH) ....
I do follow the financial press on a regular basis, but on a very selective basis. I am mostly interested...
READ MORE
MEMBERS ONLY
Fed Rate Hike Slams Financials; Biotechs Picking Up Steam
by Tom Bowley,
Chief Market Strategist, EarningsBeats.com
Market Recap for Wednesday, December 13, 2017
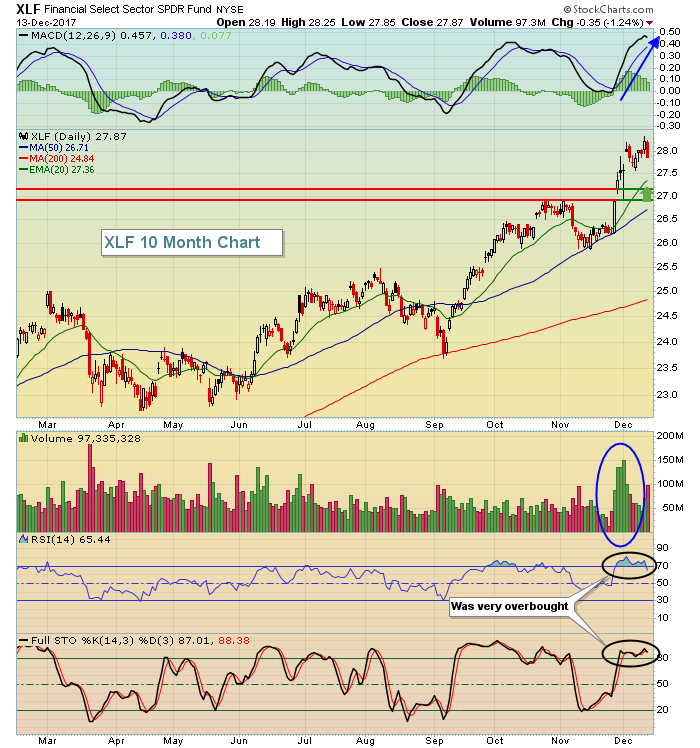
It was a simple case of "buy the rumor, sell the news". Financials (XLF, -1.24%) slumped on Wednesday after the Fed decided to raise interest rates another quarter point. Higher 10 year treasury yields ($TNX) typically result in money rotating...
READ MORE
MEMBERS ONLY
DP Alert: Short-Term Head & Shoulders Still Viable on Dollar (UUP)
by Erin Swenlin,
Vice President, DecisionPoint.com
No new changes to the DecisionPoint Scoreboards. The NDX is holding onto its PMO SELL signal and it still has some margin to cover before the new PMO BUY signal can generate. Of particular interest today, and of course coming on the heels of a very bullish blog on the...
READ MORE
MEMBERS ONLY
Consumer Stocks Look To Lead The Bull Market Into 2018
by Tom Bowley,
Chief Market Strategist, EarningsBeats.com
Market Recap for Tuesday, December 12, 2017
It was mixed and bifurcated action on Tuesday. The Dow Jones and S&P 500 continued their assault on the record books, but the NASDAQ and Russell 2000 both paused and pulled back. With the 10 year treasury yield ($TNX) moving back...
READ MORE
MEMBERS ONLY
What a Difference a Month Makes for Sector Performance
by Arthur Hill,
Chief Technical Strategist, TrendInvestorPro.com
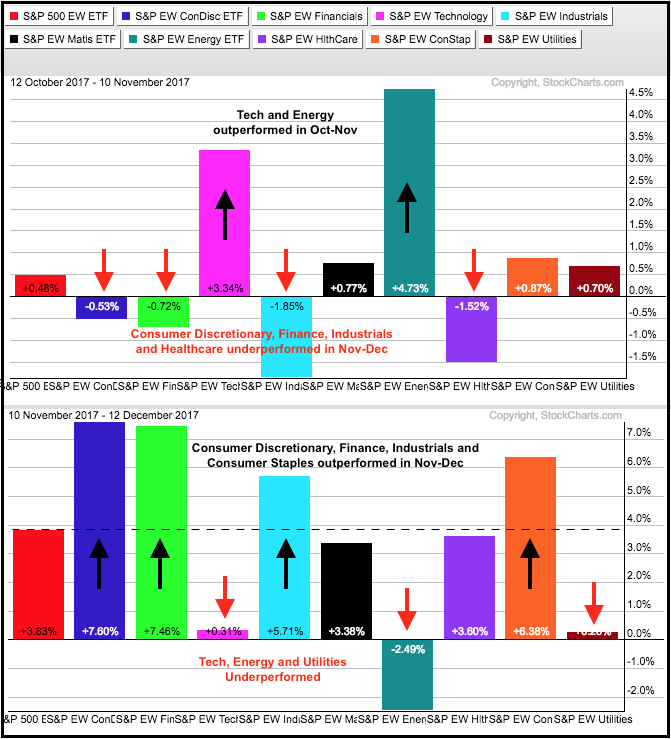
The two sector Performance charts below show a rather dramatic shift in market leadership over the last two months. First, note that these PerfCharts are using the nine equal-weight sector ETFs. In contrast to the cap-weighted sector SPDRs, these equal-weight ETFs provide us with a performance picture for the "...
READ MORE