MEMBERS ONLY

Charts I'm Stalking: Action Practice #20

by Gatis Roze,
Author, "Tensile Trading"
The reality is that markets operate within the law of groupings. This is precisely why I have formatted my unique chart view in a pull-down menu under ChartStyles. You simply click on “Gatis Roze” at the bottom of “Predefined Settings” and up pops the Tensile Trading analysis format that clearly...
READ MORE
MEMBERS ONLY
A Take On The Utilities In An On-going Correction

by Martin Pring,
President, Pring Research
* Bearish short-term charts suggest there is more to come on the downside
* Consumer Discretionary—not so discreet
* Energy—out of gas
* Utilities—a place to hide?
Bearish short-term charts suggest there is more to come on the downside
For the last two weeks, I have been zeroing in on a...
READ MORE
MEMBERS ONLY
Market Is Very Overvalued

by Carl Swenlin,
President and Founder, DecisionPoint.com
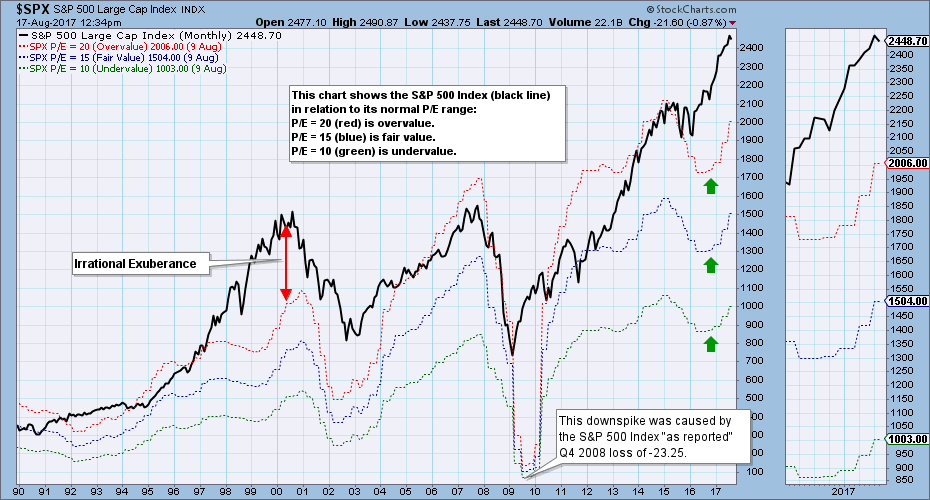
The market has been rising ahead of earnings for over two years, and it is very overvalued. Nevertheless, bullish investors seem unconcerned. The chart below shows the S&P 500 Index (black line) in relation to where it would be if it were undervalued (P/E 10 - green...
READ MORE
MEMBERS ONLY

Weekly Market Review & Outlook - Those Noisy Small and Mid Caps (w/ Video)

by Arthur Hill,
Chief Technical Strategist, TrendInvestorPro.com
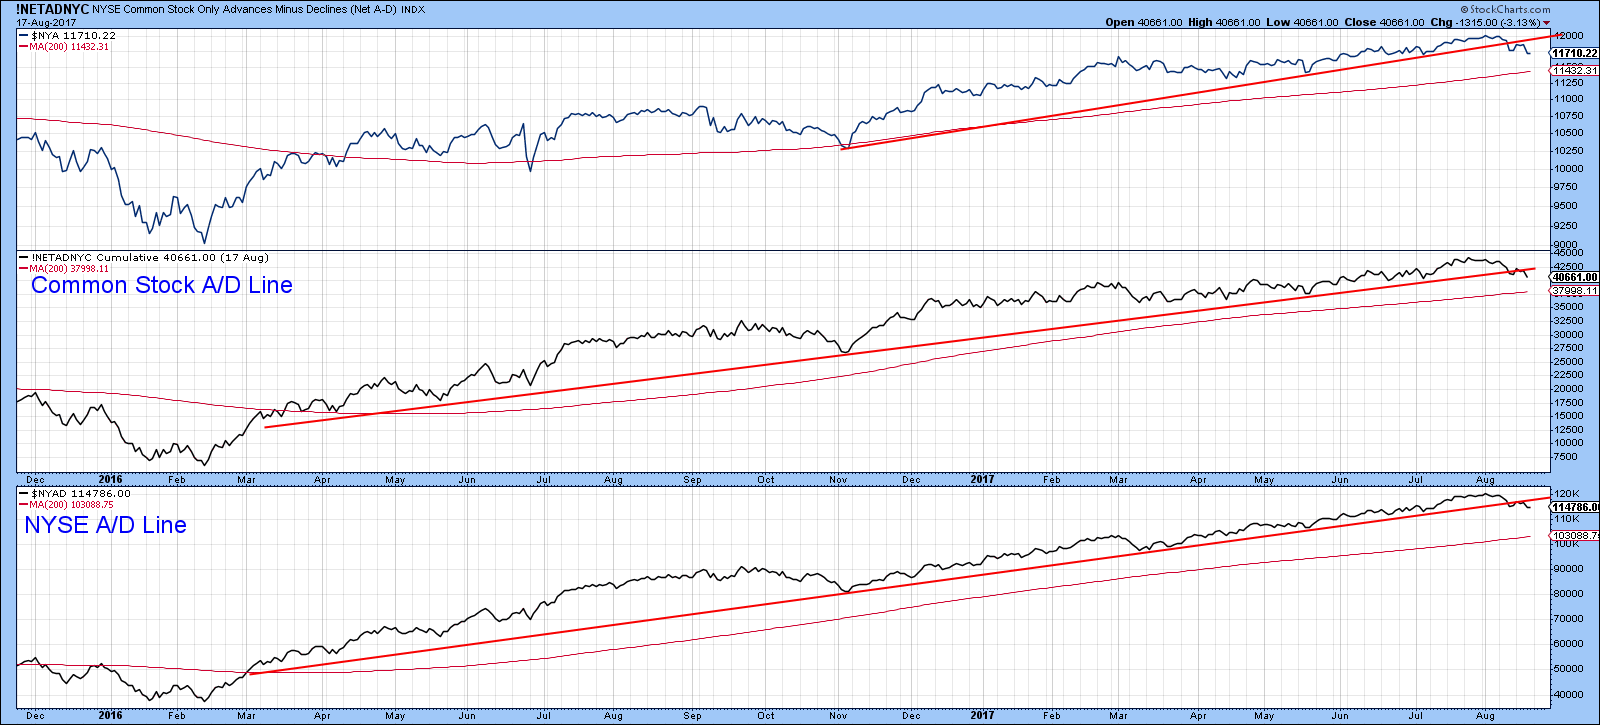
.... Those Noisy Small and Mid Caps
.... Correction Signals versus Bear Market Signals
.... High-Low and AD-Volume Lines Turn Down
.... SPY and QQQ Have Yet to Break Down
.... Non-confirmation between RSP and SPY
.... Small-caps Extend Oversold Readings
.... Utilities and Technology Leading
.... Finance and Staples Still Holding Up
.... Industrials-Healthcare-Materials Extend Corrections
.... TLT Extends...
READ MORE
MEMBERS ONLY
Fear Escalates; Gold Nears Major Breakout

by Tom Bowley,
Chief Market Strategist, EarningsBeats.com
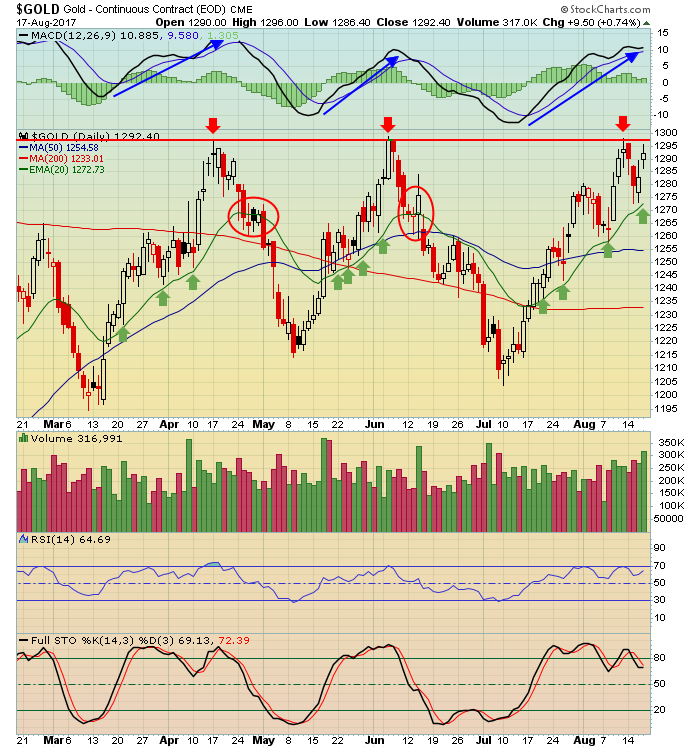
Market Recap for Thursday, August 17, 2017
For now it's just a short-term issue, but money is rotating to defensive areas and fear is rising. The Volatility Index ($VIX) jumped over 32% yesterday to close at its 5th highest level of 2017. The highest close of 16.04...
READ MORE
MEMBERS ONLY

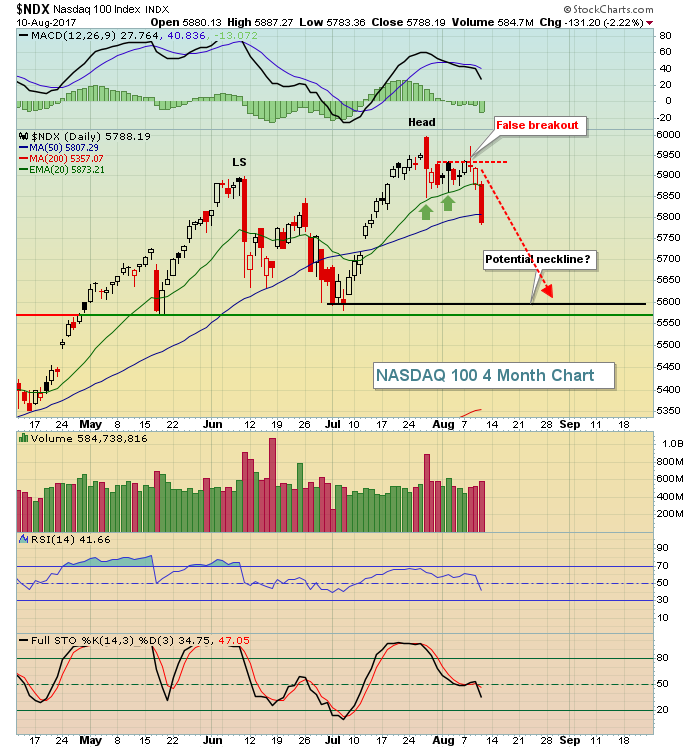
Range Bound NDX

by Bruce Fraser,
Industry-leading "Wyckoffian"
Mr. Wyckoff called his charting methodology ‘Tape Reading’. Determining the present position and probable future direction of prices from their own action. Prices have tendencies which can be detected on the charts. Context is the idea that recent price action will provide clues about what to expect next. This is...
READ MORE
MEMBERS ONLY
Internet Stocks Weekly Losing Streak Nearing Bull Market Record
by Tom Bowley,
Chief Market Strategist, EarningsBeats.com
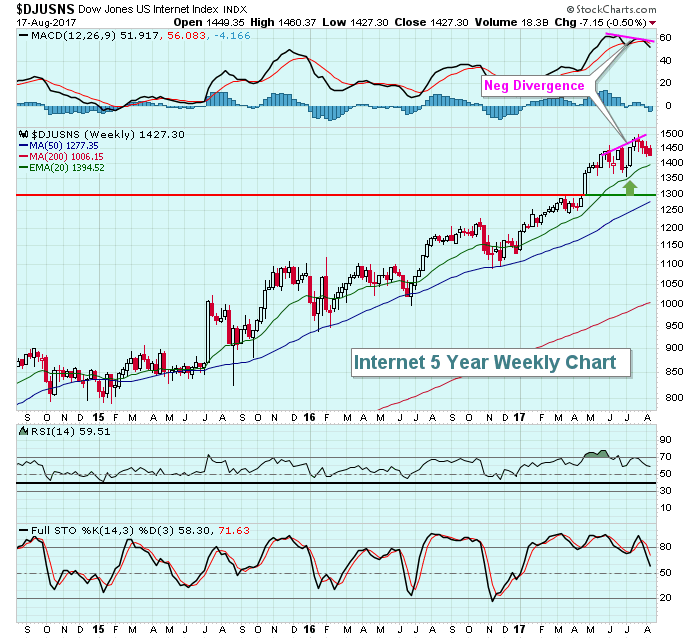
Unless there's a reversal on Friday, the Dow Jones U.S. Internet Index ($DJUSNS) will close lower for the fourth consecutive week, equaling its longest losing streak since the DJUSNS bottomed in late 2008. There's a decent chance a new record could be set next week...
READ MORE
MEMBERS ONLY
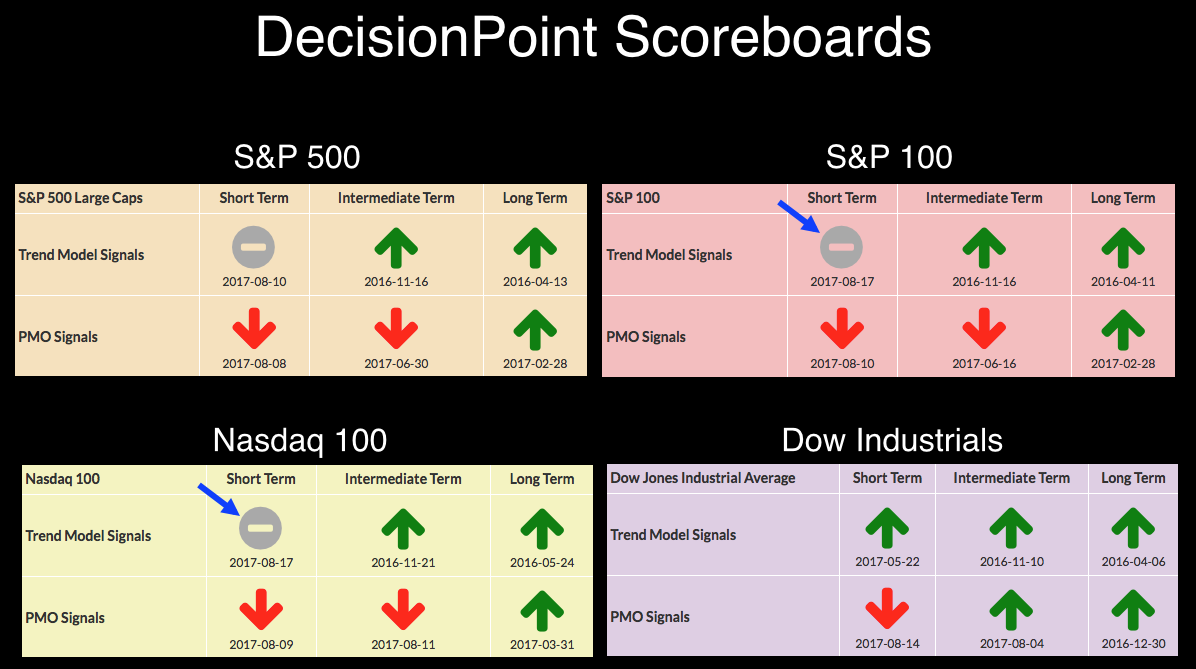
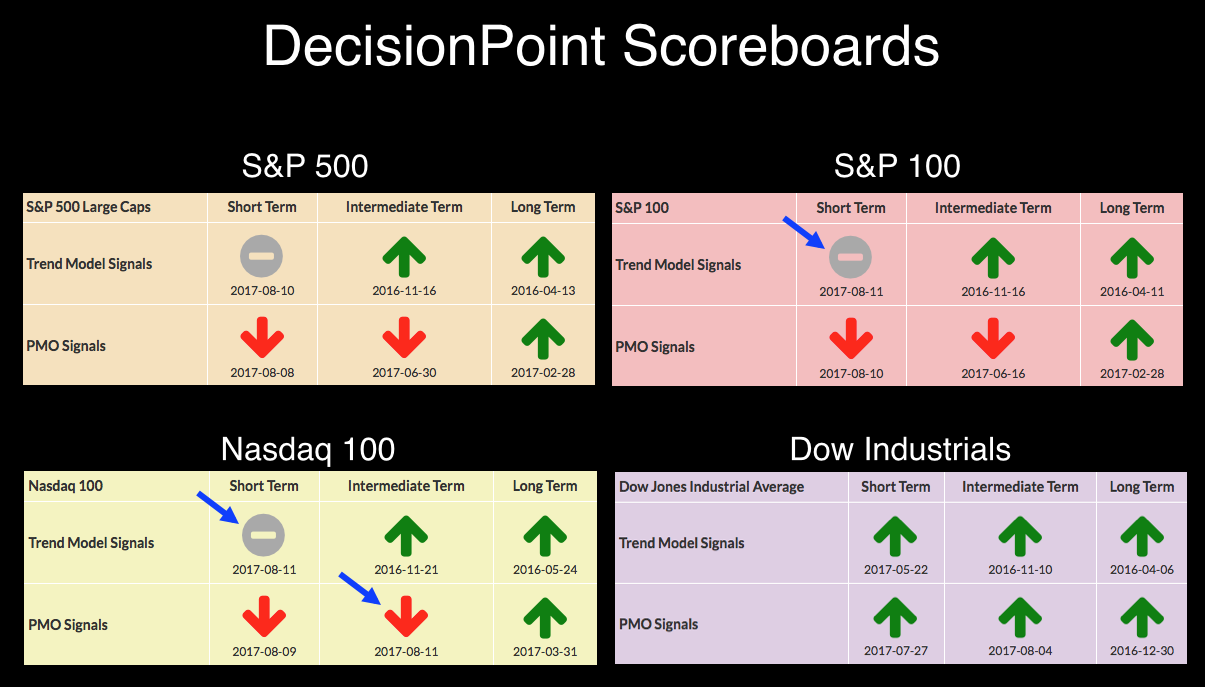
DP Bulletin: S&P 100 and Nasdaq 100 ST Trend Models Switch Back to NEUTRAL
by Carl Swenlin,
President and Founder, DecisionPoint.com
Today both the S&P 100 ($OEX) and Nasdaq 100 ($NDX) Indexes switched from Short-Term Trend Model BUY signals to NEUTRAL, when their 5EMAs crossed back down through their 20EMAs. With only two days since the last signal changes, this is more annoying whipsaw, but I think these signals...
READ MORE
MEMBERS ONLY

STOCKS HAVE A BAD DAY -- S&P 500 FALLS TO LOWEST LEVEL IN A MONTH -- THE RUSSELL 2000 CLOSES BELOW 200-DAY AVERAGE -- SO DO THE TRANSPORTS -- VOLATILITY MEASURES SPIKE HIGHER

by John Murphy,
Chief Technical Analyst, StockCharts.com
S&P 500 FALLS TO SIX-WEEK LOW... Selling pressure resumed with a vengeance today. And a lot of support levels have been broken. Chart 1 shows the S&P 500 falling back below its 50-day average to the lowest level in more than a month. Volume was higher....
READ MORE
MEMBERS ONLY
NASDAQ 100 Again Gets Turned Back At Key Resistance
by Tom Bowley,
Chief Market Strategist, EarningsBeats.com
Market Recap for Wednesday, August 16, 2017
All of our major indices finished higher on Wednesday and seven of our nine sectors finished higher as well. The primary laggard on the session? Energy (XLE, -0.96%). Go figure. A significant reason for the XLE's renewed relative weakness has...
READ MORE
MEMBERS ONLY
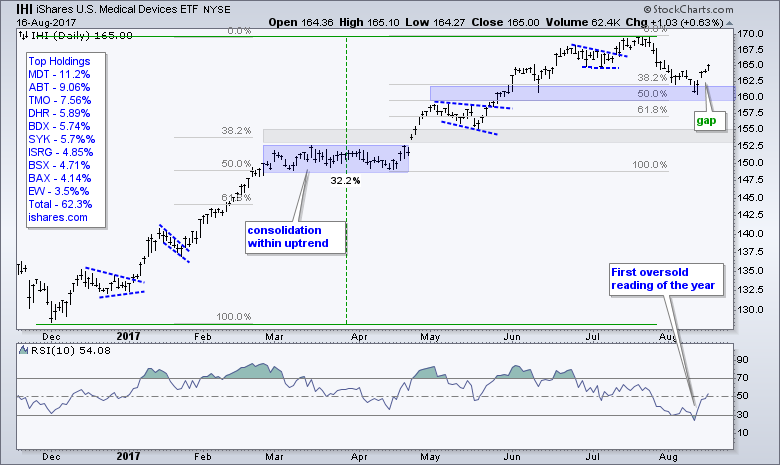
Medical Devices ETF Bids to End Correction - Analyzing the Top Stocks - Scanning a ChartList
by Arthur Hill,
Chief Technical Strategist, TrendInvestorPro.com
.... Medical Devices ETF Bids to End Correction
.... An ETF is Only as Good as it's Component Stocks
.... Scanning for Trends with a ChartList
.... Charting the Top Five IHI Stocks
.... Abbot Surges off Support
.... Thermo Fisher Consolidates after Gap
.... Danaher Bounces after Support Break
.... Boston Scientific Firms in Retracement...
READ MORE
MEMBERS ONLY

Erin's Hits: Another PMO Scan for MarketWatchers

by Erin Swenlin,
Vice President, DecisionPoint.com
** While Erin is away, we will be posting some of her "greatest hits" educational blogs. Some information may be dated **
During the MarketWatchers LIVE program (airs 12:00p - 1:30p EST M/W/F), Tom Bowley and I have started a segment called "Anatomy of a...
READ MORE
MEMBERS ONLY

RUSSELL 2000 FINDS SUPPORT AT 200-DAY AVERAGE -- SO HAVE THE DOW TRANSPORTS -- TWO-YEAR COPPER HIGH BOOSTS COPPER MINER ETF -- FREEPORT MCMORAN IS BIGGEST PERCENTAGE GAINER IN THE S&P 500
by John Murphy,
Chief Technical Analyst, StockCharts.com
WHY IT'S IMPORTANT TO TRACK THE PERFORMANCE OF SMALLER STOCKS... One of the concerns expressed recently by several technical analysts (including myself) has been the relatively weak performance by small stocks. That's because they often tell us more about the true state of the stock market...
READ MORE
MEMBERS ONLY
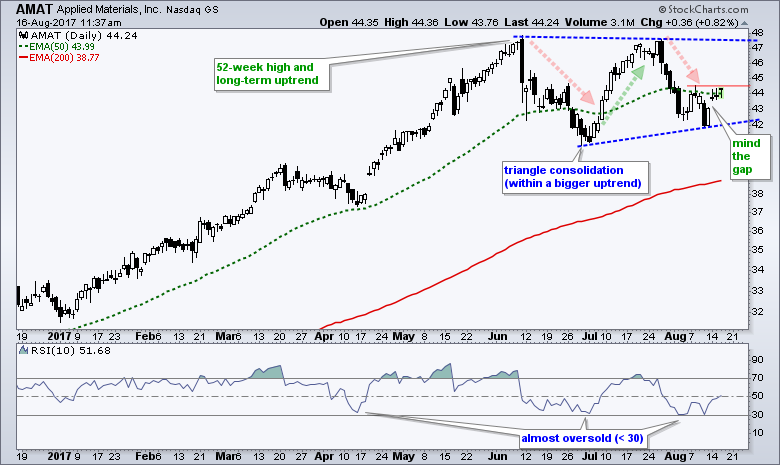
Mind the Gap in AMAT
by Arthur Hill,
Chief Technical Strategist, TrendInvestorPro.com
The long-term trend for Applied Materials (AMAT), a big semiconductor equipment manufacturer, is clearly up and the short-term trend could be turning up again with a gap three days ago. The chart below shows AMAT hitting a 52-week high in early June and then forming a large triangle. This is...
READ MORE
MEMBERS ONLY
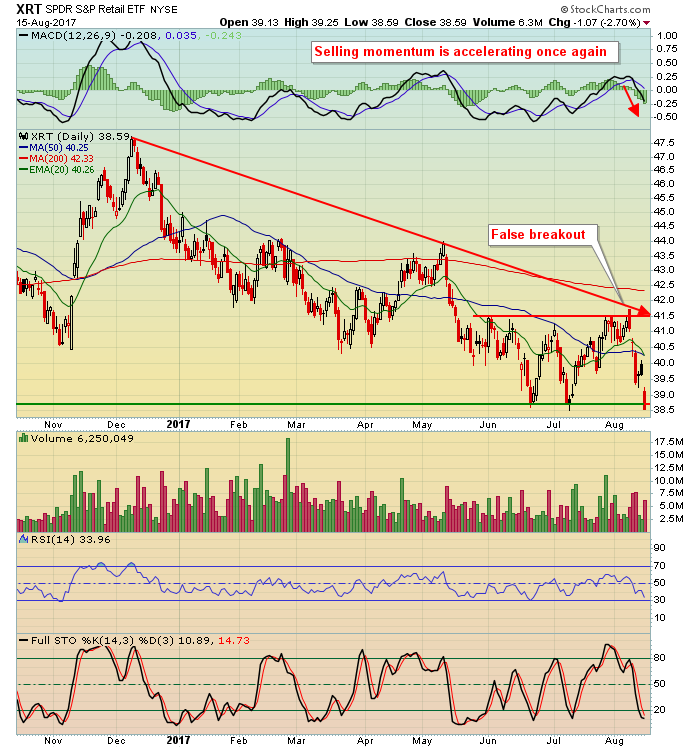
Strong Retail Sales Leads To.....Awful Performance By Retailers. Huh?
by Tom Bowley,
Chief Market Strategist, EarningsBeats.com
Market Recap for Tuesday, August 15, 2017
July retail sales doubled expectations (+0.6% actual vs +0.3% consensus estimate) and we saw the kind of reaction in the bond market that we'd expect with treasury prices tumbling and treasury yields spiking. But what happened to retail stocks?...
READ MORE
MEMBERS ONLY

HOME IMPROVEMENT STOCKS LEAD CYCLICALS LOWER -- AMAZON HAS ALSO WEAKENED -- CONSUMER DISCRETIONARY SPDR IS UNDERPERFORMING THE MARKET -- IT'S ALSO UNDERPERFORMING CONSUMER STAPLES WHICH ARE GAINING GROUND
by John Murphy,
Chief Technical Analyst, StockCharts.com
HOME DEPOT AND LOWES TUMBLE... Heavy selling in retail stocks is weighing on cyclical stocks which are the one of the day's weakest sectors. Home improvement stocks are the day's weakest group in that sector. Chart 1 shows Home Depot (HD) losing nearly -3% and falling...
READ MORE
MEMBERS ONLY
Misunderstanding Average

by Greg Morris,
Veteran Technical Analyst, Investor, and Author
Did you hear about the six-foot tall Texan that drowned while wading across a stream that averaged only 3 feet deep? The “World of Finance” is fraught with misleading information. The use of average is one that needs a discussion.
Figure A shows how easily it is to be confused...
READ MORE
MEMBERS ONLY
Monday Was A Bullish Kind Of Rebound
by Tom Bowley,
Chief Market Strategist, EarningsBeats.com
Market Recap for Monday, August 14, 2017
When the stock market goes up, I want to see money rotate towards aggressive areas and we definitely saw that on Monday. Technology (XLK, +1.59%), financials (XLF, +1.37%) and industrials (XLI, +1.05%) were the three big winners on the session...
READ MORE
MEMBERS ONLY
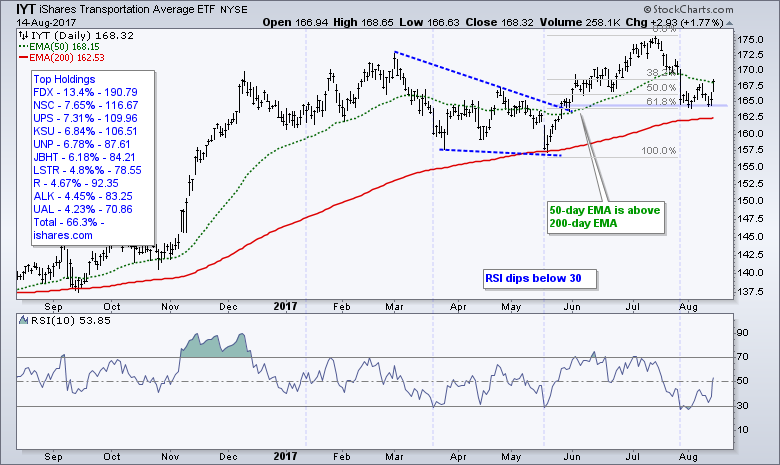
Transport ETF Holds Breakout, Semiconductor ETF Holds Support, Fab 5 Tech Stocks
by Arthur Hill,
Chief Technical Strategist, TrendInvestorPro.com
.... Transport ETF Bounces off Key Retracement
.... Airline ETF Returns to Breakout Zone
.... Railroad Stocks are in Uptrends
.... XSD Bounces of Support
.... Diodes and Skyworks Turn Up
.... Microsoft, Facebook and Apple Lead the Fab Five
.... Pfizer Shows Good Volume Trends
.... Thor Surges off Gap Zone ....
Transport ETF Bounces off Key Retracement...
READ MORE
MEMBERS ONLY

Erin's Hits: Bear Market PMO Scan Screens a Few "Dogs"
by Erin Swenlin,
Vice President, DecisionPoint.com
** While Erin is away, we will be posting some of her "greatest hits" educational blogs. Some information may be dated **
With the market overbought and ready for at least a pullback, I decided to run one of my bear market Price Momentum Oscillator (PMO) scans to see if...
READ MORE
MEMBERS ONLY
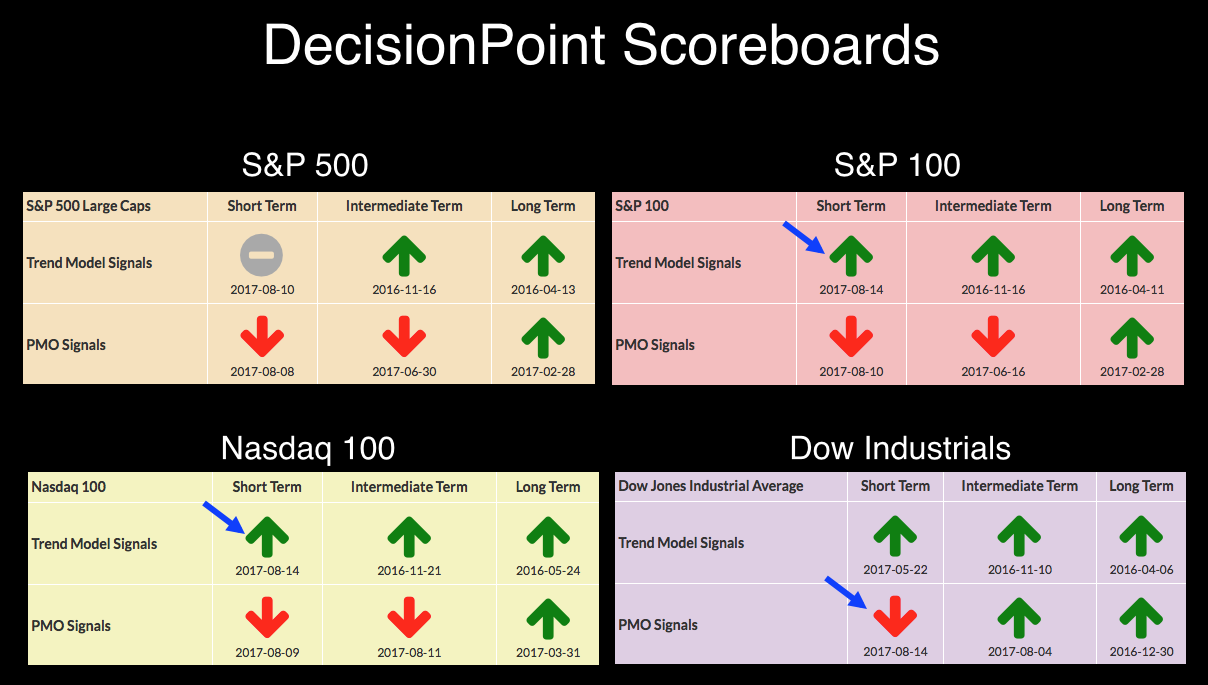
DP Bulletin: Three New Short-Term Signals
by Carl Swenlin,
President and Founder, DecisionPoint.com
On Friday the S&P 100 ($OEX) and Nasdaq 100 ($NDX) had Short-Term Trend Model (STTM) signal changes from BUY to NEUTRAL. Today they switched back to BUY. The dreaded whipsaw again. Also, the Dow Jones Industrial Average ($INDU) had a short-term PMO signal change from BUY to SELL....
READ MORE
MEMBERS ONLY
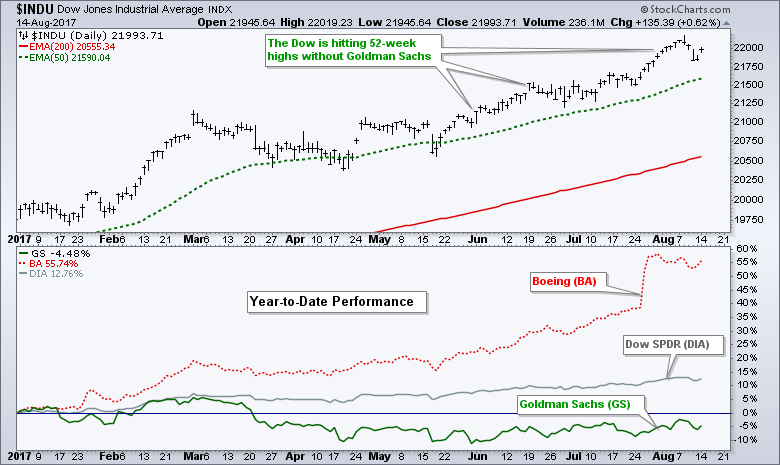
A Big Dow Component is Turning Up Again
by Arthur Hill,
Chief Technical Strategist, TrendInvestorPro.com
The Dow Industrials is in a clear uptrend with a fresh 52-week high just last week. Note that this senior Average is hitting these new highs without much help from its second largest component, Goldman Sachs. For reference, the Dow Diamonds (DIA) is up around 13% year-to-date and GS is...
READ MORE
MEMBERS ONLY
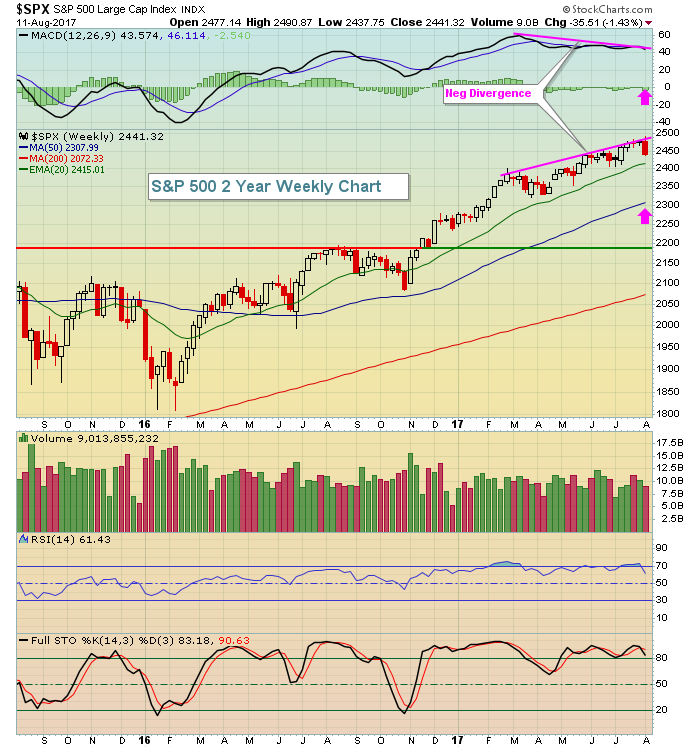
Evaluating The Technical Damage Inflicted On The S&P 500
by Tom Bowley,
Chief Market Strategist, EarningsBeats.com
Market Recap for Friday, August 11, 2017
Here's a fact: The benchmark S&P 500, along with all the major U.S. indices, had a rough week last week. Traders aren't used to weekly declines of more than 1%, yet that's exactly what...
READ MORE
MEMBERS ONLY
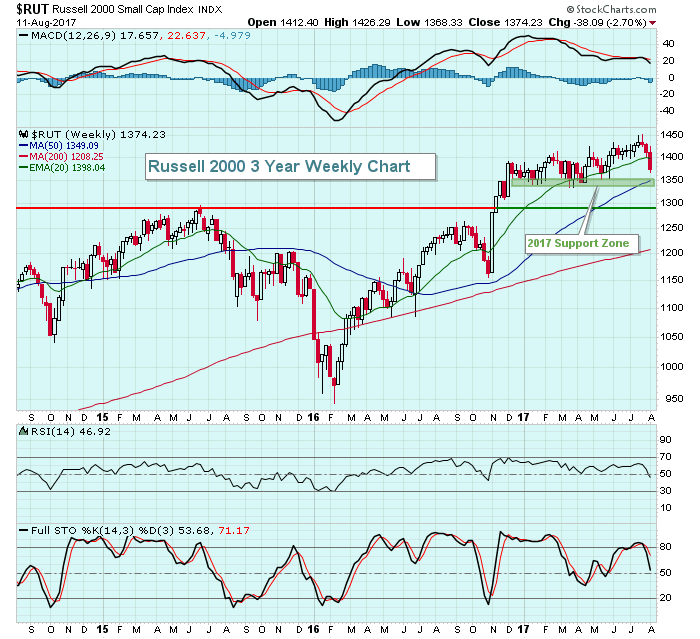
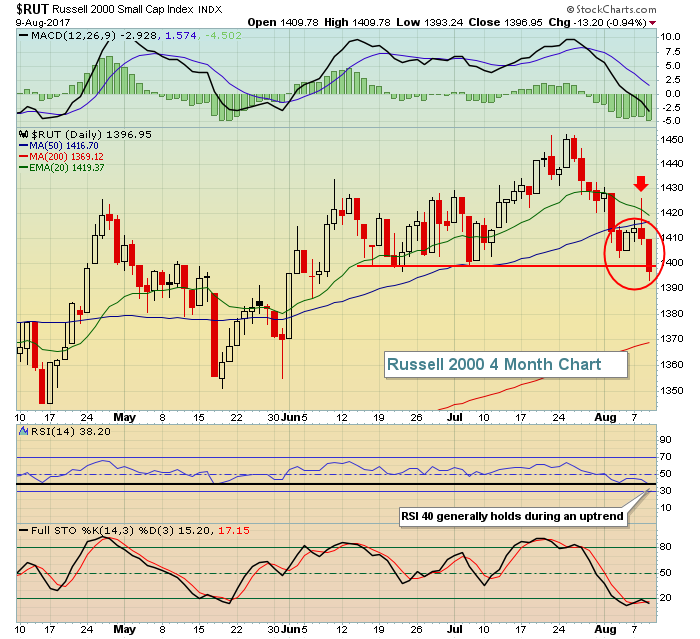
Small Caps Break Down; Where's Support?
by Tom Bowley,
Chief Market Strategist, EarningsBeats.com
The Russell 2000 fell for the third consecutive week and its 2.70% loss last week fell below its rising 20 week EMA for only the second time in 2017. It was a significant violation and now this index is staring at key price and moving average support in the...
READ MORE
MEMBERS ONLY

Wyckoff the International Language
by Bruce Fraser,
Industry-leading "Wyckoffian"
Golden Gate University’s technical analysis courses are in demand from students around the globe. The Wyckoff classes that Dr. Pruden and I teach welcomes students from many countries. These students, applying the Wyckoff Methodology, present stock case studies to the class. Often the international students highlight stocks listed on...
READ MORE
MEMBERS ONLY
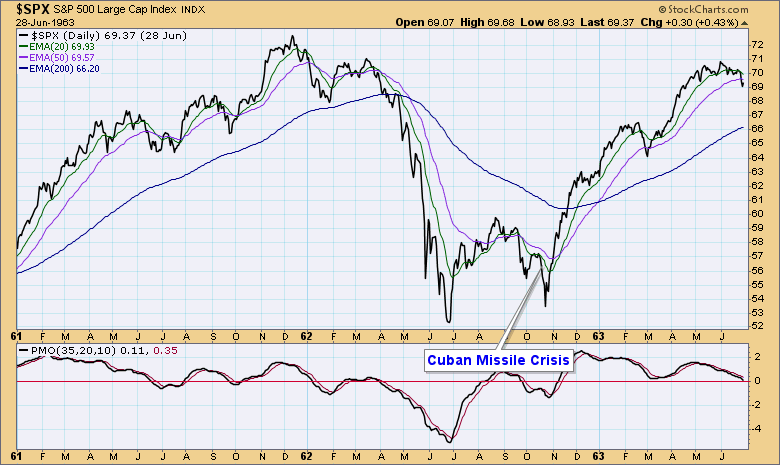
DP Weekly Wrap: NoKo Stumble (Supposedly)
by Carl Swenlin,
President and Founder, DecisionPoint.com
In October 1962 I was a 21-year-old B-47 aircraft mechanic in the Strategic Air Command. One morning that month I reported for duty only to find the aircraft ramp covered with bombers loaded with nuclear weapons. Welcome to the Cuban Missile Crisis. It was pretty tense for a few weeks,...
READ MORE
MEMBERS ONLY
DP Bulletin: Three New Signals Generated
by Carl Swenlin,
President and Founder, DecisionPoint.com
Today there were three signal changes: The S&P 100 Index ($OEX) and Nasdaq 100 Index ($NDX) had Short-Term Trend Model (STTM) signals change from BUY to NEUTRAL. And the Nasdaq 100 ($NDX) intermediate-term PMO BUY signal changed to SELL.
The two daily charts of $OEX and $NDX below...
READ MORE
MEMBERS ONLY

The Investor's Curse: "If It Ain't Broke, We Fix It Until It Is"
by Gatis Roze,
Author, "Tensile Trading"
This phrase is most often heard in reference to lawmakers and bureaucrats in Washington, DC, but I think it’s an appropriate reflection of what many investors struggle with as well. As an investor, you’ll seldom be destroyed by outside forces. If you falter and lose your assets, more...
READ MORE
MEMBERS ONLY
Weekly Market Review & Outlook (w/ Video) - A New High and a Big Decline
by Arthur Hill,
Chief Technical Strategist, TrendInvestorPro.com
.... RSP Takes a Big Hit after New High
.... Small-caps and Mid-caps Lead Breadth Lower
.... AD Volume Lines Turn Down
.... SPY Closes below 50-day EMA
.... IJR Pulls Back within Grinding Uptrend
.... Sector Balance Remains Long-term Bullish
.... Finance, Technology and Utilities Lead
.... Industrials-Healthcare Correct within Uptrends
.... Consumer Staples is the Second Weakest...
READ MORE
MEMBERS ONLY
Key Support Levels Lost, Futures Weak; How Low Do We Go?
by Tom Bowley,
Chief Market Strategist, EarningsBeats.com
Market Recap for Thursday, August 10, 2017
Technology (XLK, -1.97%) and financials (XLF, -1.78) led a steep selloff in equities on Thursday. It wasn't the worst day of the year for the NASDAQ, but it was pretty close. That aggressive index lost both its 20 day...
READ MORE
MEMBERS ONLY

US Stock Market Showing More Near-term Weakness
by Martin Pring,
President, Pring Research
* More stock market indicators showing weakness
* Bonds close to a breakout
* Commodity rally over?
* Dollar bottoming or about to break down?
More stock market indicators showing weakness
Last week I made the case for a correction in the market based on some specific indicators that has started to flash some...
READ MORE
MEMBERS ONLY
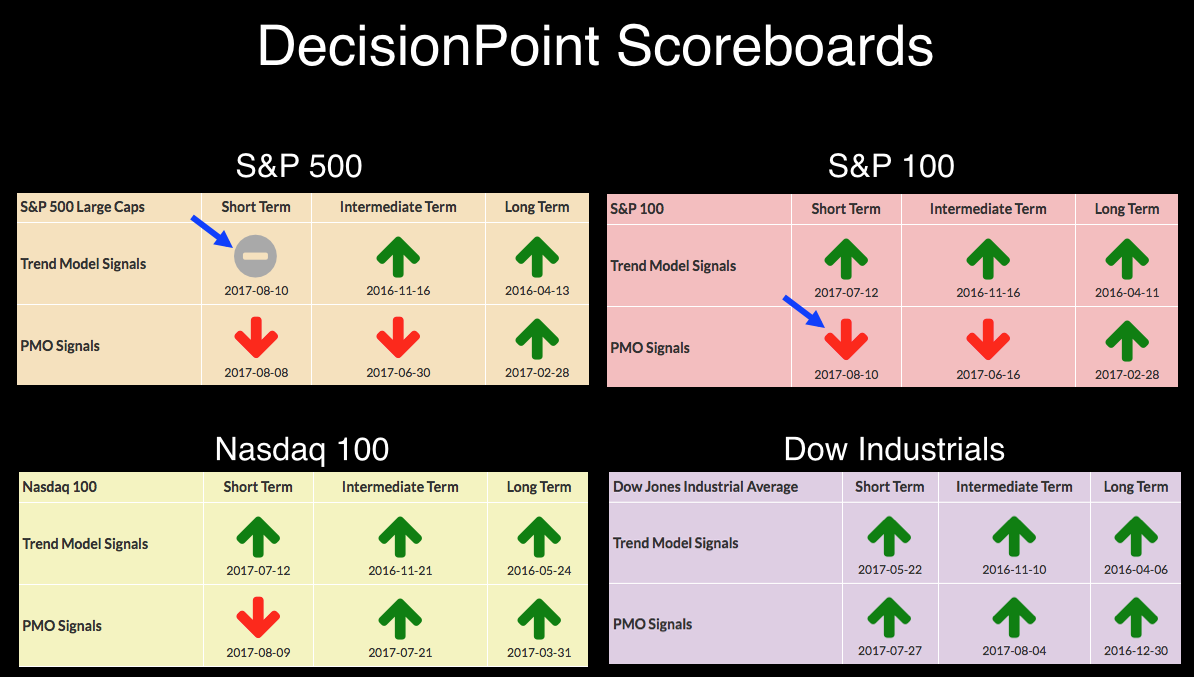
DP Bulletin: S&P 100 ($OEX) Generates ST PMO SELL Signal; S&P 500 Generates ST Trend Model NEUTRAL Signal
by Carl Swenlin,
President and Founder, DecisionPoint.com
Today the S&P 100 Index ($OEX) daily PMO crossed down through its signal line and generated a short-term PMO SELL signal. Of the four major indexes on our score board, three have switched to short-term PMO SELL signals. Additionally, the S&P 500 Index 5EMA crossed down...
READ MORE
MEMBERS ONLY
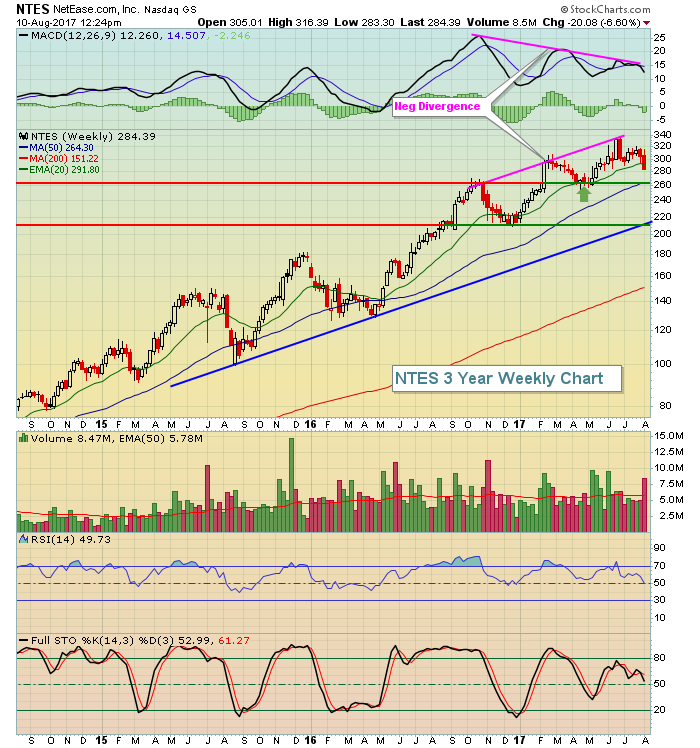
NetEase.com Getting Crushed After Earnings; The Bad News? The Selling Isn't Over
by Tom Bowley,
Chief Market Strategist, EarningsBeats.com
After the bell on Wednesday, NetEase.com (NTES) was hammered as its Earnings Per Share (EPS) of $3.86 fell short of Wall Street consensus estimates of $4.07. While that was bad enough from a fundamental perspective, the technical conditions had already begun to deteriorate in the form of...
READ MORE
MEMBERS ONLY

VOLATILITY SPIKES AS MARKET SELLOFF CONTINUES -- VIX INDEX CLIMBS TO THREE-MONTH HIGH AND PLAYS CATCH-UP TO RISING NASDAQ 100 VOLATILITY INDEX -- MAJOR AVERAGES LOSE MORE GROUND -- THE S&P 500 AND NASDAQ 100 DROP TOWARD 50-DAY AVERAGES
by John Murphy,
Chief Technical Analyst, StockCharts.com
SMALL AND MID SIZE STOCK INDEXES BREAK SUPPORT... Yesterday's message showed small and midcap stock indexes testing support at their July lows, and warned that any further weakness would be bad for them and the rest of the market. Both indexes have broken support levels and are now...
READ MORE
MEMBERS ONLY

SystemTrader - Tempering Volatility by Using RSI to Rank Stocks
by Arthur Hill,
Chief Technical Strategist, TrendInvestorPro.com
---- An Attempt to Lower the Drawdowns
---- Strategy Review
---- Consulting, Software and Data
---- Rate-of-Change versus RSI
---- A High-Flyer versus a Boring Uptrend
---- Testing with 14-day RSI Rank
---- Conclusions and Caveat Emptor
---- Scan Code ----
An Attempt to Lower the Drawdowns ----
Last week...
READ MORE
MEMBERS ONLY
Stocks Recover After Early Drop; Futures Weak Again
by Tom Bowley,
Chief Market Strategist, EarningsBeats.com
Market Recap for Wednesday, August 9, 2017
U.S. equities were under early fire on Wednesday, but there was a steady recovery throughout the balance of the day with little technical damage done by session end. The Russell 2000 was one exception, however, as that aggressive small cap index closed...
READ MORE
MEMBERS ONLY
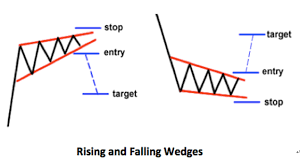
Erin's Hits: What's the Difference Between an Ascending Wedge and an Ascending Triangle?
by Erin Swenlin,
Vice President, DecisionPoint.com
** While Erin is away, we will be posting some of her "greatest hits" educational blogs. Some information may be dated **
I recently received a question from one of the attendees of yesterday's webinar (recording available here). I was reviewing the charts in our DP Chart Gallery...
READ MORE
MEMBERS ONLY
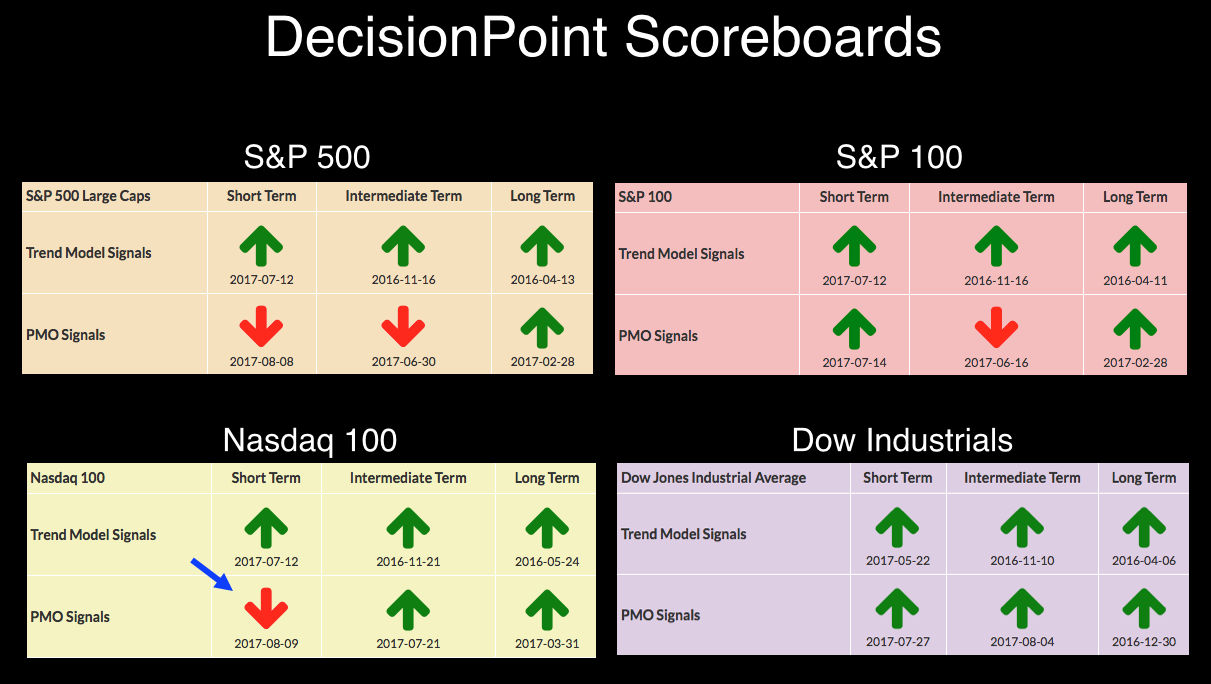
DP Bulletin: Nasdaq 100 ($NDX) Generates ST PMO SELL Signal
by Carl Swenlin,
President and Founder, DecisionPoint.com
Today on the daily chart the Nasdaq 100 ($NDX) PMO dropped below its signal line and generated a short-term PMO SELL signal.
This is not what I would call a robust crossover. It is more the inevitable result of price running flat to slightly down, which causes the PMO and...
READ MORE
MEMBERS ONLY

GLOBAL STOCKS TRADE LOWER ON HEIGHTENED TENSIONS -- MACD LINES FOR S&P 500 TURN NEGATIVE -- SMALL AND MIDSIZE STOCKS ARE DAY'S BIGGEST LOSERS -- VIX INDEX GAINS 8% -- RECENT GAINS IN THE NASDAQ 100 VOLATILITY INDEX ARE OF MORE CONCERN
by John Murphy,
Chief Technical Analyst, StockCharts.com
S&P 500 PULLS BACK ... Global stocks are in the red today, which continues the profit-taking that started yesterday afternoon. Yesterday's downside reversal day in U.S. stock indexes on rising volume signaled the likelihood of more profit-taking. Foreign stocks in Europe and Asia are falling more...
READ MORE
MEMBERS ONLY
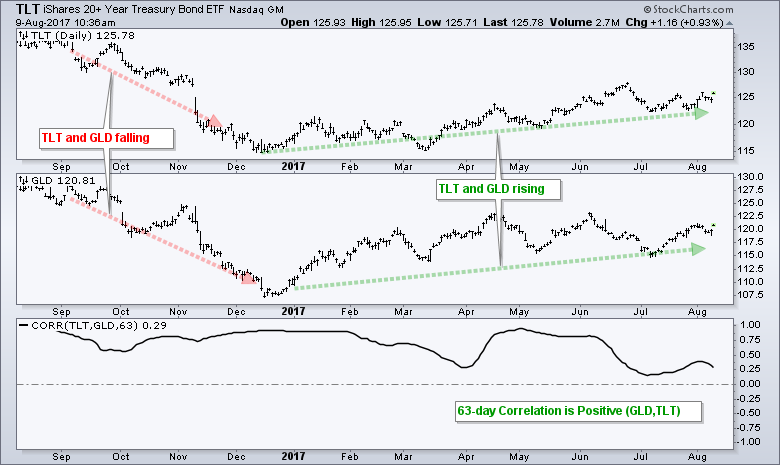
Gold and Bonds are Moving in Tandem
by Arthur Hill,
Chief Technical Strategist, TrendInvestorPro.com
The Gold SPDR (GLD) and the 20+ YR T-Bond ETF (TLT) are both having good years with GLD up around 10% year-to-date and TLT up around 7%. As the chart below shows, these two are positively correlated over the past 12 months. The indicator window shows the 63-day Correlation Coefficient...
READ MORE