MEMBERS ONLY

Staples And Materials: Which Sector To Hold And Which One To Fold?

by Martin Pring,
President, Pring Research
The relationship between Staples and Materials
* Long-term relative trends
* Breakouts and breakdowns
* Which of the materials sub-components are breaking out?
* Euro looks short-term toppy
The relationship between Staples and Materials
Most of the time I concentrate on the trend of the overall market, but some sector charts for Consumer Staples...
READ MORE
MEMBERS ONLY
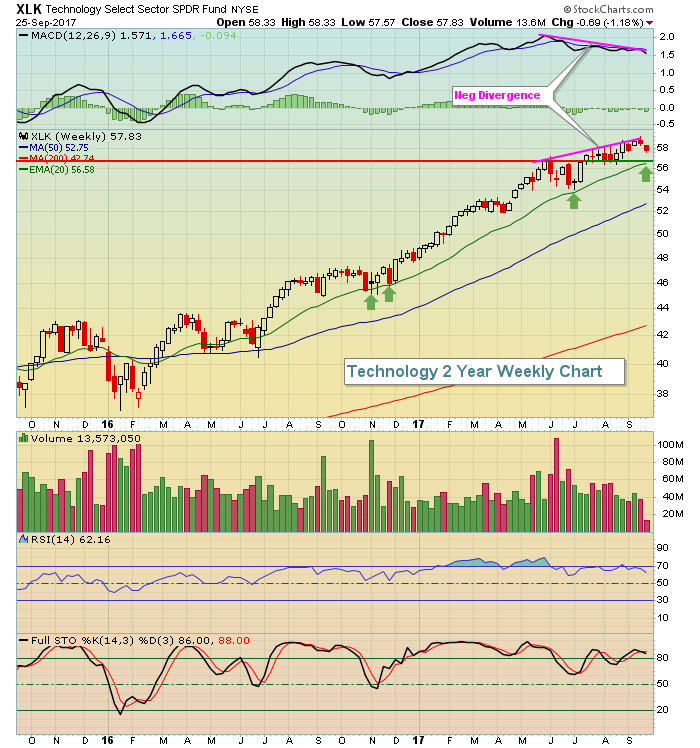
Technology Slumps As Facebook Falls On Heavy Volume

by Tom Bowley,
Chief Market Strategist, EarningsBeats.com
Market Recap for Monday, September 25, 2017
Technology (XLK, -1.18%) was the only real problem on Monday, but it was a big problem. Mobile telecommunications ($DJUSWC) and internet stocks ($DJUSNS) were the big losers with the latter slammed by Facebook (FB), which dropped nearly 5% on extremely heavy volume....
READ MORE
MEMBERS ONLY
Broad Selling in Nasdaq 100 - Biotechs Buck Selling - TLT Turns Up - Five Stocks

by Arthur Hill,
Chief Technical Strategist, TrendInvestorPro.com
.... Small-caps Extend to New Highs
.... Broad Selling in the Nasdaq 100
.... XBI and IBB Edge Higher
.... COPX and JJC Correct within Uptrends
.... TLT Turns Up within Uptrend
.... Charts to Watch: DAL, CB, LEN, RMD, SBAC ....
Small-caps Extend to New Highs
The S&P SmallCap iShares (IJR) and the Russell...
READ MORE
MEMBERS ONLY
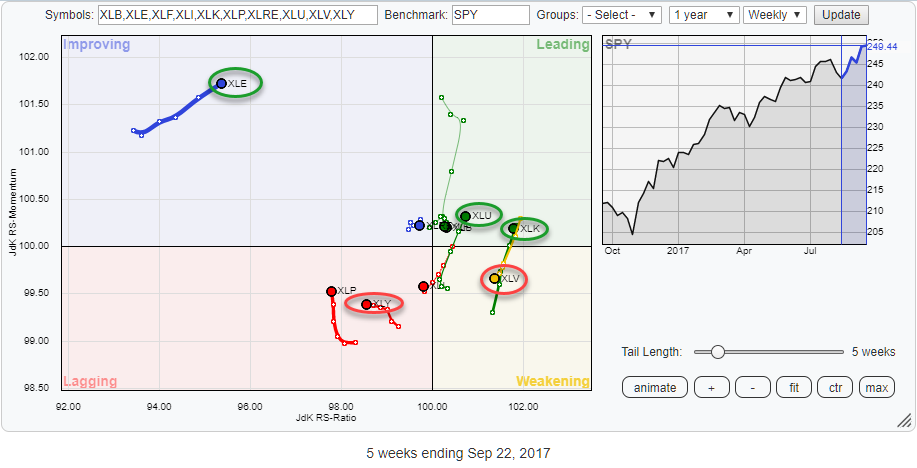
Pair trade opportunity in XLV/XLK and potentially strong (rare) rotational pattern for XLI

by Julius de Kempenaer,
Senior Technical Analyst, StockCharts.com
The Relative Rotation Graph above holds the ten sector SPDR ETFs that make up the complete S&P 500 index (SPY).
At the moment the positioning of the various sectors and their rotational patterns are relatively evenly spread over the RRG canvas except for XLE which is far away...
READ MORE
MEMBERS ONLY
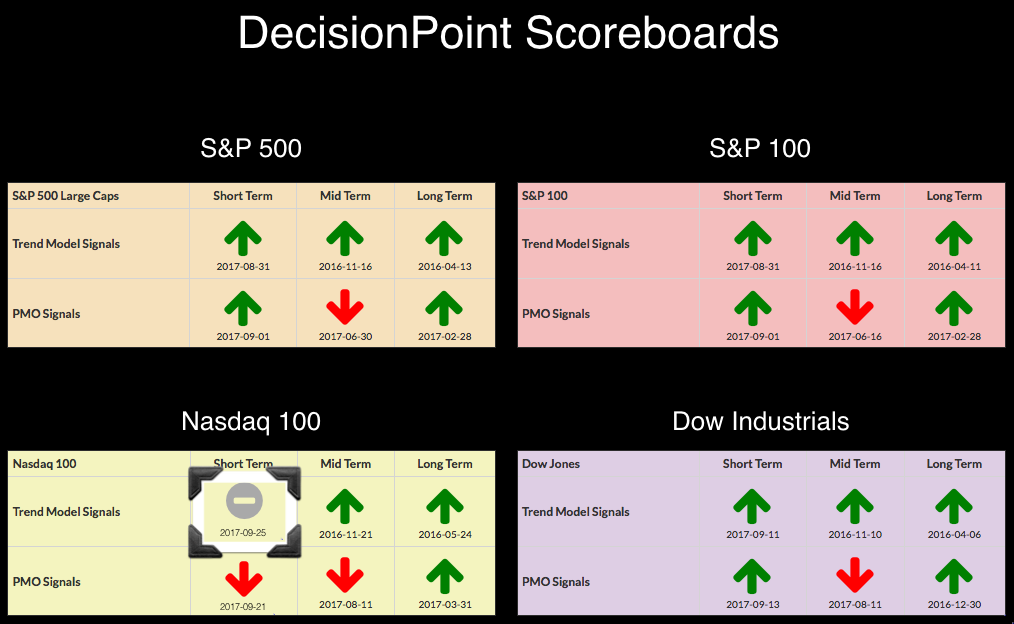
Another BUY Signal Bites the Dust for the NDX - New ITTM SELL Signal for UNG

by Erin Swenlin,
Vice President, DecisionPoint.com
The Nasdaq 100 lost its PMO BUY signal on Friday and today it loses its ST Trend Model BUY signal (along with important support!). Natural Gas (UNG) had just picked up an IT Trend Model BUY signal, but it has whipsawed away into an ITTM SELL signal.
Today's...
READ MORE
MEMBERS ONLY
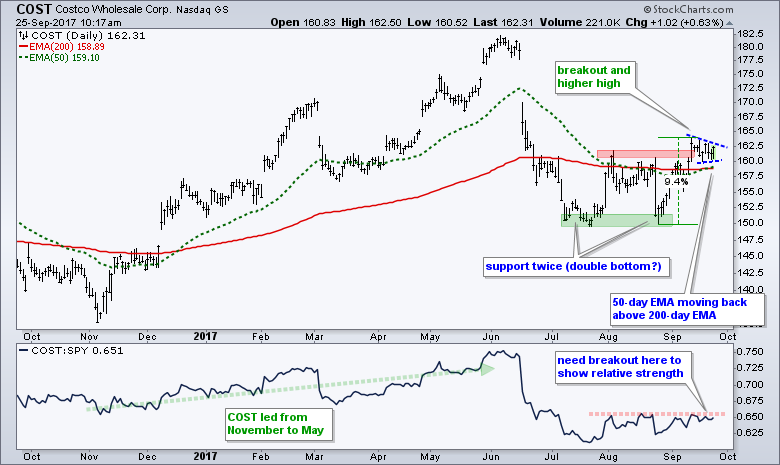
Costco Forms Bullish Pennant Near Breakout
by Arthur Hill,
Chief Technical Strategist, TrendInvestorPro.com
Costco (COST) fell on hard times this summer with a plunge from the low 180s to the 150 area. Despite this gap and sharp decline, the stock firmed in July-August and surged above the red resistance zone in September. Notice that the stock found support in the 150 area with...
READ MORE
MEMBERS ONLY
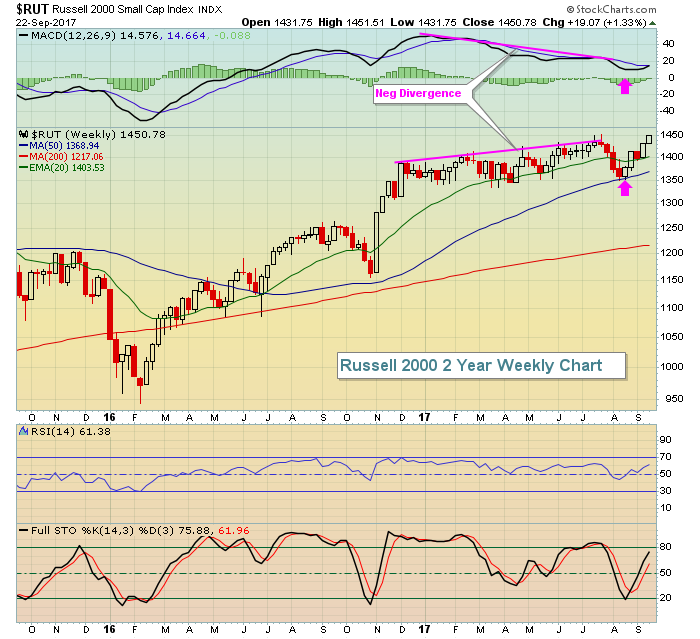
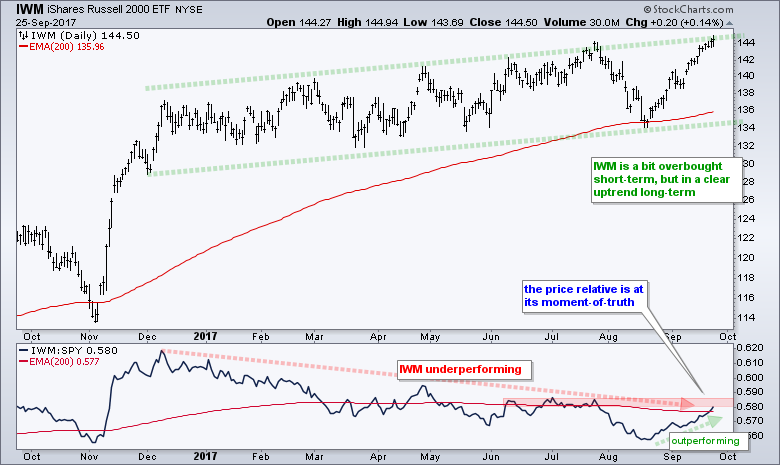
Russell 2000 Tests Key Resistance, Primed To Lead In 4th Quarter
by Tom Bowley,
Chief Market Strategist, EarningsBeats.com
Market Recap for Friday, September 22, 2017
Friday was a bifurcated kind of day on Wall Street. We saw a small loss on the Dow Jones, while there were slight gains on the other major indices. The Russell 2000, in particular, saw relative strength and gained nearly 7 points to...
READ MORE
MEMBERS ONLY
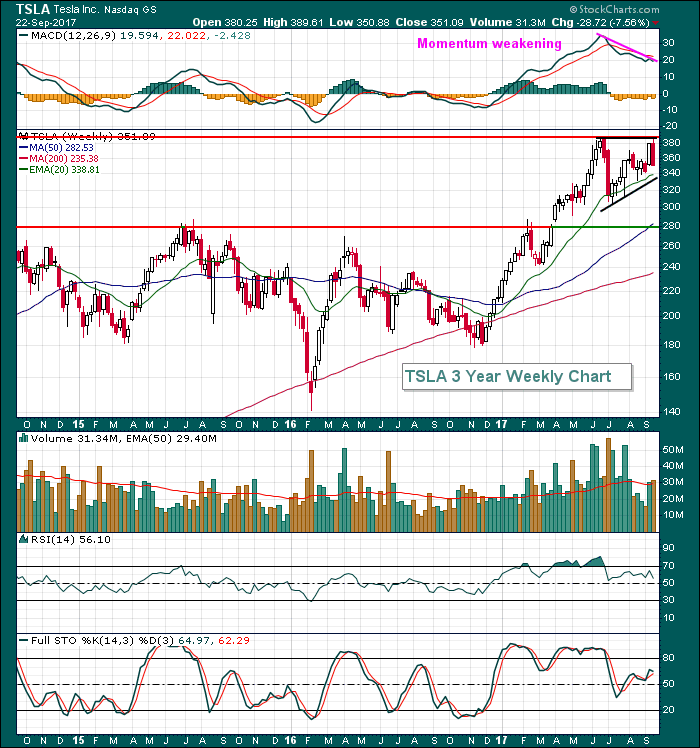
Tesla Weakens But Chart Is On Cruise Control
by Tom Bowley,
Chief Market Strategist, EarningsBeats.com
Tesla (TSLA) remains a crowd favorite as the stock's 2017 advance has been accompanied by extremely heavy volume. I see major accumulation when I look at TSLA's chart. But like every other stock, momentum can become an issue from time to time and TSLA appears to...
READ MORE
MEMBERS ONLY

RISING BOND YIELDS MAY BE PULLING MONEY OUT OF TECHNOLOGY INTO CHEAPER PARTS OF THE MARKET -- APPLE, AMAZON, AND GOOGLE LOSE GROUND -- RISING OIL PRICES MAY CONTRIBUTE TO HIGHER BOND YIELDS -- RISING YIELDS ARE BOOSTING SMALL CAPS

by John Murphy,
Chief Technical Analyst, StockCharts.com
APPLE, AMAZON, AND GOOGLE WEIGH ON TECH SECTOR... While the stock market is holding up okay, some rotations are going on beneath the surface. One is the rotation out of large cap tech stocks, former market leaders, into cheaper parts of the market like financials, small caps, and transports. Let&...
READ MORE
MEMBERS ONLY
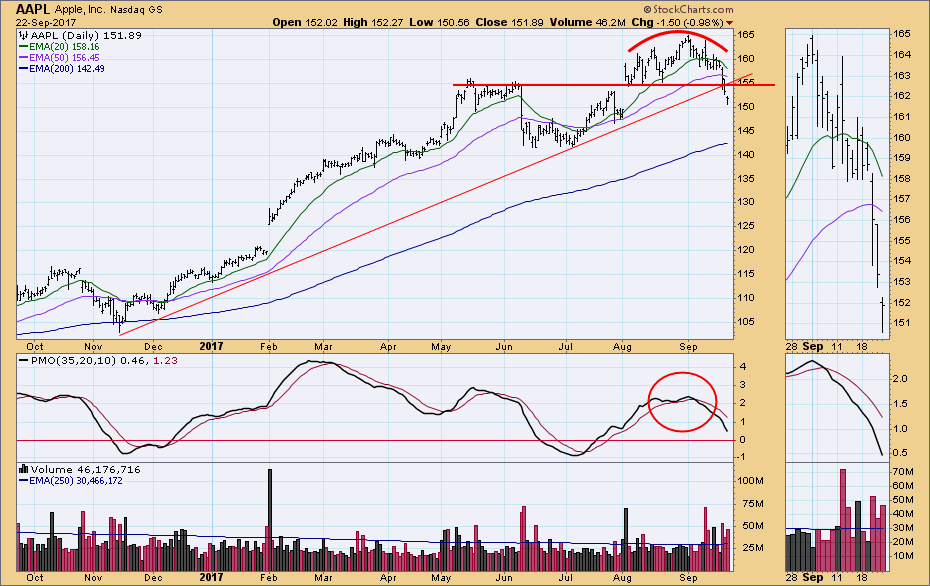
DP Weekly Wrap: AAPL Leads Market Top

by Carl Swenlin,
President and Founder, DecisionPoint.com
We usually feature a SPY chart in this space, but Apple (AAPL) has really grabbed my attention recently. I have been watching it for a few weeks as it formed a rounded top, and finally broke down through horizontal support on Thursday. AAPL is important to the broad market because...
READ MORE
MEMBERS ONLY

Do Investors Love Their Children Too?

by Gatis Roze,
Author, "Tensile Trading"
The Public Relations industry has crisis simulation firms that actually come into corporations and compress a hypothetical month-long disaster into a few stressful hours in order to see how management responds. I’d like to do something similar, but in the family financial arena with parents and children. Sadly, however,...
READ MORE
MEMBERS ONLY
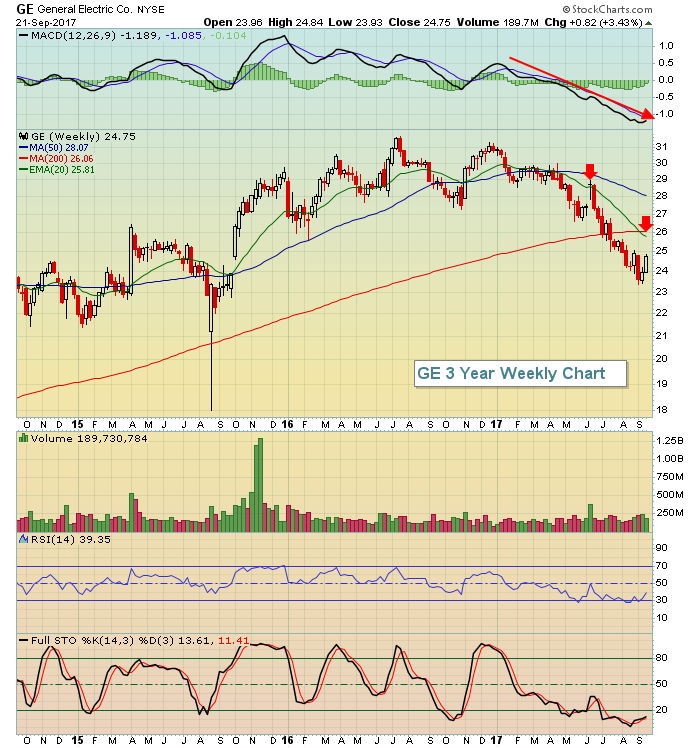
Technology Hit Hard, Results in PMO SELL Signal on Nasdaq 100
by Erin Swenlin,
Vice President, DecisionPoint.com
As you can see below, the NDX's steep decline has thrown the Price Momentum Oscillator (PMO) below its signal line. I don't expect to see similar readings from the other indexes as they haven't been hit as hard as techs on the latest declines....
READ MORE
MEMBERS ONLY

Weekly Market Review & Outlook (w/ Video) - An Abrupt Change in Leadership
by Arthur Hill,
Chief Technical Strategist, TrendInvestorPro.com
.... An Abrupt Change in Leadership
.... News and No Man's Land
.... New High Parade Continues
.... Uptrends are Slowing, Not Reversing
.... A Strong Surge for Small-caps
.... Finance, Tech, Industrials and Materials Lead
.... Healthcare and Utilities Take a Dip
.... Consumer Discretionary Gets Anemic Bounce
.... Energy SPDR Breaks Summer Highs
.... Strong Selling...
READ MORE
MEMBERS ONLY
Taking A Look At Near-Term Downside Risk For The S&P 500
by Tom Bowley,
Chief Market Strategist, EarningsBeats.com
Market Recap for Thursday, September 21, 2017
We are in one of the most bearish historical periods of the year and I've provided a bit more information about it in the Historical Tendencies section below. I'm pointing this out because equities took a break on Thursday...
READ MORE
MEMBERS ONLY
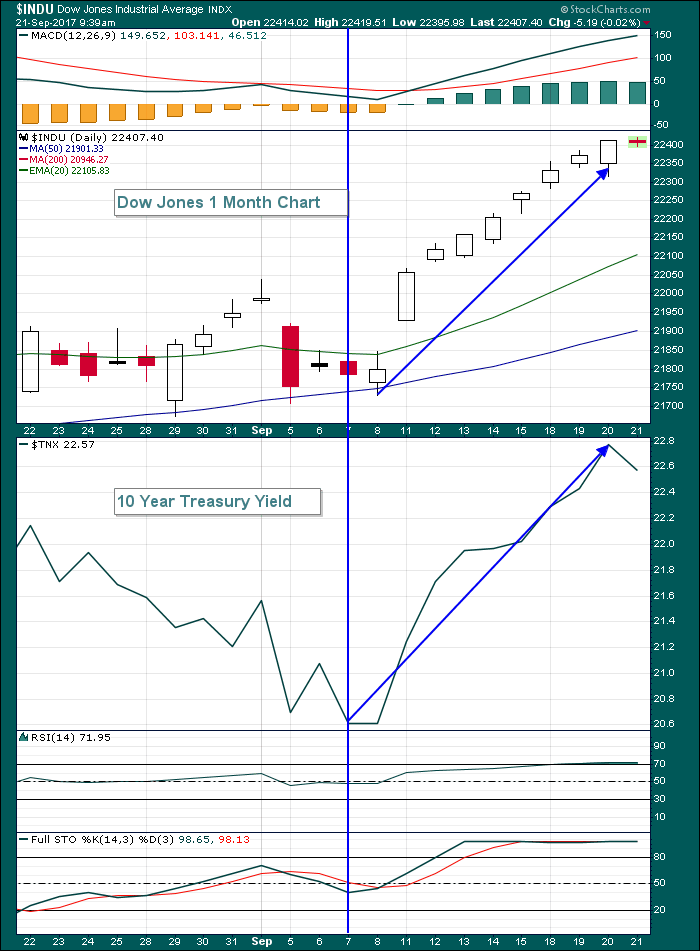
Let Interest Rates Soar If You're Long Equities!
by Tom Bowley,
Chief Market Strategist, EarningsBeats.com
Fed Chair Janet Yellen suggested there'd be another interest rate hike in 2017 and the Fed's overall tone was a bit more hawkish than was anticipated by Wall Street. That resulted in a big spike in the 10 year treasury yield at 2pm EST yesterday, the...
READ MORE
MEMBERS ONLY
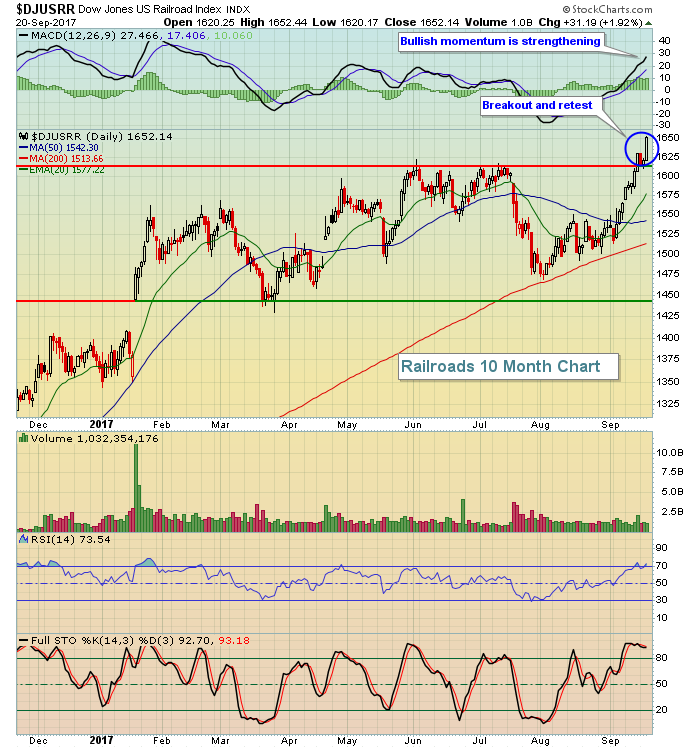
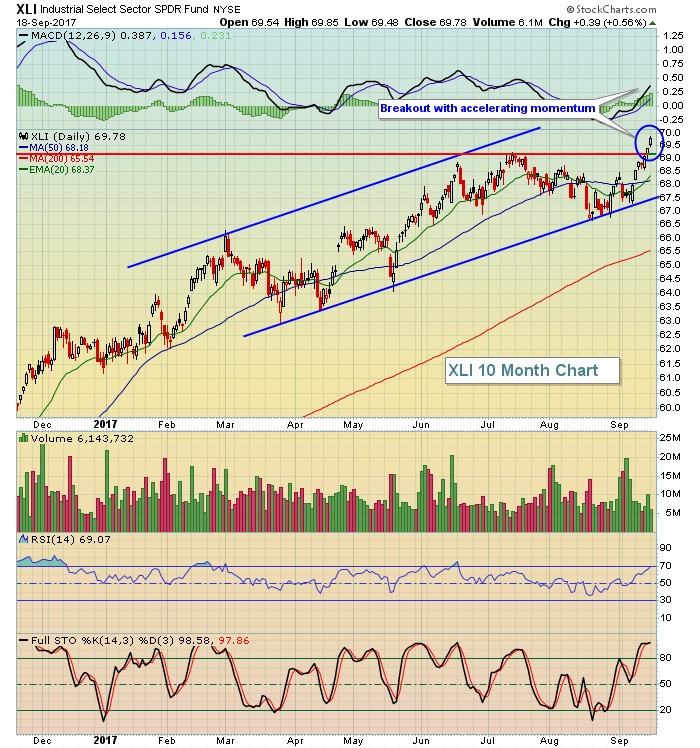
Railroads, Transports Lead Dow Jones To 6th Consecutive All-Time High
by Tom Bowley,
Chief Market Strategist, EarningsBeats.com
Market Recap for Wednesday, September 20, 2017
It was another stellar day for industrials (XLI, +0.73%) as this sector led the Dow Jones to a 6th consecutive record closing high. The gains have been fairly slow and methodical, but that's how bull market advances work. They tend...
READ MORE
MEMBERS ONLY
Equal-Weight ETFs Log New ITTM BUY Signals
by Erin Swenlin,
Vice President, DecisionPoint.com
DecisionPoint tracks not only the sector SPDRS, but we also follow the equal-weight versions. For more information about the benefits of trading equal-weight ETFs, you can read this article written by Carl. Today is a teachable moment with these three IT Trend Model BUY signals arriving on the same day....
READ MORE
MEMBERS ONLY

Fed Unwinding Triggers Rates To Rise, A Dollar Reversal And A Boost To Financials
by Martin Pring,
President, Pring Research
* Dollar begins a short-term rally
* Fed action boosts rates
* Financials set to move higher
Fed action on Wednesday had the effect of boosting rates, thereby causing short-term reversals in several markets and relationships. These inflexion points in the markets are expected to influence prices over the next few weeks.
Dollar...
READ MORE
MEMBERS ONLY

DOW TRANSPORTS RISE TO HIGHEST LEVEL IN TWO MONTHS -- FEDEX AND UNITED PARCEL SERVICE HIT NEW RECORDS -- NORFOLK SOUTHERN AND UNION PACIFIC LEAD DOW JONES US RAILROAD INDEX TO RECORD -- TRUCKING INDEX ALSO HITS NEW RECORD
by John Murphy,
Chief Technical Analyst, StockCharts.com
DOW TRANSPORTS RISE TO TWO-MONTH HIGH... Recent messages have described the gradual improvement in transportation stocks since mid-August. It started with their ability to reclaim their 200-day average in late August, followed by a move back above their 50-day average earlier this month. Chart 1 shows the Dow Jones Transportation...
READ MORE
MEMBERS ONLY
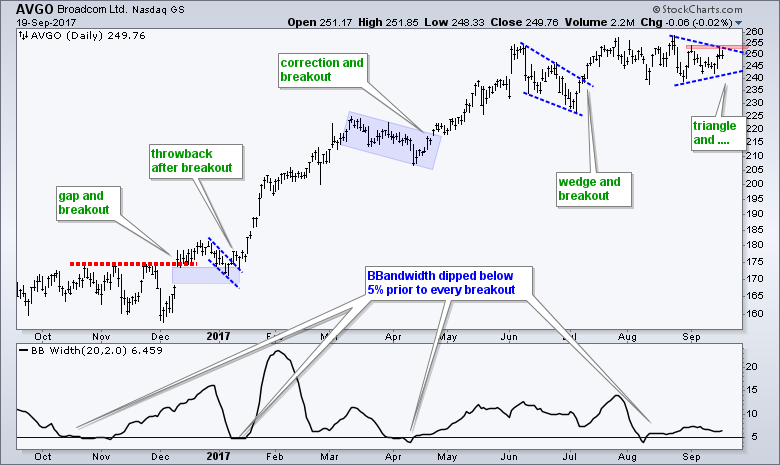
Broadcom Consolidates within Uptrend $AVGO
by Arthur Hill,
Chief Technical Strategist, TrendInvestorPro.com
This is my third straight DITC posting with a semiconductor stock. The first featured Texas Instruments forming a cup-with-handle pattern and the second featured Intel with a surge towards long-term resistance. Today's chart focuses on Broadcom, which is actually lagging the S&P 500 SPDR over the...
READ MORE
MEMBERS ONLY
The Fed's On Deck And THIS Is Why We Want To See Interest Rates Rise
by Tom Bowley,
Chief Market Strategist, EarningsBeats.com
Reminder
Be sure to scroll down to the bottom of my article and click the "Notify Me" button if you'd like to receive my article each morning before the stock market opens. The subscription is FREE and my article is a great way to start your...
READ MORE
MEMBERS ONLY

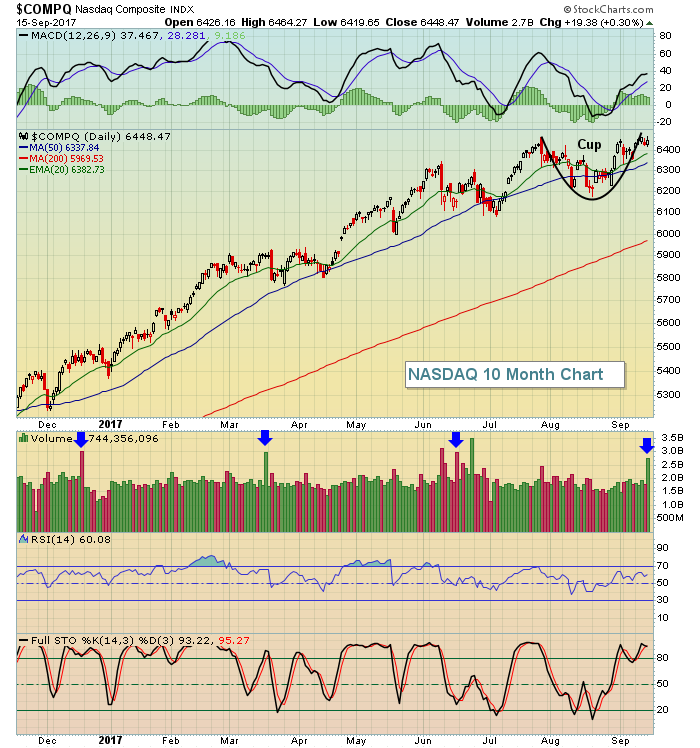
$COMPQ Up Close

by Bruce Fraser,
Industry-leading "Wyckoffian"
The NASDAQ Composite ($COMPQ) has consolidated since early June. Two very prominent Buying Climax peaks arrived, one in June and the next in late July. They are labeled on the vertical chart and the Point and Figure chart. This has slowed the advance of the $COMPQ to a crawl. Meanwhile...
READ MORE
MEMBERS ONLY

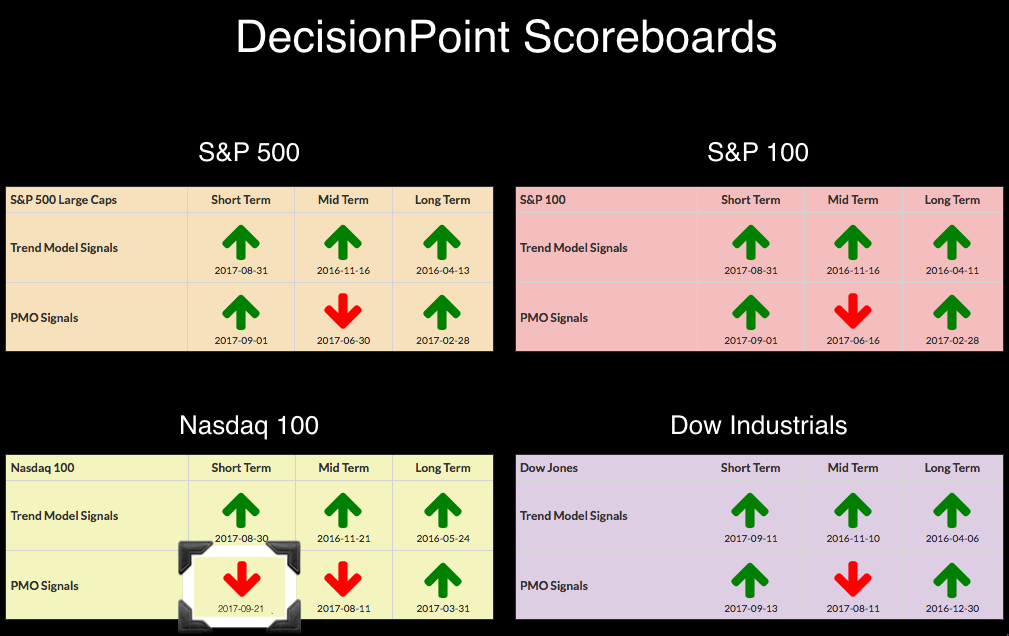
DP Alert: Short-Term Overbought Conditions Suggest Upcoming Pause/Pullback
by Erin Swenlin,
Vice President, DecisionPoint.com
It may seem strange that all of the Scoreboards are green except in the area of intermediate-term PMO signals. A look at the weekly charts for all four indexes reveals all but the NDX weekly PMO are rising up toward IT PMO BUY signals. The margin is still rather large...
READ MORE
MEMBERS ONLY

DOW JONES INTEGRATED OIL & GAS INDEX IS TRADING OVER ITS 200-DAY AVERAGE AND MAY BE ON VERGE OF UPSIDE BREAKOUT -- CHEVRON TOUCHES THREE-YEAR HIGH -- PHILLIPS 66 NEARS ALL-TIME HIGH -- CONOCOPHILLIPS RISES TO HIGHEST LEVEL IN FOUR MONTHS
by John Murphy,
Chief Technical Analyst, StockCharts.com
DOW JONES US INTEGRATED OIL & GAS INDEX MAY BE BREAKING OUT... Energy stocks have been the market's weakest performers during 2017. They're starting, however, to take a turn for the better, both in absolute and relative terms. Energy has been the market's strongest...
READ MORE
MEMBERS ONLY
Banks Strengthen To Lead Financials, Major Indices Higher
by Tom Bowley,
Chief Market Strategist, EarningsBeats.com
Market Recap for Monday, September 18, 2017
It was another very bullish day on Wall Street as most indices finished with gains once again. The Russell 2000 ($RUT) led the charge with a 0.65% rise. Gains in the Dow Jones and S&P 500 were more modest, but...
READ MORE
MEMBERS ONLY
Materials, Industrials and Tech Lead New High List - GOOGL, AMZN and FB Weigh - Five Stock Setups
by Arthur Hill,
Chief Technical Strategist, TrendInvestorPro.com
.... 52-week Highs Reflect Broad Strength
.... Materials, Industrials and Technology Lead New High List
.... Alphabet, Amazon and Facebook are Dragging
.... CSCO Hits Multi-Month High
.... Fiserv Turns Up after Pullback
.... AMD Bounces off Key Retracement
.... CHD and CL Start Turning UP
.... How to Handle Overvalued Stocks ....
52-week Highs Reflect Broad Strength
Large-caps,...
READ MORE
MEMBERS ONLY

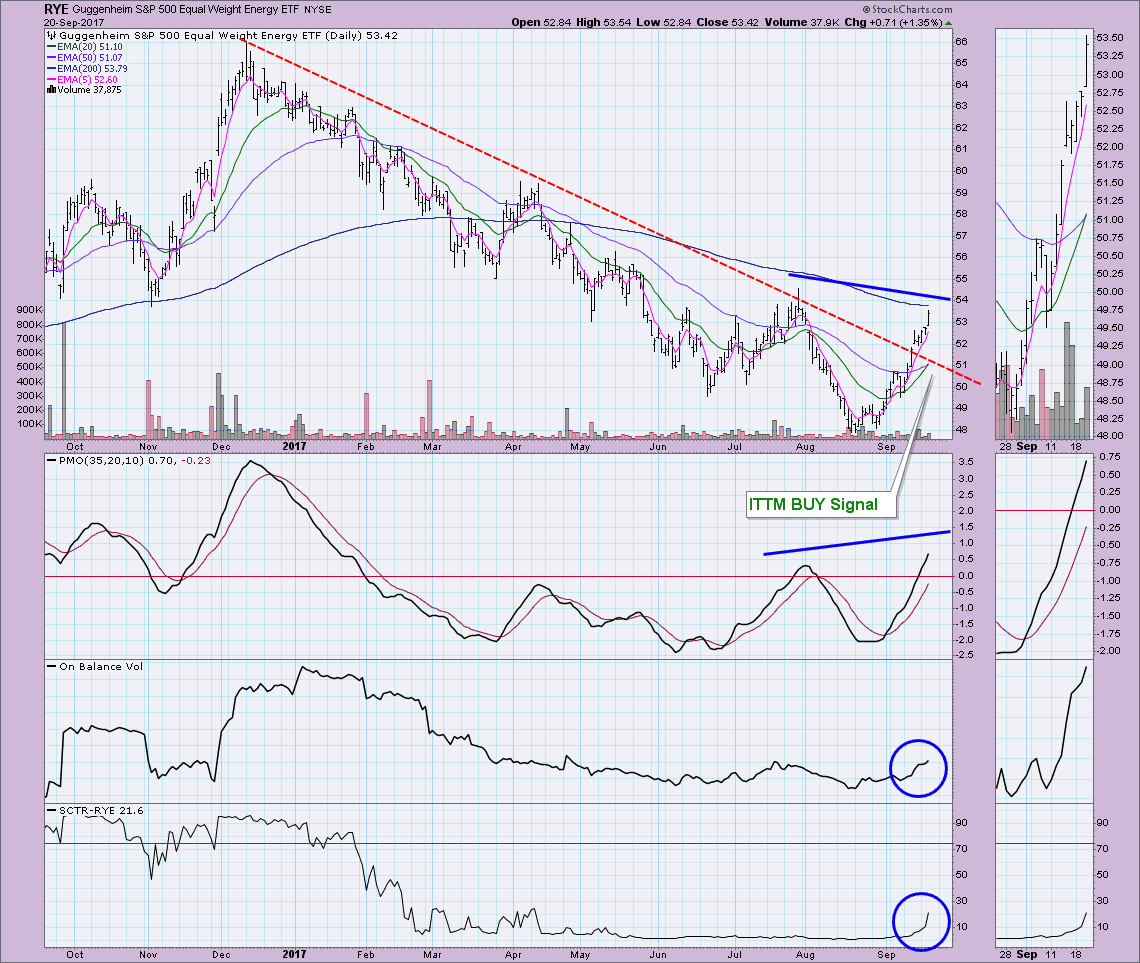
On Fire! Energy, Small- and Mid-Caps, Financials All Trigger ITTM BUY Signals
by Erin Swenlin,
Vice President, DecisionPoint.com
The last two days have issued SIX new Intermediate-Term Trend Model (ITTM) BUY signals. It shouldn't be a surprise that the Energy SPDR (XLE) and Natural Gas (UNG) triggered given the buzz around that sector last week on MarketWatchers LIVE and headlines on our StockCharts.com Blogs page....
READ MORE
MEMBERS ONLY

Aerodynamics for Investors

by Greg Morris,
Veteran Technical Analyst, Investor, and Author
Oh no! He is losing it! I have stated a few times that the well seems to be running low; this article might confirm that. Here is an attempt to turn basic aerodynamics into an investment process.
Where:
CL is the coefficient of Lift
p is the density of air...
READ MORE
MEMBERS ONLY

BANKS ARE LEADING FINANCIAL SECTOR HIGHER -- BANK LEADERS INCLUDE CITIGROUP, BANK OF AMERICA, AND JP MORGAN -- FIVE-YEAR TREASURY YIELD CLEARS 50-DAY AVERAGE -- 7-10 YEAR TREASURY BOND ISHARES ARE TESTING SUPPORT -- UTILITIES WEAKEN ALONG WITH BONDS
by John Murphy,
Chief Technical Analyst, StockCharts.com
FINANCIAL SPDR CLEARS 50-DAY AVERAGE... Financial stocks are helping lead the market higher today. Chart 1 shows the Financial Sector SPDR (XLF) trading at the highest level in five weeks after clearing its 50-day average. Its relative strength ratio (top of chart) continues its September rebound. Banks are leading the...
READ MORE
MEMBERS ONLY
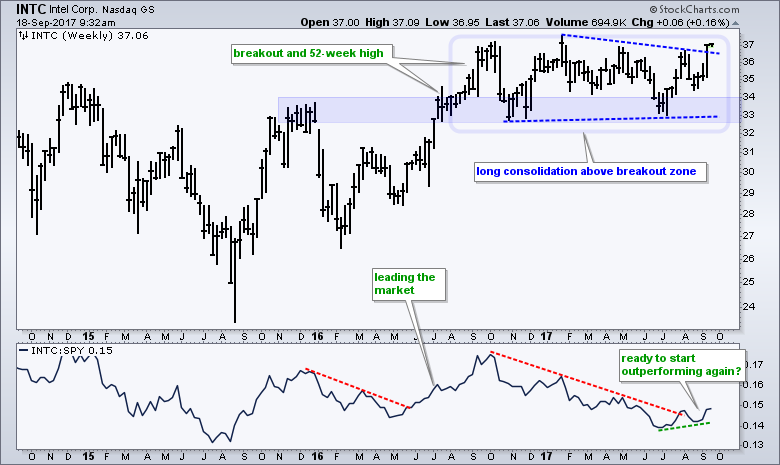
Intel Goes for a Big Breakout $INTC
by Arthur Hill,
Chief Technical Strategist, TrendInvestorPro.com
Some sixty stocks in the S&P 500 were up 5% or more last week, and Intel was one of them. Intel's importance seems to have diminished over the years, but it is still an industry gorilla that accounts for around 11% of the Semiconductor ETF (SMH)...
READ MORE
MEMBERS ONLY
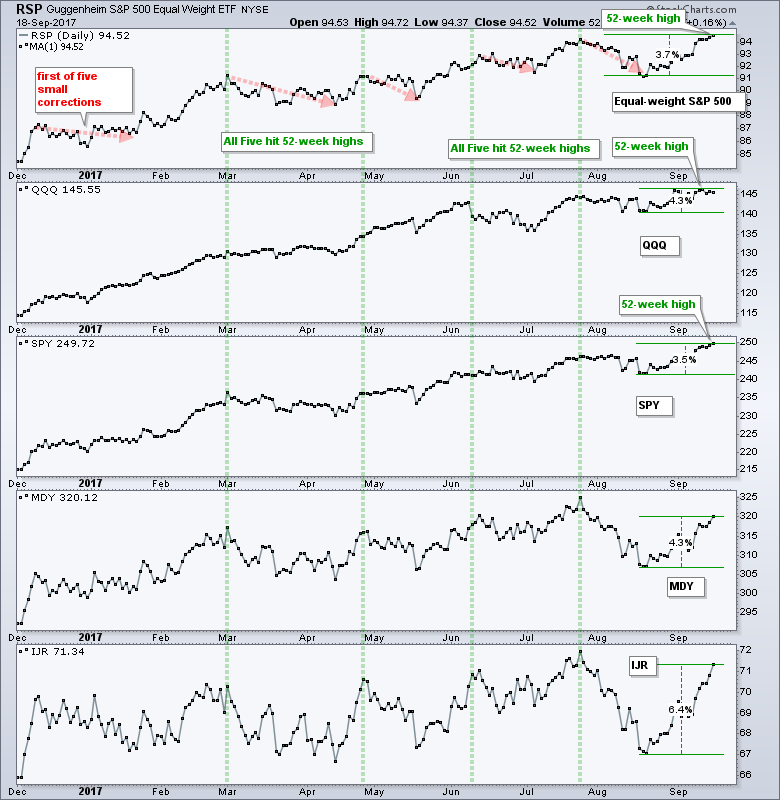
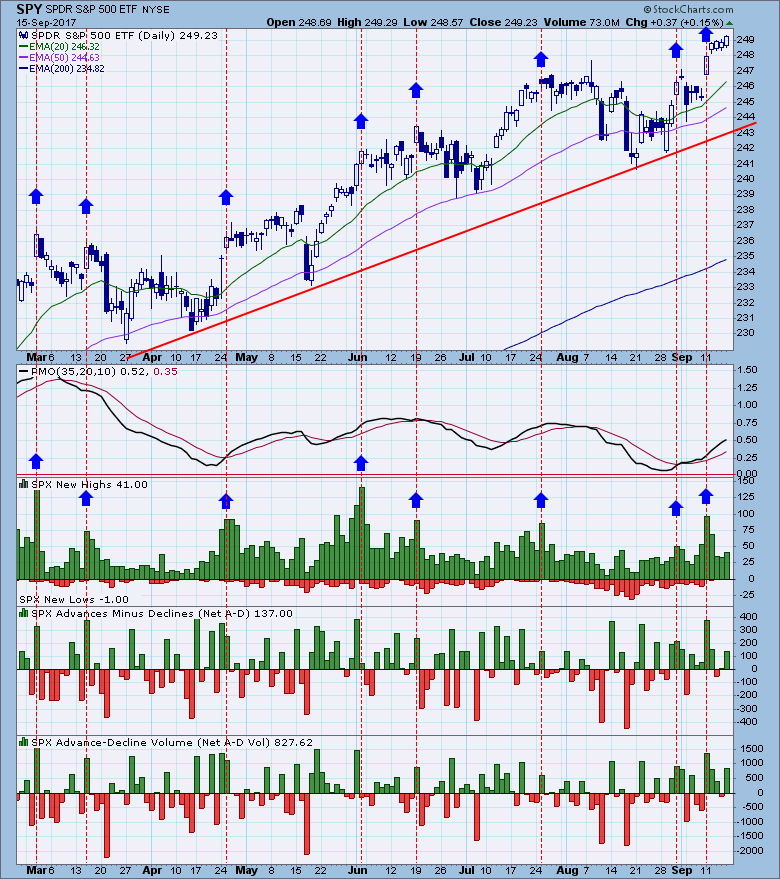
S&P 500 Tops 2500 For First Time; Monday Trade Setups
by Tom Bowley,
Chief Market Strategist, EarningsBeats.com
Market Recap for Friday, September 15, 2017
It was another day of records on Wall Street to close out the week. Despite the peak of seasonal summer weakness approaching, buyers stepped up to the plate once again, this time driving S&P 500 prices to another all-time high close...
READ MORE
MEMBERS ONLY
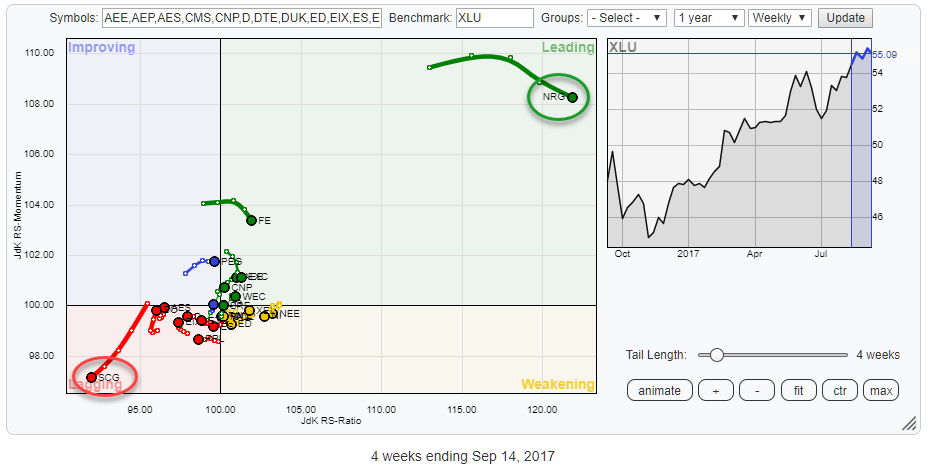
"Boring" Utilities moving up to main stage
by Julius de Kempenaer,
Senior Technical Analyst, StockCharts.com
Bringing up the Relative Rotation Graph that holds all members of the Utilities sector (XLU) gives the picture above. With NRG all the way up in the top-right corner of the leading quadrant and SCG in the lower left-hand corner of the lagging quadrant, the remaining stocks in the sector...
READ MORE
MEMBERS ONLY
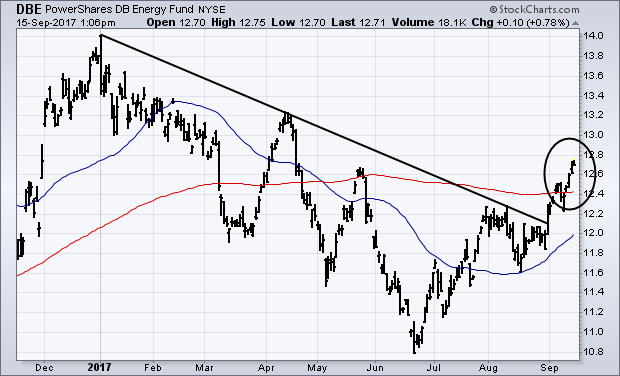
Rising Energy Prices Help Boost August CPI, British Pound Surges to Yearly High
by John Murphy,
Chief Technical Analyst, StockCharts.com
ENERGY ETF REACHES FIVE-MONTH HIGH ... It was reported Thursday that the headline CPI for August rose 0.4% from the previous month, which was its biggest monthly gain since January. That boosted its year-over-year comparison to 1.9%, which is just shy of the Fed's target of 2%...
READ MORE
MEMBERS ONLY
Finding Stocks Poised To Begin A Pre-Earnings Run Higher
by Tom Bowley,
Chief Market Strategist, EarningsBeats.com
If only it was that easy, right? The problem many times is that a company that reports great results one quarter fails to do so the next. But my strategy is to find companies that not only reported great results in the prior quarter, but also showed major accumulation at...
READ MORE
MEMBERS ONLY

What Does a Trend Line Really Tell Us?
by Arthur Hill,
Chief Technical Strategist, TrendInvestorPro.com
We all know what a trend line is, but does a trend line actually dictate the trend? In other words, does a trend line break actually signal a trend reversal? Or, is a trend line break telling us something else? We cannot use a tool unless we fully understand it...
READ MORE
MEMBERS ONLY
Who Do You Trust More? Active Money Managers or Individual Investors?
by Erin Swenlin,
Vice President, DecisionPoint.com
This week sentiment was mixed. Typically we see the American Association of Individual Investors (AAII) and National Association of Active Investment Managers (NAAIM) exposure index give the same message. However when I pulled up the charts to present during the sentiment segment of MarketWatchers LIVE, I saw the dissonance.
The...
READ MORE
MEMBERS ONLY
A Picture tells a Thousand Words

by John Hopkins,
President and Co-founder, EarningsBeats.com
One of the benefits of technical analysis is being able to look at a chart to help determine if a stock is a viable trading candidate. In other words, what does a technician see in a chart that would lead to the conclusion that a specific stock is or isn&...
READ MORE
MEMBERS ONLY
DP Weekly Wrap: Climax and Options Expiration Slow Advance
by Carl Swenlin,
President and Founder, DecisionPoint.com
For a few weeks I have been expecting an upside breakout, and on Monday the breakout finally happened. The internal action on that day indicated that a buying climax had taken place, an event that very often leads to some post-climax churning or pullback. Also, this was an options expiration...
READ MORE
MEMBERS ONLY

Investor Seminar Season: Can The Speakers Walk the Talk?
by Gatis Roze,
Author, "Tensile Trading"
I attend investment seminars as half-monk, half-hit man. My time is a precious commodity, so if you are a speaker and see me in the audience, be prepared. My hot button is when speakers show a few elaborate slides, “share” their four favorite tenets to successful investing and then launch...
READ MORE
MEMBERS ONLY

RISING ENERGY PRICES HELP BOOST AUGUST CPI -- ENERGY ETF REACHES HIGHEST LEVEL IN FIVE MONTHS -- THAT'S HELPING BOOST BOND YIELDS -- SO ARE RISING YIELDS IN THE UK -- THE POUNG SURGES TO HIGHEST LEVEL IN A YEAR
by John Murphy,
Chief Technical Analyst, StockCharts.com
ENERGY ETF REACHES FIVE-MONTH HIGH ... It was reported yesterday that the headline CPI for August rose 0.4% from the previous month, which was its biggest monthly gain since January. That boosted its year-over-year comparison to 1.9%, which is just shy of the Fed's target of 2%...
READ MORE