MEMBERS ONLY
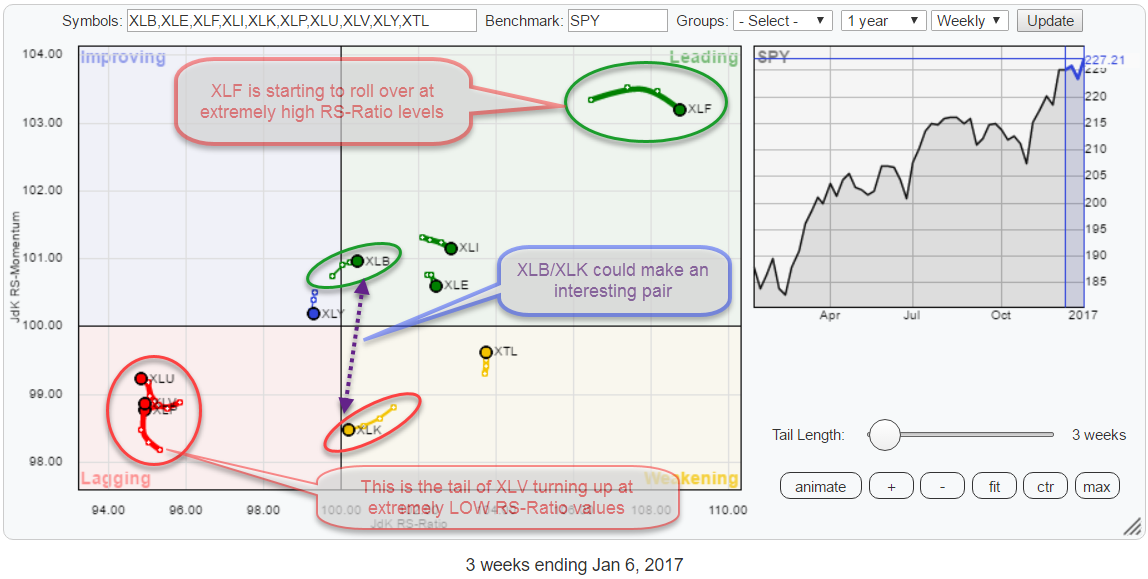
Rotation from Financials into Health care? Two sectors at extremes.

by Julius de Kempenaer,
Senior Technical Analyst, StockCharts.com
The Relative Rotation Graph below holds the sector ETFs that make up the S&P 500 universe and uses the S&P 500 index ETF (SPY) as its benchmark in the center of the graph.
Four rotational patterns, two pairs, capture my attention when I look at this...
READ MORE
MEMBERS ONLY
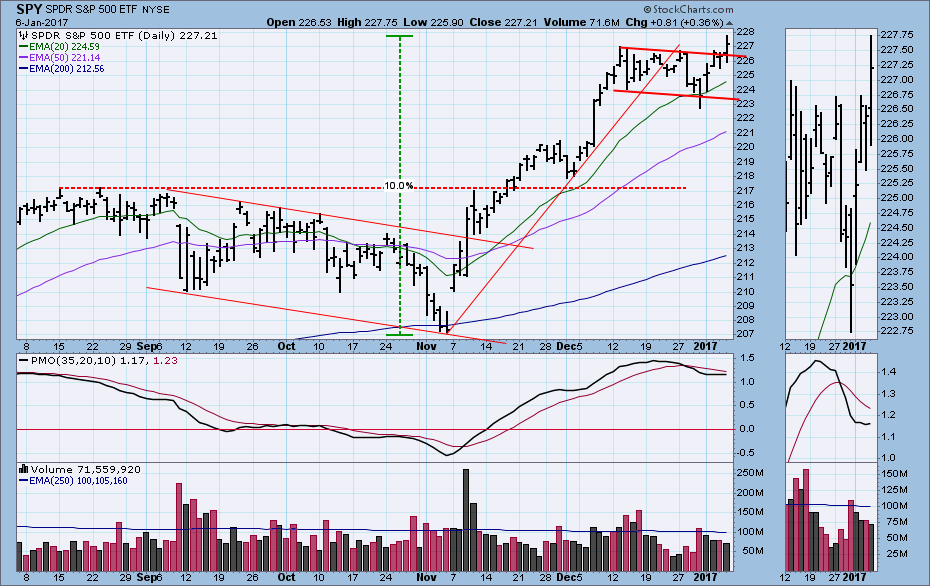
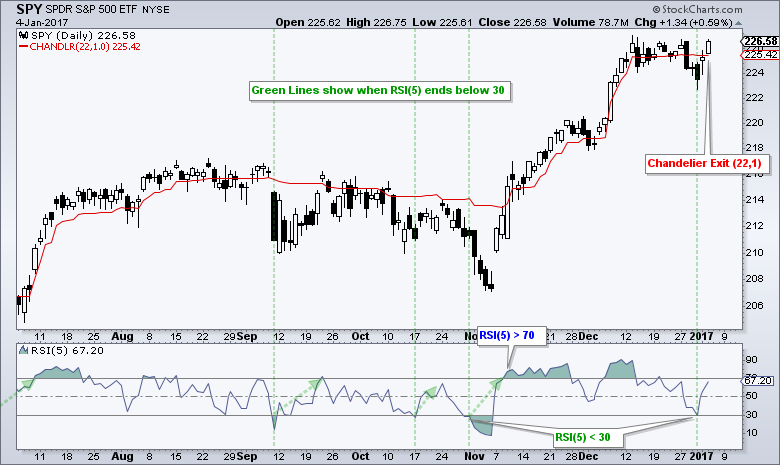
Does New Rally Have Good Technicals?

by Carl Swenlin,
President and Founder, DecisionPoint.com
Two weeks ago I was looking for a price top. Strictly speaking, we got one, but the decline was short-lived (three days), and the low was the last low in a four-week flag formation. The new rally off that low was strong enough to fuel a breakout to new, all-time...
READ MORE
MEMBERS ONLY

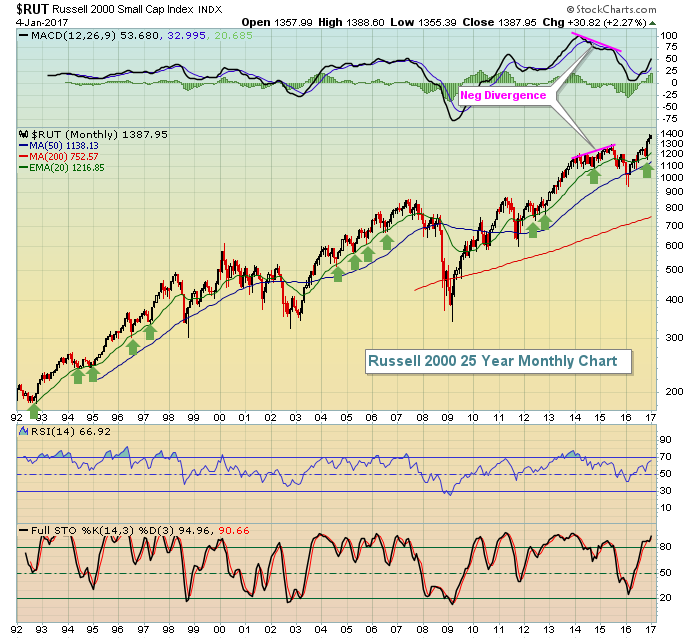
Did 2016 Meet Your Expectations?

by Greg Morris,
Veteran Technical Analyst, Investor, and Author
Welcome to 2017! For those of use born in the 1940s or earlier, we’re delighted to be here. In the US Equity markets, there were 3 fairly big pullbacks. They stand out in the performance chart of the S&P 500, Dow Industrials, Nasdaq Composite, Russell 2000. Looking...
READ MORE
MEMBERS ONLY
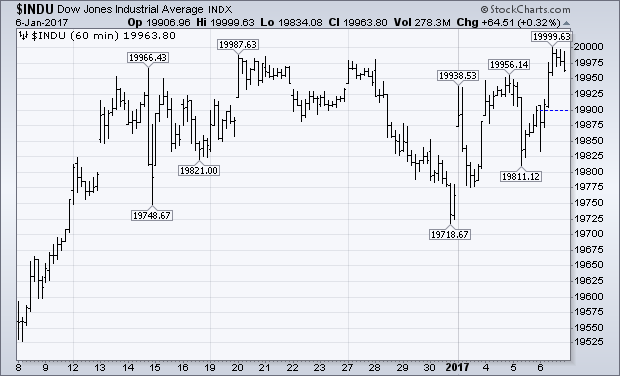
Dow Flirts With 20K, While NASDAQ Closes At Record High

by John Murphy,
Chief Technical Analyst, StockCharts.com
Let's get this out of the way first. If you've been watching business TV, all they've been talking about is the Dow nearing the 20,000 level. Much to their dismay, it came close on Friday but couldn't make it. The Dow...
READ MORE
MEMBERS ONLY
Guess What? "Official" Earnings Season is About to Begin

by John Hopkins,
President and Co-founder, EarningsBeats.com
No one can argue with the fact that the market has been fascinating to watch since the election with all of the major indexes substantially higher since the most recent bottom on November 4. There's been a few minor pullbacks along the way, but not many as traders...
READ MORE
MEMBERS ONLY

Going for the Gold

by Bruce Fraser,
Industry-leading "Wyckoffian"
Group rotation has recently brought to life moribund sectors such as the financials, materials, and industrials. Gold was largely forgotten in the aftermath of the election. At times, it is in lockstep with the broad stock market, and at other times it is marching to its own drummer. After a...
READ MORE
MEMBERS ONLY
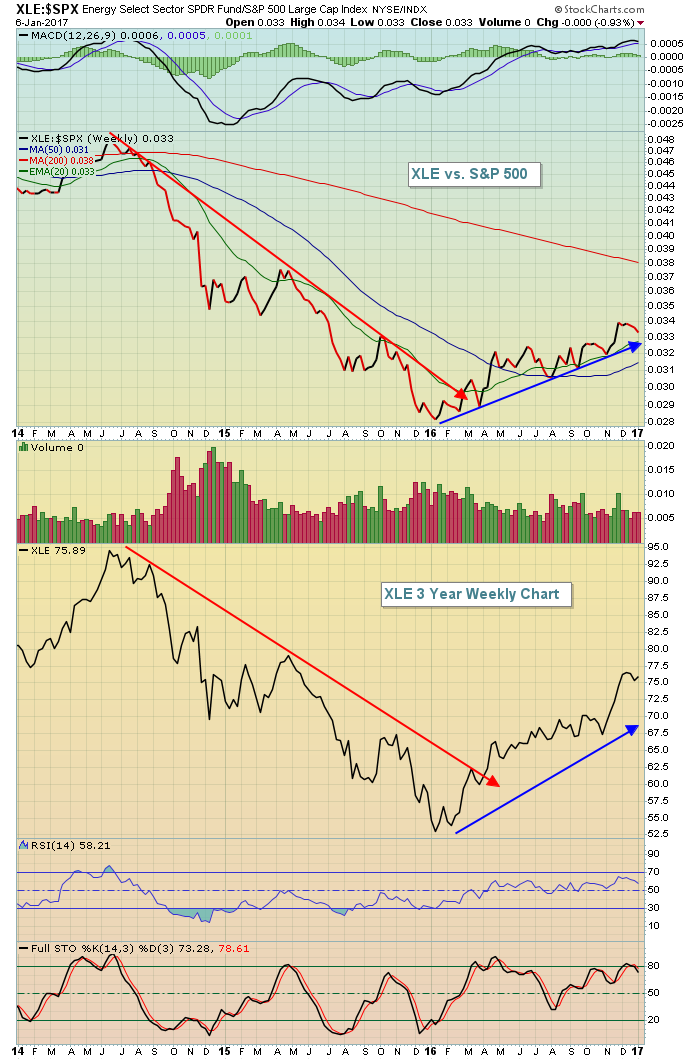
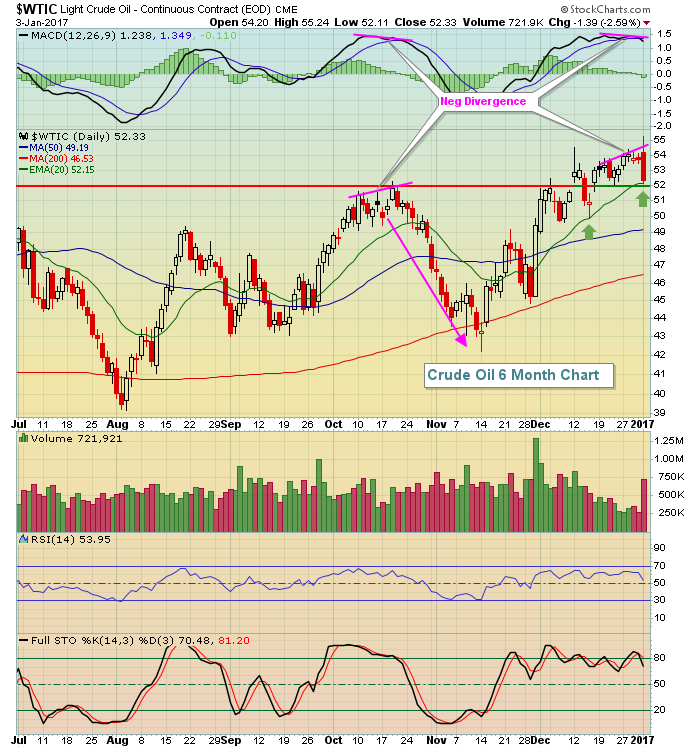
Energy Continues To Lead And Prospects Here Remain Bright

by Tom Bowley,
Chief Market Strategist, EarningsBeats.com
I've been writing relentlessly about the relative strength in energy shares (XLE) over the past several months and here I go again. Go ahead and talk about too much supply. Hang onto the weakening demand argument if you'd like. I'm simply following the charts...
READ MORE
MEMBERS ONLY
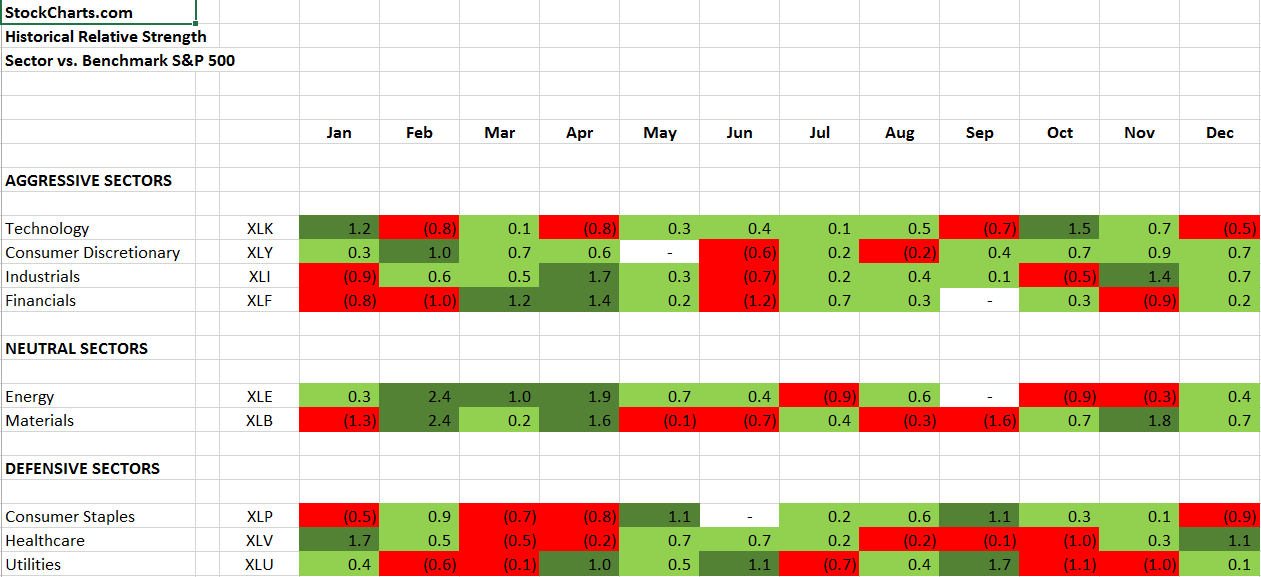
Summary Of Sector Relative Strength By Calendar Month
by Tom Bowley,
Chief Market Strategist, EarningsBeats.com
Normally, I provide a daily blog article every day that the U.S. stock market is open. That eliminates Saturdays and Sundays. I'm making an exception today to share some historical information that I believe you'll find useful as you work your way through 2017. Also,...
READ MORE
MEMBERS ONLY

DOW CONTINUES TO FLIRT WITH 20K -- WHILE NASDAY CLOSES AT RECORD HIGH -- INTERNET INDEX TURNS UP WITH FANG STOCKS BACK IN FAVOR -- FACEBOOK, AMAZON, AND GOOGLE IMPROVE -- NETFLIX HITS NEW RECORD -- BIOTECHS HELP MAKE HEALTHCARE WEEK'S STRONGEST SECTOR
by John Murphy,
Chief Technical Analyst, StockCharts.com
DOW FLIRTS WITH 20K... Let's get this out of the way first. If you've been watching business TV, all they've been talking about is the Dow nearing the 20,000 level. Much to their dismay, it came close on Friday but couldn't...
READ MORE
MEMBERS ONLY
SystemTrader - Testing the January Barometer - 50 Years of Gravy - 17 Years of Famine

by Arthur Hill,
Chief Technical Strategist, TrendInvestorPro.com
SystemTrader .... Testing the January Barometer .... Long-term Bullish Bias for Stocks is Clear .... Setting Up the Backtest .... 1950 to 2016 - The Big Test .... 1950 to 1999 - The Gravy Train .... 2000 to 2016 - The Lean Years .... Conclusions.... .... //// ........
Testing the January Barometer
Greg Morris' yearend blog post (New Year...
READ MORE
MEMBERS ONLY
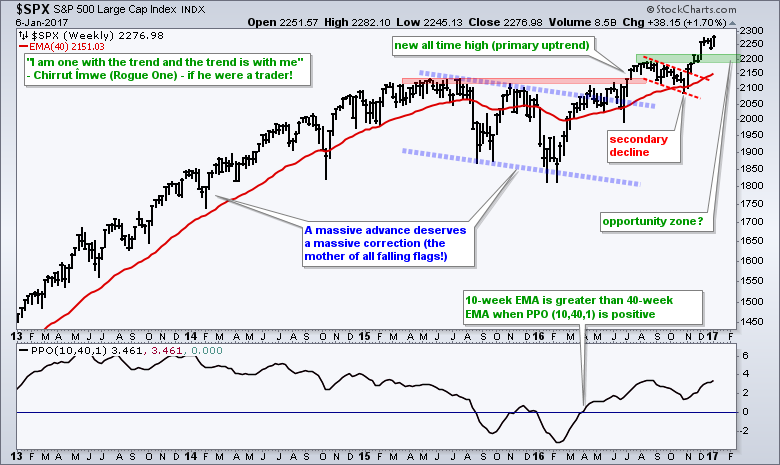
I am One with the Trend and the Trend is with Me
by Arthur Hill,
Chief Technical Strategist, TrendInvestorPro.com
I recently saw the new Star Wars movie, Rogue One, and found a way to tie technical analysis to one of the more interesting characters. This happens all of the time because technical analysis is so ingrained in my membrane. Chirrut Îmwe is a blind warrior monk who repeated: "...
READ MORE
MEMBERS ONLY
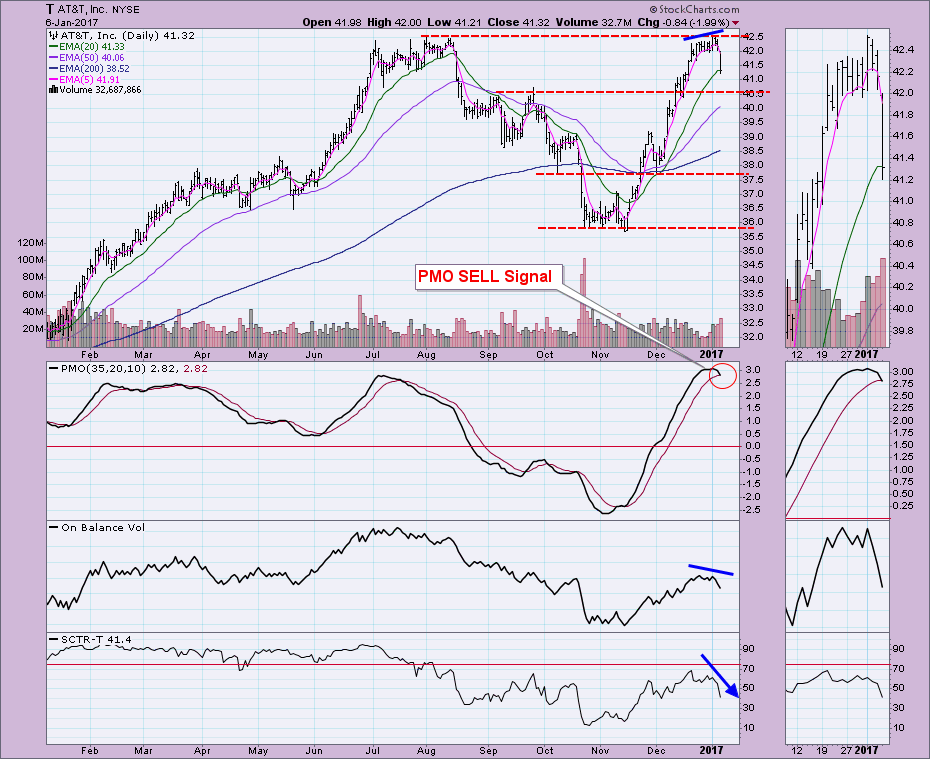
AT&T Takes a Nose Dive

by Erin Swenlin,
Vice President, DecisionPoint.com
A regular DecisionPoint webinar viewer and reader emailed me and suggested I take a look at AT&T because as he stated, "ouch". It was definitely a rough day for AT&T and what happened today has some very interesting implications.
Price dropped almost 2% today....
READ MORE
MEMBERS ONLY

Charts I'm Stalking: Action Practice #9

by Gatis Roze,
Author, "Tensile Trading"
The Seasonality Action Practice blog from December 16, 2016 is about the two most impactful decisions you can make as an investor. Academics have produced stacks of papers confirming that your asset allocation decisions have immense consequences that flow directly to your bottom line. I maintain it’s the second...
READ MORE
MEMBERS ONLY
Financials Take Beating Amid Falling Treasury Yields
by Tom Bowley,
Chief Market Strategist, EarningsBeats.com
Market Recap for Thursday, January 5, 2017
The 10 year treasury yield ($TNX) tumbled on Thursday, dropping more than 8 basis points to close at 2.37% - its lowest daily close since December 7th's 2.35% finish. The sudden interest in treasuries could have been the result...
READ MORE
MEMBERS ONLY
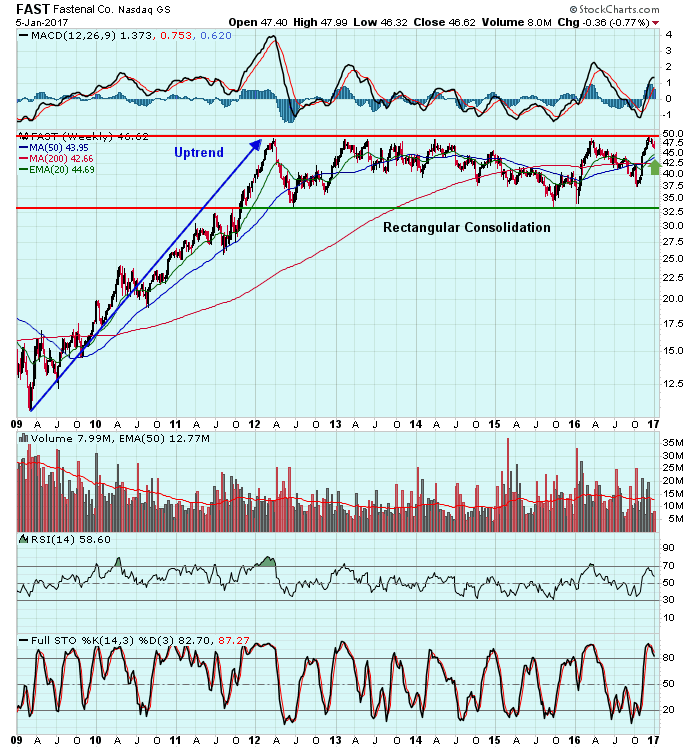
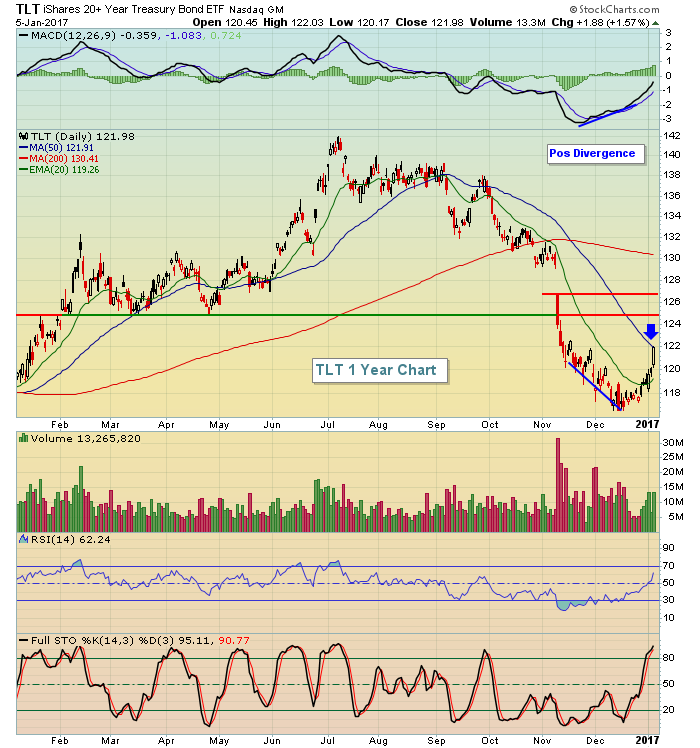
This S&P 500 Company Is On Verge Of Major Breakout
by Tom Bowley,
Chief Market Strategist, EarningsBeats.com
Since the beginning of 2012, Fastenal Co. (FAST) has tested its 48-49 price resistance zone on seven different occasions - most recently four weeks ago - without any success. But this multi-year consolidation follows a prior uptrend so I expect that we'll see a breakout sooner rather than...
READ MORE
MEMBERS ONLY

Are Post Election Market Trends Starting To Reverse In 2017?

by Martin Pring,
President, Pring Research
* The long-term equity trend is bullish, but watch carefully
* Short-term technicals for equities
* Short-term technicals for yields and bond prices
* Short-term technicals for the Dollar Index, Gold and Commodities
The post-election trends I am referring to in the title refer but are not limited to, the five series plotted in...
READ MORE
MEMBERS ONLY
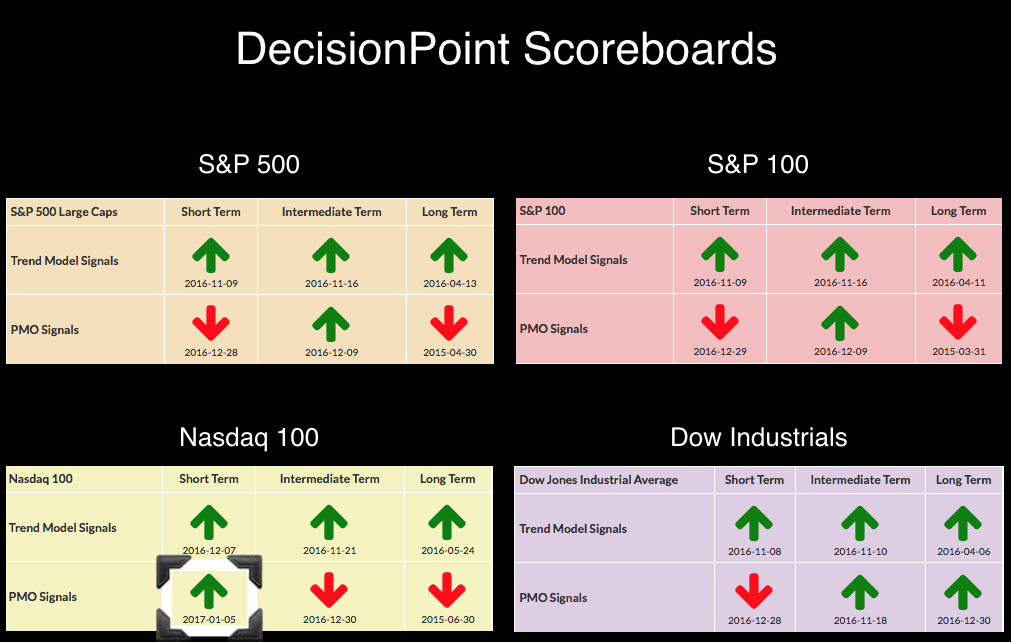
Nasdaq 100 PMO Decouples from Major Indexes
by Erin Swenlin,
Vice President, DecisionPoint.com
Today, the Nasdaq 100 rallied while the other indexes experienced declines. You'll note in the DecisionPoint Scoreboard Summary below that all of the major indexes are on short-term Price Momentum Oscillator (PMO) SELL signals that arrived in December. Meanwhile, the NDX received a new PMO BUY signal.
Here...
READ MORE
MEMBERS ONLY

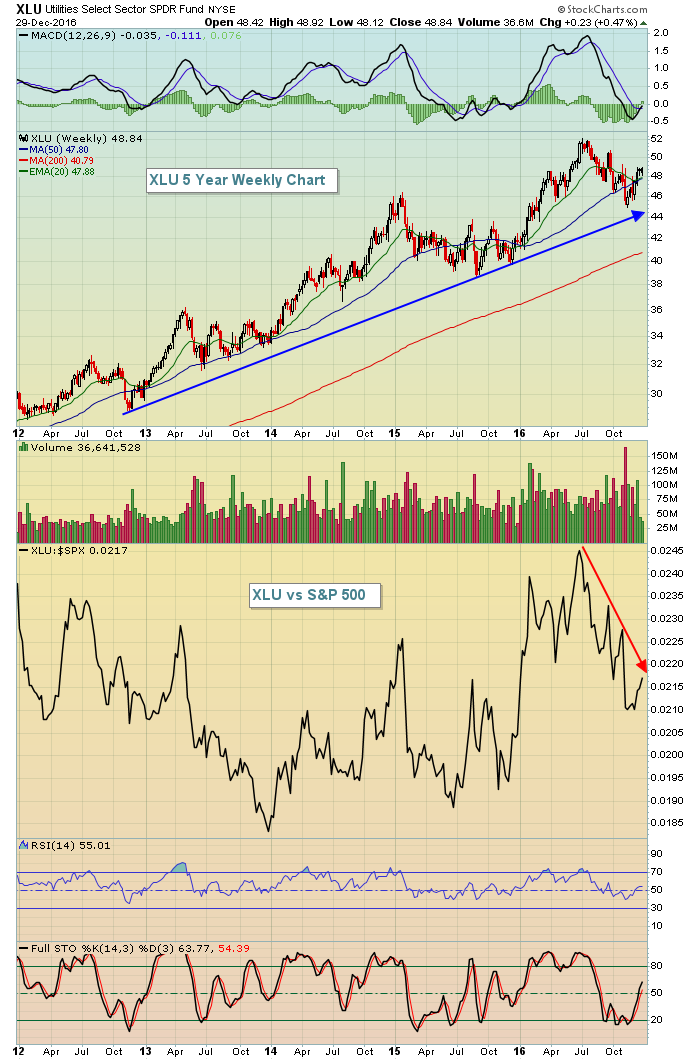
OVER-EXTENDED TREASURY YIELDS PULL BACK -- DO DOES THE DOLLAR -- THAT'S BOOSTING GOLD AND GOLD MINERS -- WEAKER DOLLAR AND STRONG YUAN ALSO BOOST EMERGING MARKETS -- UPTREND IN FINANCIALS IS STALLING -- WHILE UTILITIES STRENGTHEN
by John Murphy,
Chief Technical Analyst, StockCharts.com
10-YEAR TREASURY YIELD PULLS BACK ... After the steep ascent in Treasury bond yields since the November 8 election, it's not too surprising to them pulling back a bit. There are a couple of technical reasons for that. The daily bars in Chart 1 show the 10-Year Treasury Yield...
READ MORE
MEMBERS ONLY
Video - SPY through the Mean-Reversion Lens and the Trend-Breakout Lens - IJR Leads - ChartList Update (30 stocks)
by Arthur Hill,
Chief Technical Strategist, TrendInvestorPro.com
SPY through the Mean-Reversion Lens .... SPY through the Trend-Breakout Lens .... Small-caps Continue to Lead (IJR and QQQ) .... Five Sector SPDRs Get Oversold Bounces .... Chartlist Update (30 Stocks including the Fab 5) .... //// .... Commentary Video ----- Art's Charts ChartList (updated 5-Jan) -----
SPY through the Mean-Reversion Lens
There is a...
READ MORE
MEMBERS ONLY
Autos Gain Traction, Break Out To Lead Equities Higher
by Tom Bowley,
Chief Market Strategist, EarningsBeats.com
Market Recap for Wednesday, January 4, 2017
Materials (XLB, +1.46%) and consumer discretionary (XLY, +1.33%) were easily the two best performing sectors on Wednesday to lead our major indices to a second consecutive day of across-the-board gains in 2017. There is a very strong correlation between January performance...
READ MORE
MEMBERS ONLY
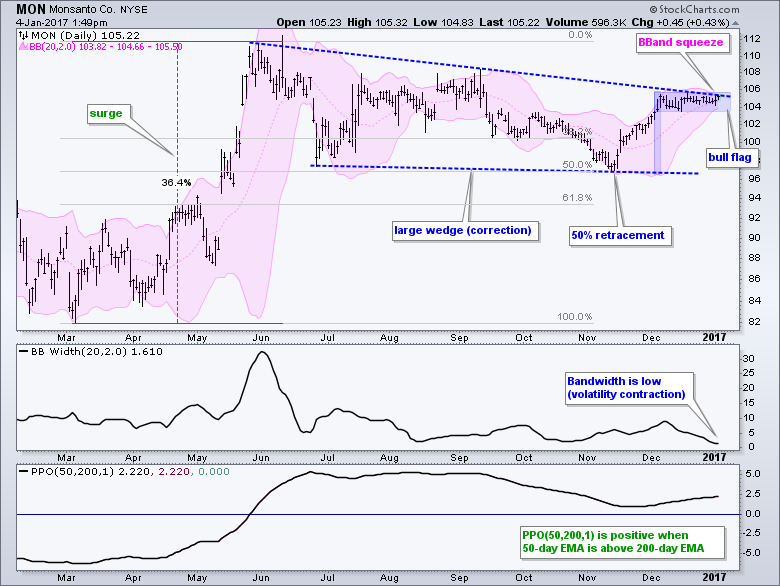
Squeeze Play Hits Monsanto at Key Juncture
by Arthur Hill,
Chief Technical Strategist, TrendInvestorPro.com
Monsanto (MON) is in the midst of a tight consolidation and the resolution of this consolidation could trigger a big breakout. Let's first start with the bigger picture. MON surged 36.4% from March to June and then corrected with a large wedge. The low of this wedge...
READ MORE
MEMBERS ONLY

AUTOS LEAD CYCLICALS HIGHER -- AUTO LEADERS ARE GM, FORD, AND TESLA -- GENERAL MOTORS NEARS NEW RECORD -- CARMAX COMPLETES MAJOR BASING PATTERN -- TENNECO AUTOMOTIVE LEADS AUTO PARTS STOCKS HIGHER AFTER REACHING TWO-YEAR HIGH
by John Murphy,
Chief Technical Analyst, StockCharts.com
DOW JONES AUTO INDEX IS BREAKING OUT... For the first time in a long time, auto stocks are showing market leadership. I first wrote about the group in a December 1 message about autos leading consumer cyclicals higher. They're doing that again today. Chart 1 shows the Dow...
READ MORE
MEMBERS ONLY
Biotechs Lead Stocks To Open 2017
by Tom Bowley,
Chief Market Strategist, EarningsBeats.com
Market Recap for Tuesday, January 3, 2017
Healthcare (XLV, +1.31%) took over sector leadership on Tuesday to open 2017 as the Dow Jones U.S. Biotechnology Index ($DJUSBT) jumped 2.05%. It's not too surprising to historians as January tends to be very kind to both the...
READ MORE
MEMBERS ONLY

Webinar Video - Tides, Waves and Ripples - Checking the Primary Trends for Stocks, Bonds, Oil, Gold and the Dollar
by Arthur Hill,
Chief Technical Strategist, TrendInvestorPro.com
----- Webinar Video ----- Art's Charts ChartList -----
Tides, Waves, Ripples and Charles Dow .... Primary and Secondary Trend for SPY .... Using 5-day RSI for the Minor Trend .... QQQ Becomes Oversold as IJR Stalls .... Bonds are Not the Place to Be Right Now .... Oil Extends Slow Uptrend .... Primary Downtrend...
READ MORE
MEMBERS ONLY
U.S. Futures Strong, Crude Oil On The Move
by Tom Bowley,
Chief Market Strategist, EarningsBeats.com
Note
First, I want to wish everyone a very happy new year! Second, I'm excited to announce that Greg Schnell (think Canadian Technician and Commodities Countdown) and I will be co-hosting a Stock Market 2017 Outlook webinar in mid-January where we'll compare notes and share our...
READ MORE
MEMBERS ONLY

New Year Nonsense
by Greg Morris,
Veteran Technical Analyst, Investor, and Author
Each year for as long as I can remember pundits, experts, and talking heads are offering their projections (guesses) about the new year and what to expect from the market. There are a few ‘techniques’ that seem to be used each year such as the January Barometer, the Super Bowl...
READ MORE
MEMBERS ONLY
2016 Q3 Earnings: Market Overvalued but Earnings Trend Favorable
by Carl Swenlin,
President and Founder, DecisionPoint.com
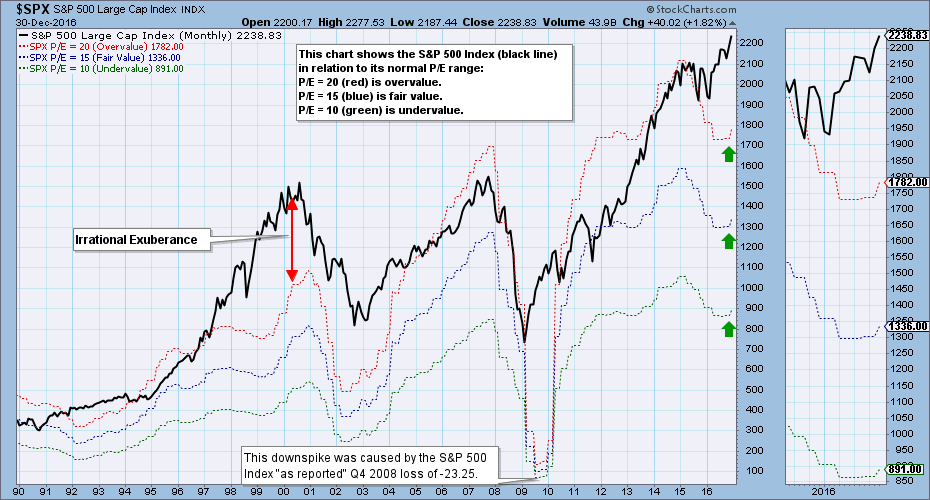
Last week S&P 500 preliminary earnings results for 2016 Q3 were in, and the market is still grossly overvalued. On the plus side, however, earnings turned up and are projected to move higher over the next year.
The chart above shows the S&P 500 Index (black...
READ MORE
MEMBERS ONLY
QCOM's Rough Week Could Provide Opportunity
by Tom Bowley,
Chief Market Strategist, EarningsBeats.com
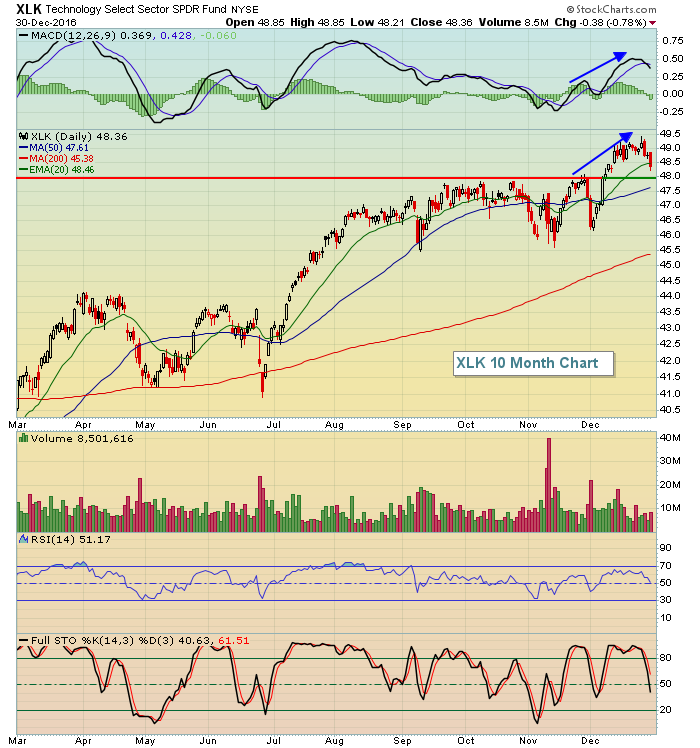
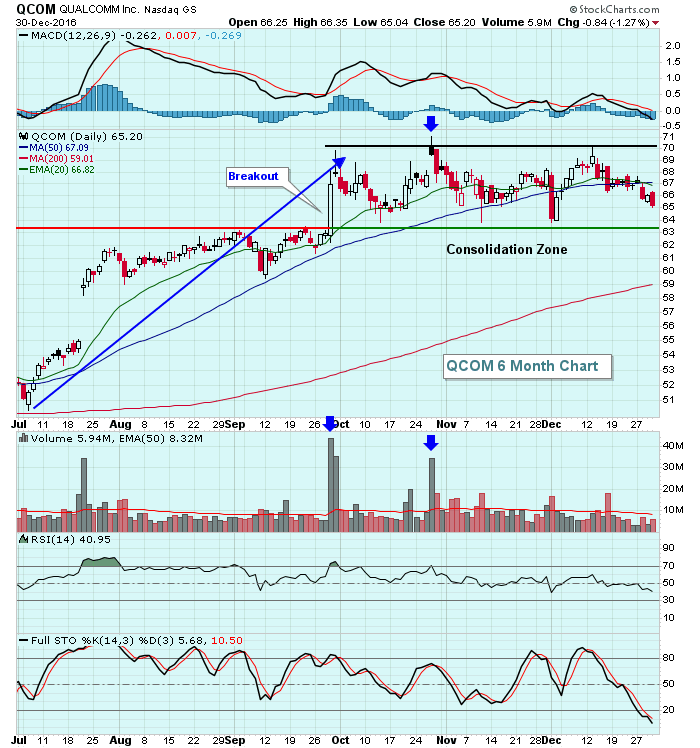
Technology stocks (XLK) have shown signs of slowing momentum via lower weekly MACD readings while prices have moved higher. Component industry groups like semiconductors ($DJUSSC) and software ($DJUSSW) have similar momentum issues and that contributed to industry weakness as technology was one of the worst performing sectors last week. One...
READ MORE
MEMBERS ONLY

New Year's Resolutions for Investors
by Gatis Roze,
Author, "Tensile Trading"
Babylonians did it. Ancient Romans did it. Medieval knights pledged the “peacock vow” each New Year as their promise of chivalry. Reflecting upon the previous year’s efforts and seeking ways for self-improvement in the coming year has been a common ritual for millenniums because our human nature drives us...
READ MORE
MEMBERS ONLY
Tech stocks losing IT
by Julius de Kempenaer,
Senior Technical Analyst, StockCharts.com
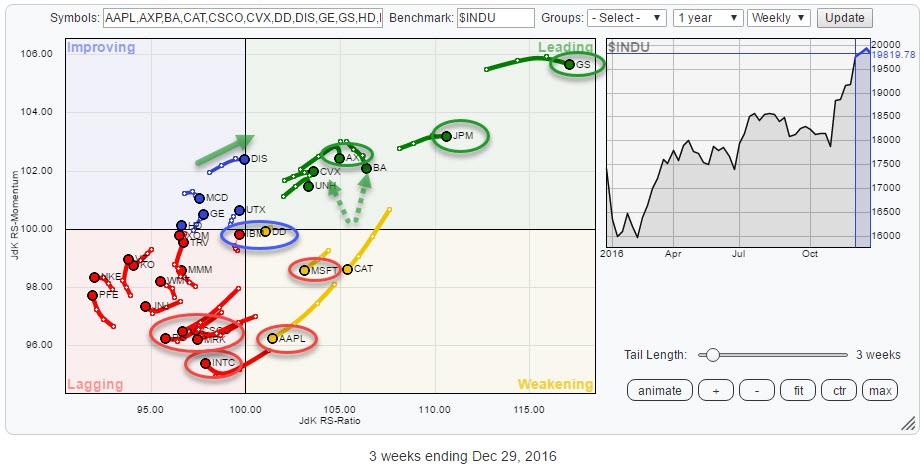
From July to November of this year Tech stocks have dominated the performance of the Dow Jones Industrials Index ($INDU) but then came November!
The Relative Rotation Graph of all DJ Industrials stocks below shows the rotational pattern of all $INDU members with a three-week tail.
The recent weakness for...
READ MORE
MEMBERS ONLY
Banks Test 20 Day Along With TNX
by Tom Bowley,
Chief Market Strategist, EarningsBeats.com
Market Recap for Thursday, December 29, 2016
The 10 year treasury yield ($TNX) closed at 2.48% and hit an intraday low of 2.46% to test its rising 20 day EMA for the first time since early November. Not too surprisingly, the Dow Jones U.S. Banks Index ($DJUSBK)...
READ MORE
MEMBERS ONLY

Commodities ETF (GSG) Posts New Long-Term Trend Model BUY Signal
by Erin Swenlin,
Vice President, DecisionPoint.com
The iShares Commodity ETF (GSG) had a momentous BUY signal. Today, the 50-EMA crossed above the 200-EMA, reaching territory unseen since 2014. This crossover triggers a Long-Term Trend Model BUY signal that suggests GSG has entered a new bull market. A review of the charts reveals this new signal has...
READ MORE
MEMBERS ONLY
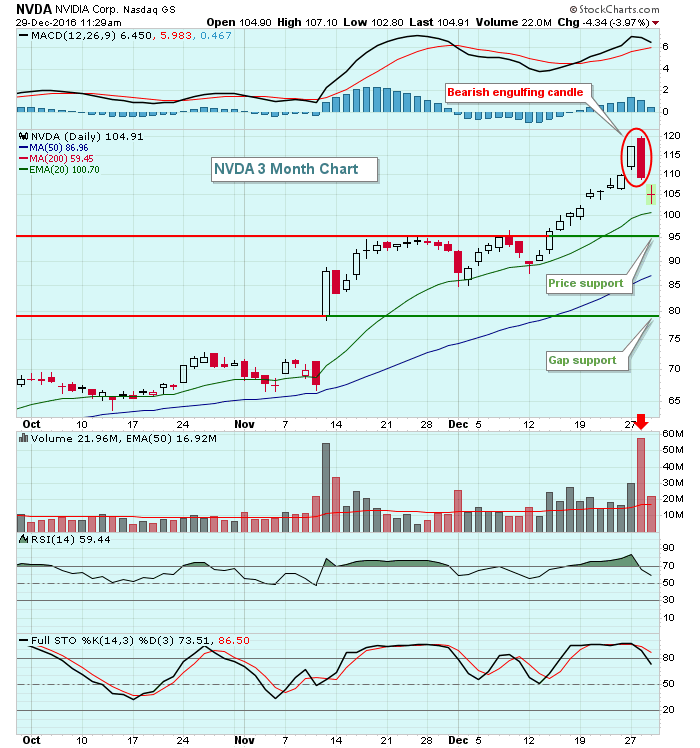
NVDA's Magic Ride Likely Over
by Tom Bowley,
Chief Market Strategist, EarningsBeats.com
NVIDIA Corp (NVDA) has been one of the best performers of 2016, nearly quadrupling during the year. Its long-term chart has been phenomenal, but its weekly RSI and stochastic have been overbought since early May. That's a very long time of outperformance and a rest is not only...
READ MORE
MEMBERS ONLY
Broad-Based Selling Finally Hits U.S. Stocks
by Tom Bowley,
Chief Market Strategist, EarningsBeats.com
Market Recap for Wednesday, December 28, 2016
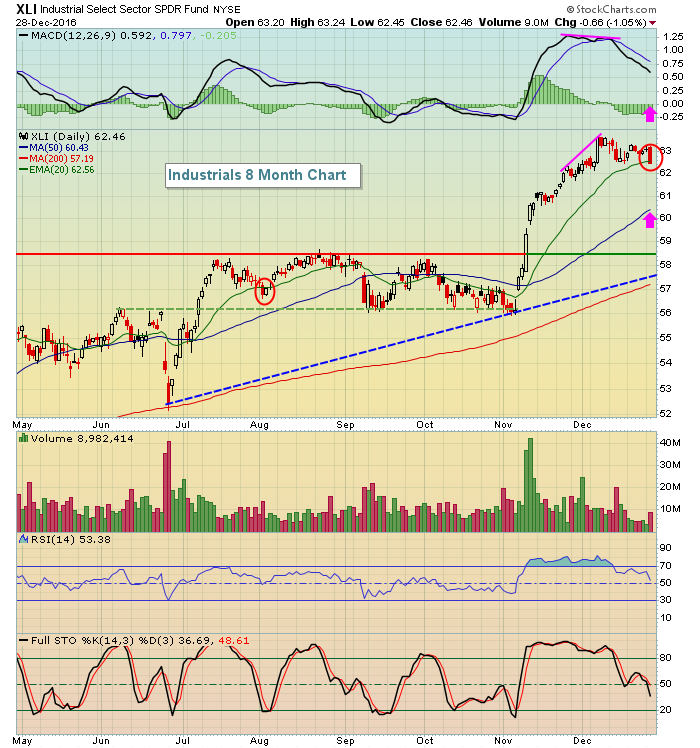
It's been awhile since this happened, but on Wednesday all nine sectors declined, led by energy (XLE, -1.08%), industrials (XLI, -1.05%) and financials (XLF, -1.02%). The carnage was evenly spread as consumer staples (XLP, -0.61%) and consumer...
READ MORE
MEMBERS ONLY
Three Charts That Suggest Dow 20,000 Will Happen Later Rather Than Sooner
by Martin Pring,
President, Pring Research
* Signs of short-term exhaustion
* Watch those housing ETF’s
* Shanghai is down, but is it out?
Even bull markets need to pause for breath as profits are digested and doubts sown concerning the validity of the prevailing trend. We may have come to such a moment.
Signs of short-term exhaustion...
READ MORE
MEMBERS ONLY
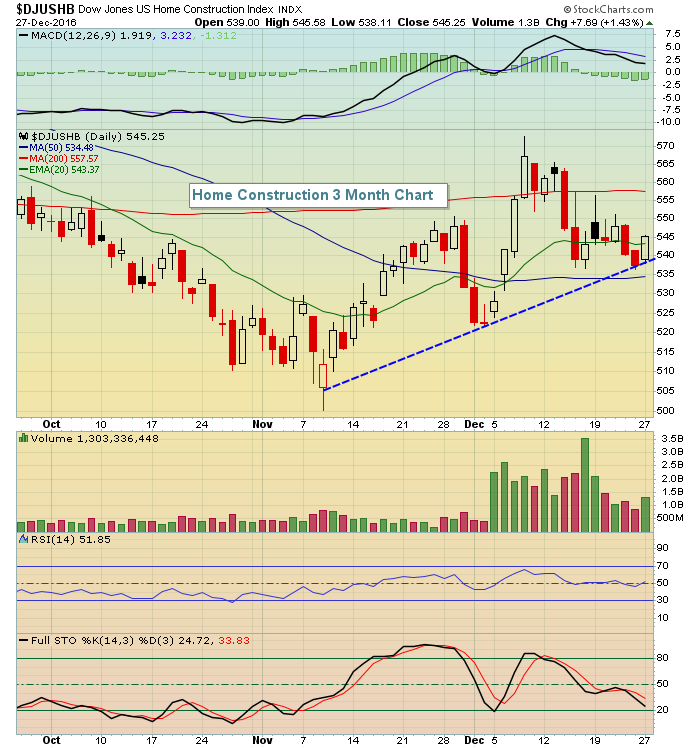
Oil Closes Near $54 Per Barrel; Home Construction Rises
by Tom Bowley,
Chief Market Strategist, EarningsBeats.com
Market Recap for Tuesday, December 27, 2016
Eight of the nine sectors rose on Tuesday with only consumer staples (XLP, -0.02%) losing ground. The NASDAQ and Russell 2000 once again were the leading indices, powered by home construction ($DJUSHB) and renewable energy ($DWCREE). Home construction looks very interesting on...
READ MORE
MEMBERS ONLY
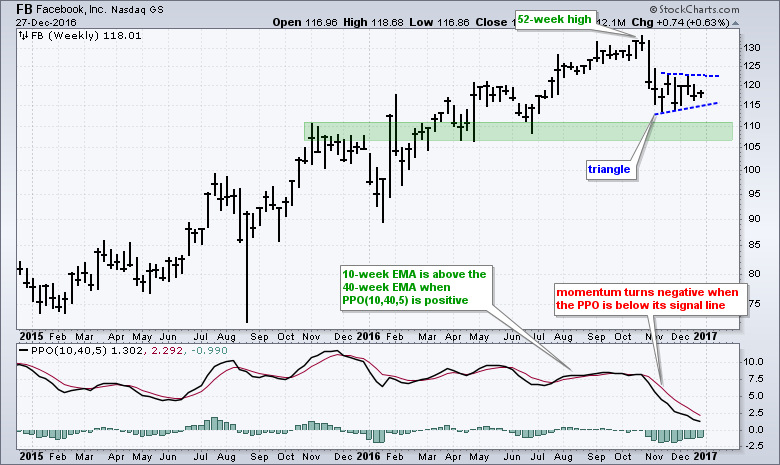
Facebook Continues to Stall - Here's What to Watch $FB
by Arthur Hill,
Chief Technical Strategist, TrendInvestorPro.com
The Nasdaq 100 ETF and S&P 500 SPDR hit new highs in mid December, but Facebook (FB) did not partake in these new highs and remains stuck in a consolidation. Even though relative weakness since late October is negative, the stock remains in a long-term uptrend and we...
READ MORE
MEMBERS ONLY

Holiday Chartfest
by Bruce Fraser,
Industry-leading "Wyckoffian"
The Holiday Season is a joyful time of year. Wyckoffians appreciate the year-end and anticipate the year to come. This period of reflection and planning is best enjoyed by studying lots of charts. Here we offer a few charts to enhance your year-end fun. May you find lots of additional...
READ MORE
MEMBERS ONLY
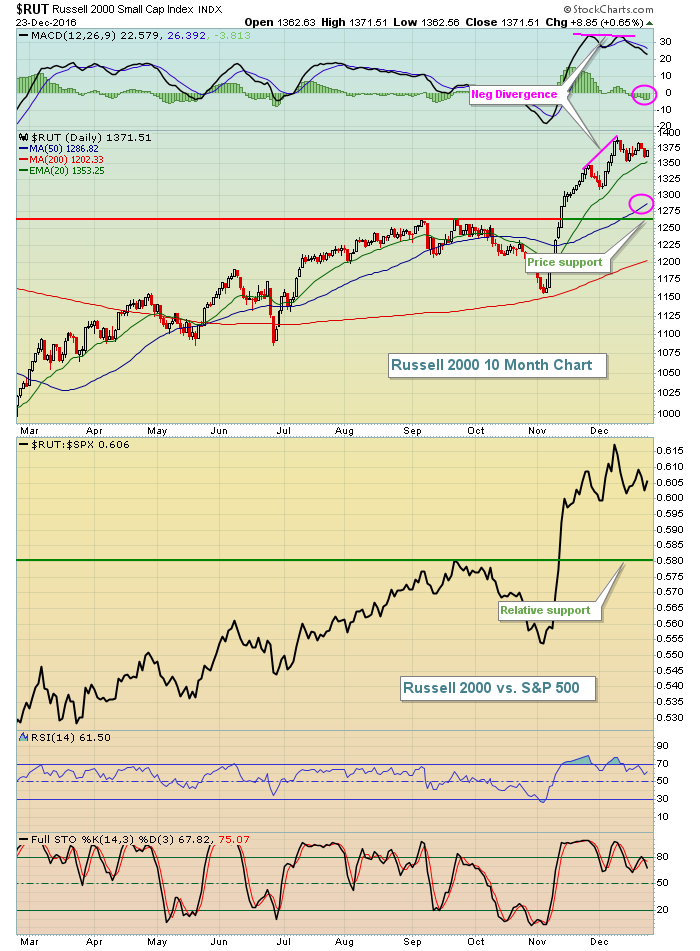
Small Caps Lead Friday; Biotechs Ready To Resume Uptrend?
by Tom Bowley,
Chief Market Strategist, EarningsBeats.com
Market Recap for Friday, December 23, 2016
The Russell 2000 gained 0.65% on Friday to lead the major U.S. indices. The NASDAQ followed with a 0.28% gain while the S&P 500 and Dow Jones pushed higher, but only by 0.13% and 0.07%, respectively....
READ MORE
MEMBERS ONLY
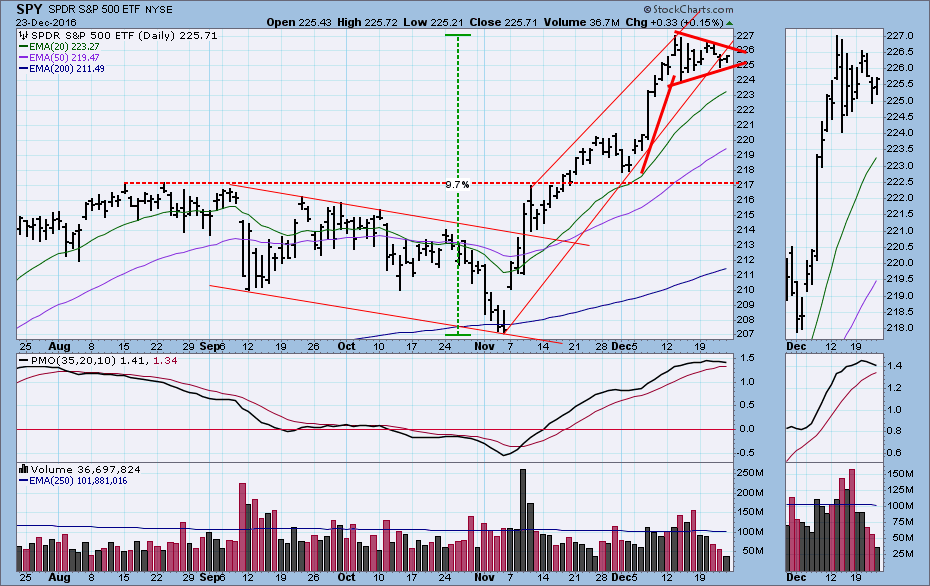
On Alert for a Top
by Carl Swenlin,
President and Founder, DecisionPoint.com
In the last few weeks the market has moved into a bullish pennant formation. In doing so it also violated the rising trend line on Thursday, but the trend line penetration has sideways, rather than sharply down, so I think the pennant carries more weight. Nevertheless, medium-term indicators are sufficiently...
READ MORE