MEMBERS ONLY
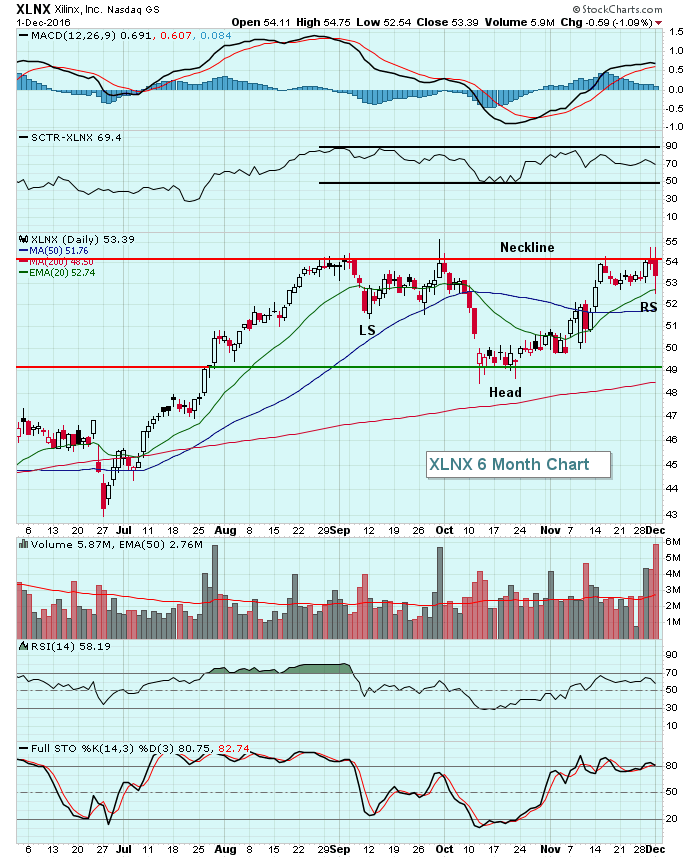
Waiting On This Inverse Head & Shoulder Breakout

by Tom Bowley,
Chief Market Strategist, EarningsBeats.com
Xilinx (XLNX) is a $13.5 billion semiconductor company and it nearly broke out of a very bullish inverse head & shoulders pattern on heavy volume today. But it didn't. Instead, it reversed lower along with most semiconductor stocks and tested its rising 20 day EMA. The technical...
READ MORE
MEMBERS ONLY

AUTOS DRIVE CYCLICALS HIGHER -- GENERAL MOTORS HAS THE STRONGER PATTERN -- BUT FORD TURNS UP -- INDUSTRIAL LEADERS INCLUDE FLOWSERVE, DOVER, AND WW GRAINGER -- MONEY CONTINUES TO ROTATE OUT OF TECHNOLOGY INTO CHEAPER VALUE STOCKS

by John Murphy,
Chief Technical Analyst, StockCharts.com
CONSUMER DISCRETIONARY SPDR SHOWS RELATIVE STRENGTH ... One of the signs of growing strength behind the post-election stock market rally is that it's being led higher by economically-sensitive stocks like cyclicals and industrials. [We'll deal with industrials shortly]. Chart 1 shows the Consumer Discretionary SPDR (XLY) finding...
READ MORE
MEMBERS ONLY
Crude Oil Surges 9%, Lifts Energy Stocks
by Tom Bowley,
Chief Market Strategist, EarningsBeats.com
Market Recap for Wednesday, November 30, 2016
Crude oil ($WTIC) rose more than 9% on Wednesday and energy shares (XLE, +5.08%) were the beneficiary. Rising treasury yields also helped to lift the financial sector (XLF, +1.35%) with banks ($DJUSBK) storming to another high. But the bifurcation was quite...
READ MORE
MEMBERS ONLY
SPY is Last One Standing - XLF Defines Overbought Readings - Adjusting RSI for Trend Identification

by Arthur Hill,
Chief Technical Strategist, TrendInvestorPro.com
SPY is the Last One Standing .... XLF Defies Overbought Readings .... Materials Follows thru on Pennant Breakout .... Bigger Uptrend Overpowers Short-term Dip in XLE .... Adjusting RSI for Trend Identification .... Healthcare Remains Under Pressure .... //// ....
SPY is the Last One Standing
Modest selling pressure over the last three days triggered Chandelier Exits in...
READ MORE
MEMBERS ONLY

Are We At The End Of The Trump Rally?

by Martin Pring,
President, Pring Research
* A different way of looking at the VIX
* What about global equities?
* Sectors are largely pointing north
* Are commodities about to break out?
The market has been rising in an uninterrupted fashion since early November, on the back of a Trump election victory. The question naturally arises as to whether...
READ MORE
MEMBERS ONLY

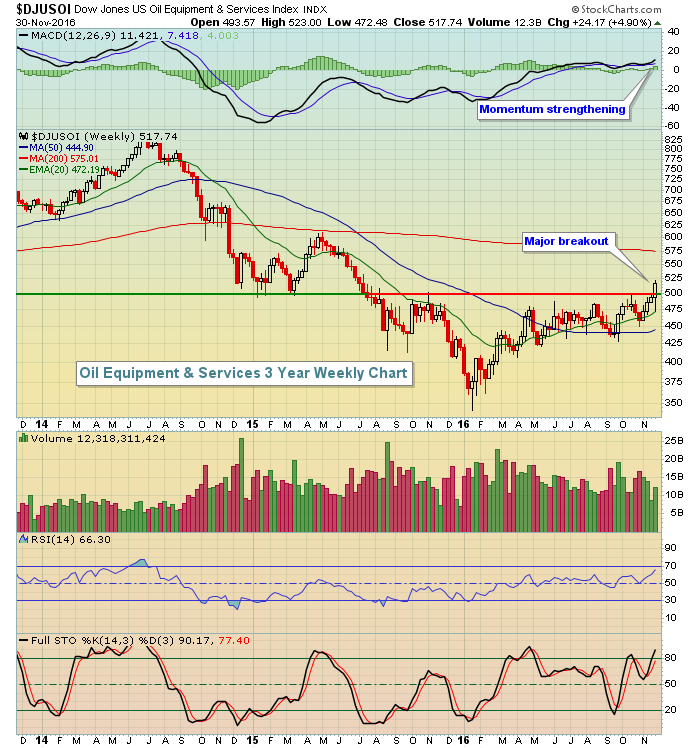
OPEC PRODUCTION CUT PUSHES OIL SHARPLY HIGHER -- ENERGY STOCKS LEAD MARKET HIGHER -- OIL SERVICES ETF ACHIEVES BULLISH BREAKOUT -- ENERGY LEADERS INCLUDE DEVON, MARATHON, AND MURPHY OIL -- RISING BOND YIELDS BOOST FINANCIALS WHILE UTILITIES FALL
by John Murphy,
Chief Technical Analyst, StockCharts.com
OIL SPIKES ON OPEC CUT... The agreement by OPEC to cut oil production by 1.2 million barrels a day has pushed the price of crude $3 (7%) higher in today's trading. The spike in oil is giving a huge boost to energy stocks which are leading the...
READ MORE
MEMBERS ONLY
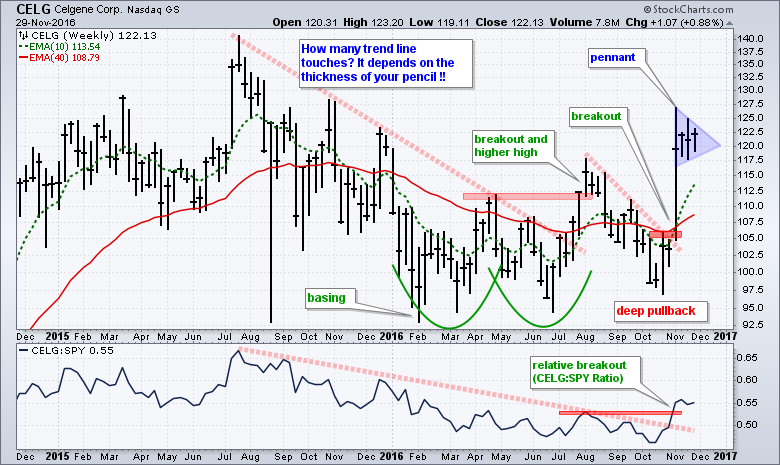
Base, Breakouts and Consolidation Bode well for this Big Biotech
by Arthur Hill,
Chief Technical Strategist, TrendInvestorPro.com
Celgene (CELG) showed bullish price action throughout 2016 and recently formed a bullish pennant that could set up an even more bullish 2017. Let's work from left to right on this chart starting with the big base that looks like a double bottom. CELG broke the "thick&...
READ MORE
MEMBERS ONLY

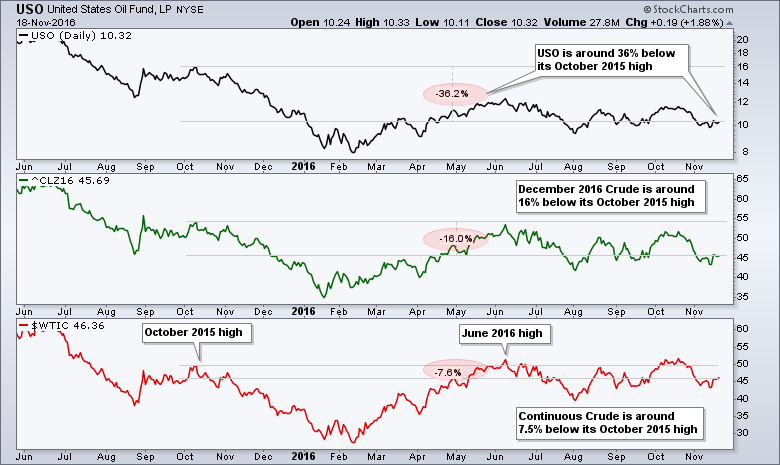
Head and Shoulders Forms on USO and WTIC

by Erin Swenlin,
Vice President, DecisionPoint.com
Readers of my DecisionPoint Alert blog have been watching the head and shoulders pattern forming on USO and Oil. There are plenty of fundamental factors that go into the pricing of Oil, but at this time they have lined up together with the technicals to form this bearish head and...
READ MORE
MEMBERS ONLY
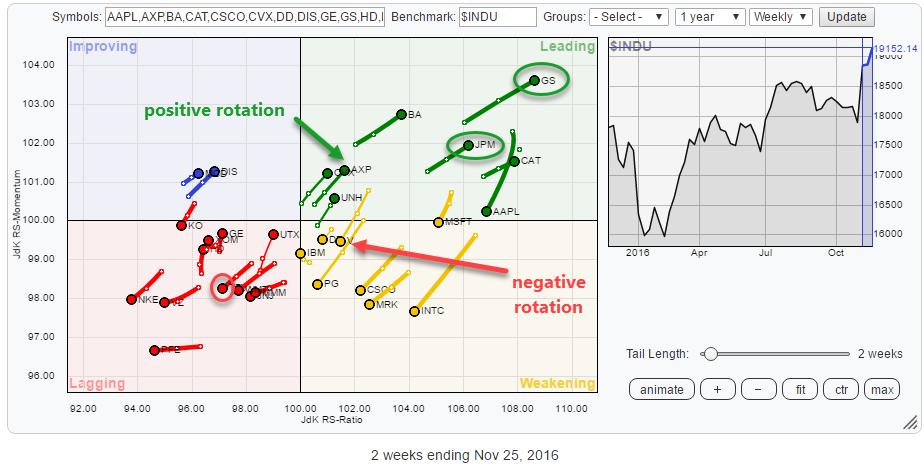
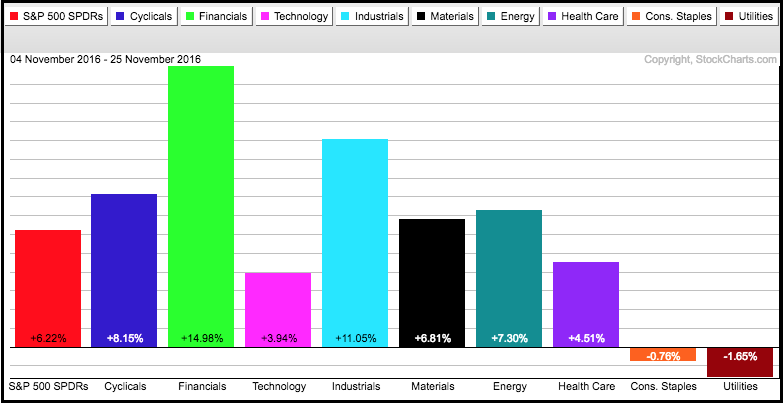
Financials are leading but they are not all equally good

by Julius de Kempenaer,
Senior Technical Analyst, StockCharts.com
After the dust has settled, it is time to assess what is going on under the hood.
The above Relative Rotation Graph holds the 30 Dow Jones Industrials components. As usual, they are fairly evenly spread out over the canvas of the RRG plot.
From the RRG of the US...
READ MORE
MEMBERS ONLY
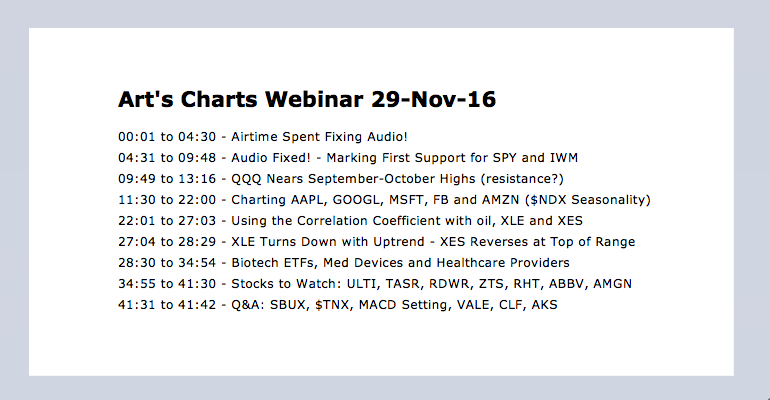
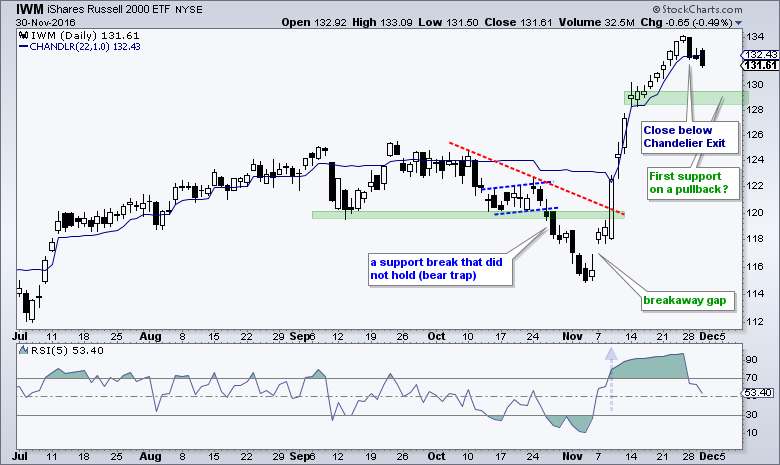
Marking First Support for SPY/IWM - QQQ Resistance? - Charting the Fab 5 (AAPL, GOOGL, MSFT, FB, AMZN) - Webinar Video
by Arthur Hill,
Chief Technical Strategist, TrendInvestorPro.com
----- Webinar Video ----- Art's Charts ChartList -----
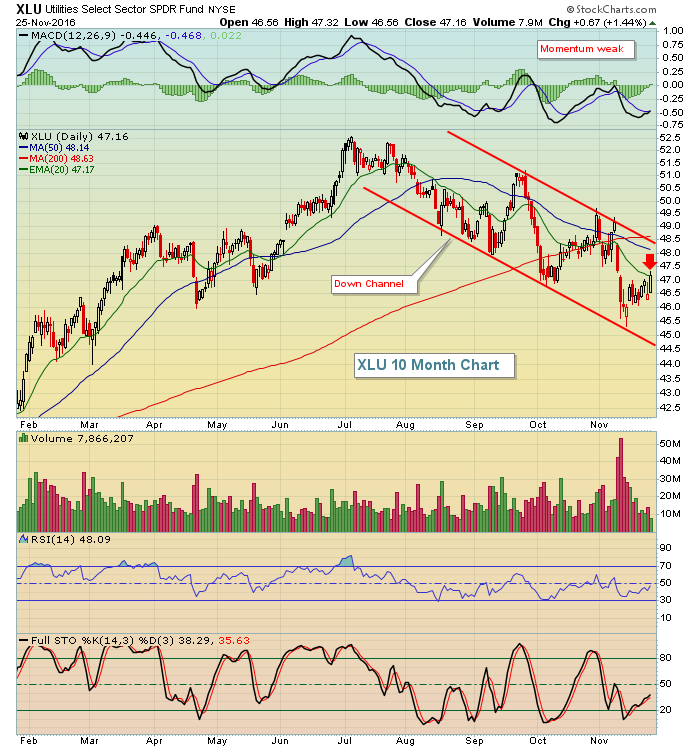
Staples and Utilities Bounce During Pullback .... Marking First Support for SPY and IWM .... QQQ Nears September-October Highs .... Charting the Fab Five: AAPL, GOOGL, MSFT, FB and AMZN .... Oil Turns Volatile ahead of OPEC Meeting (USO, XLE, XES) .... //// ....
Staples and Utilities...
READ MORE
MEMBERS ONLY
Gold Jumps As U.S. Stocks Take A Breather
by Tom Bowley,
Chief Market Strategist, EarningsBeats.com
Note
I'll be out for personal reasons on Wednesday so I'll not likely be able to post a blog article Wednesday morning. Also, the Bowley Briefing webinar, scheduled for Wednesday at noon EST, has been cancelled as well. I should be back in full swing Thursday....
READ MORE
MEMBERS ONLY
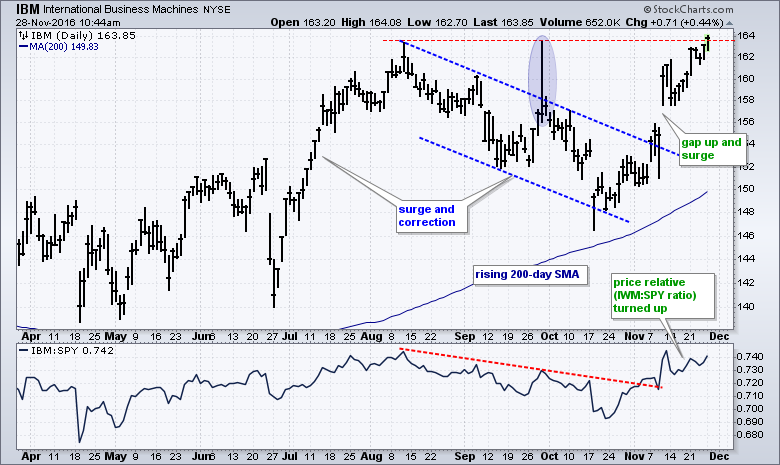
Big Blue Notches a 52-week High
by Arthur Hill,
Chief Technical Strategist, TrendInvestorPro.com
Even though its bell-weather status diminished over the years, IBM is still a big blue chip stock and remains a titan in the technology sector. Thus, a 52-week high in IBM bodes well for the market overall and the tech sector. The chart below shows IBM surging with the market...
READ MORE
MEMBERS ONLY
Friday's Action Follows History, Ends Higher
by Tom Bowley,
Chief Market Strategist, EarningsBeats.com
Market Recap for Friday, November 25, 2016
It was a shortened trading session on Friday, but that didn't stop the bulls. Our major indices all gapped higher and finished there as well. There was little volatility during the day as the S&P 500 spent most of...
READ MORE
MEMBERS ONLY
Overbought is Hard to Define and even Harder to Trade - Biotechs Recover to Keep Pullback Patterns Alive - ChartList Update
by Arthur Hill,
Chief Technical Strategist, TrendInvestorPro.com
Small-caps, Finance and Industrials Lead (sector PerfChart) .... The Overbought Progression (IWM, SPY, QQQ) .... Biotechs Recover to Keep Pullback Patterns in Play (XBI, IBB, XLV) .... Six of Nine Sectors with Active Golden Crosses .... New High Parade Shows Broad Strength (sector and industry group ETFs) .... ChartList Update (CHKP, INVN, RHT, SQ, AMGN,...
READ MORE
MEMBERS ONLY
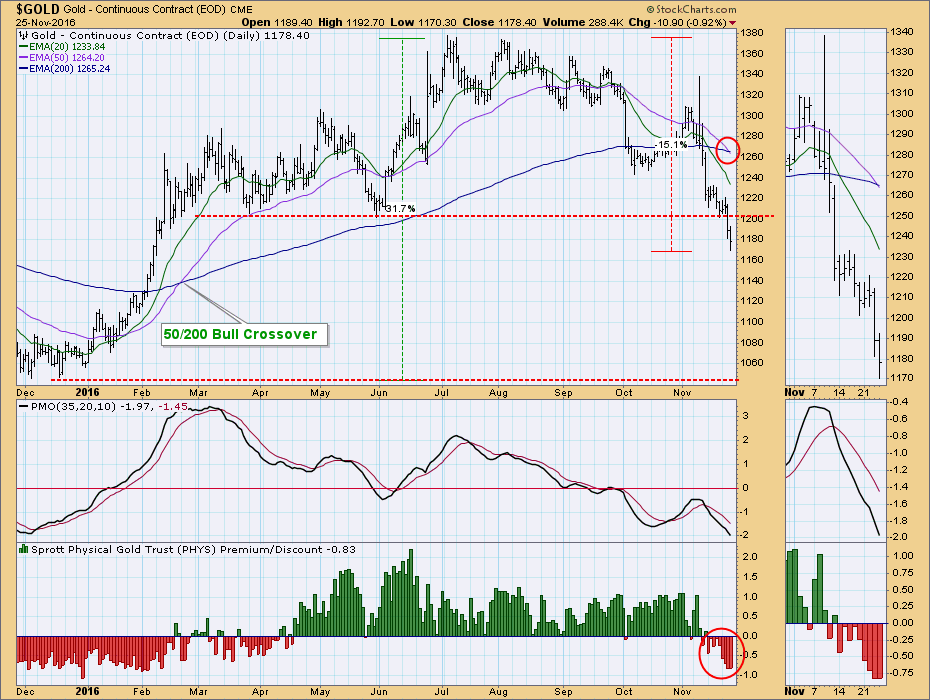
GOLD: Bear Market

by Carl Swenlin,
President and Founder, DecisionPoint.com
On Friday gold entered a bear market when the 50EMA crossed down through the 200EMA. The preceding bull market began with a rally off the December 2015 lows and hit its high in July after a more than +30% advance. From there it went into correction mode for five months,...
READ MORE
MEMBERS ONLY
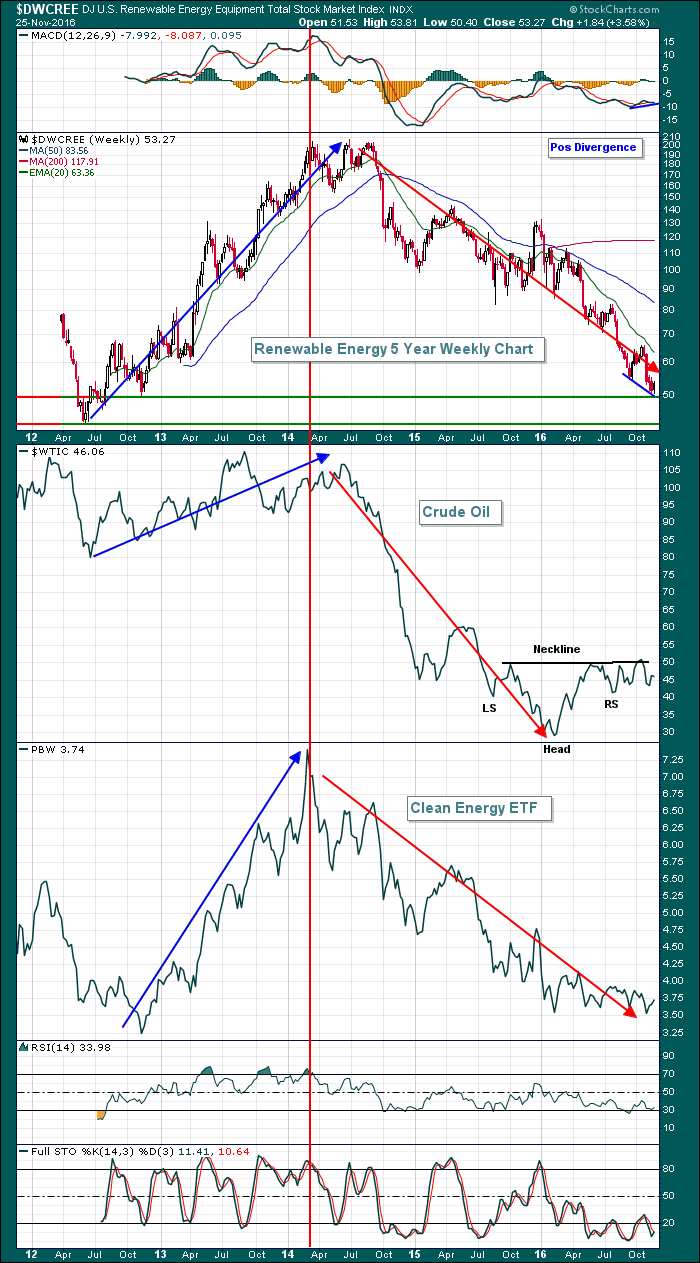
Ignore Renewable Energy Stocks Until This Happens
by Tom Bowley,
Chief Market Strategist, EarningsBeats.com
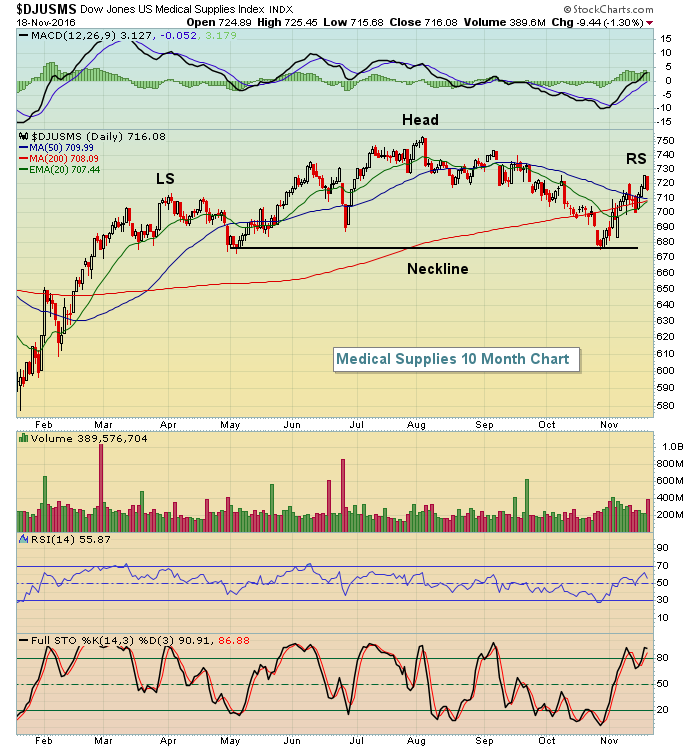
Renewable energy ($DWCREE) has been among the worst areas of the stock market to invest since topping over two years ago. There could be reason for hope, however, as rising crude oil prices ($WTIC) could trigger interest in the group again. There's a potential bottoming reverse head &...
READ MORE
MEMBERS ONLY
Dow Jones Tops 19000, S&P 500 Rolls Through 2200
by Tom Bowley,
Chief Market Strategist, EarningsBeats.com
Due to the Thanksgiving holiday, my article will be abbreviated today. I hope everyone is able to enjoy the long weekend with family and friends. I'll be back on Monday with my regular Trading Places blog article.
Market Recap for Wednesday, November 23, 2016
It was another record...
READ MORE
MEMBERS ONLY

Investment Quotes for All of Us

by Gatis Roze,
Author, "Tensile Trading"
As we celebrate this season of Thanksgiving, I want to acknowledge a few favorite quotes that are embedded with special wisdom for investors.
1. “Everything is worth what its purchaser will pay for it.” — Publilius Syrus (1st century BC)
2. “Don’t try to buy at the bottom and sell...
READ MORE
MEMBERS ONLY
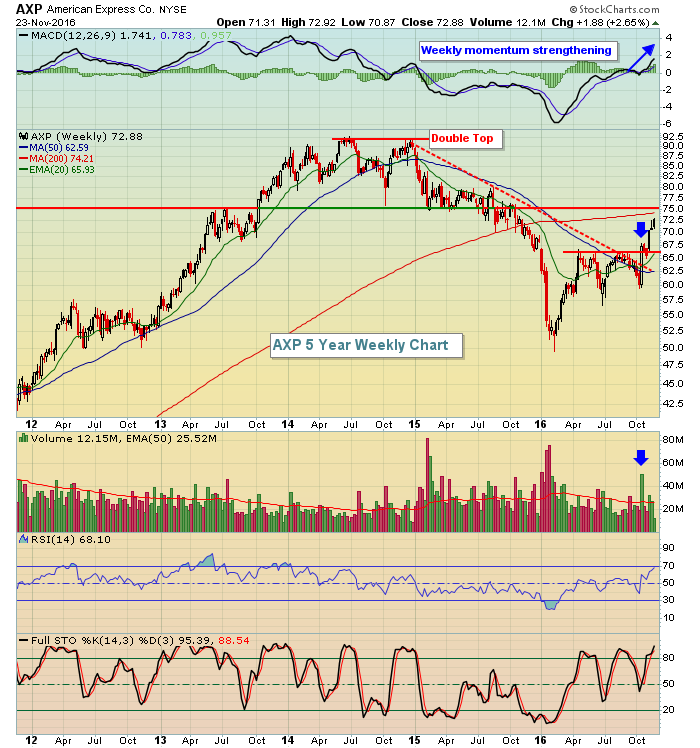
Give American Express Some Credit
by Tom Bowley,
Chief Market Strategist, EarningsBeats.com
After a double top and nearly two years of downtrending price, American Express (AXP) has finally turned the corner and its stock price is rising. Based on improving volume trends, strengthening momentum, and a hot financial sector, I look for the recent price strength to continue. Check out the AXP...
READ MORE
MEMBERS ONLY

BASE METALS INDEX HITS ANOTHER HIGH FOR THE YEAR -- SO DOES THE S&P 500 METALS & MINING SPDR -- STEEL LEADERS ARE AKSTEEL, CLIFFS NATURAL RESOURCES, AND US STEEL -- RISING DOLLAR, RISING RATES, AND A STRONG STOCK MARKET ARE PUSHING GOLD LOWER
by John Murphy,
Chief Technical Analyst, StockCharts.com
INDUSTRIAL METALS CONTINUE TO CLIMB... The huge rally in industrial (base) metals continues. Chart 1 shows the PowerShares DB Base Metals Fund (DBB) climbing to the highest level since mid-2015. The DBB reflects rising aluminum, copper, and zinc prices. Iron ore and steel prices are also surging in Chinese trading....
READ MORE
MEMBERS ONLY
Exxon Mobil is Lagging, but MACD is Firming and could be Turning
by Arthur Hill,
Chief Technical Strategist, TrendInvestorPro.com
The Energy SPDR (XLE) hit a new 52-week high this week, but its largest component, Exxon Mobil (XOM) remains well below its summer high and is not participating. The second biggest component, Chevron (CVX), is leading the charge with a 6+ percent advance in November and a 52-week high. Note...
READ MORE
MEMBERS ONLY
Small Caps Lead Another Surge, Bull Rages On
by Tom Bowley,
Chief Market Strategist, EarningsBeats.com
Market Recap for Tuesday, November 22, 2016
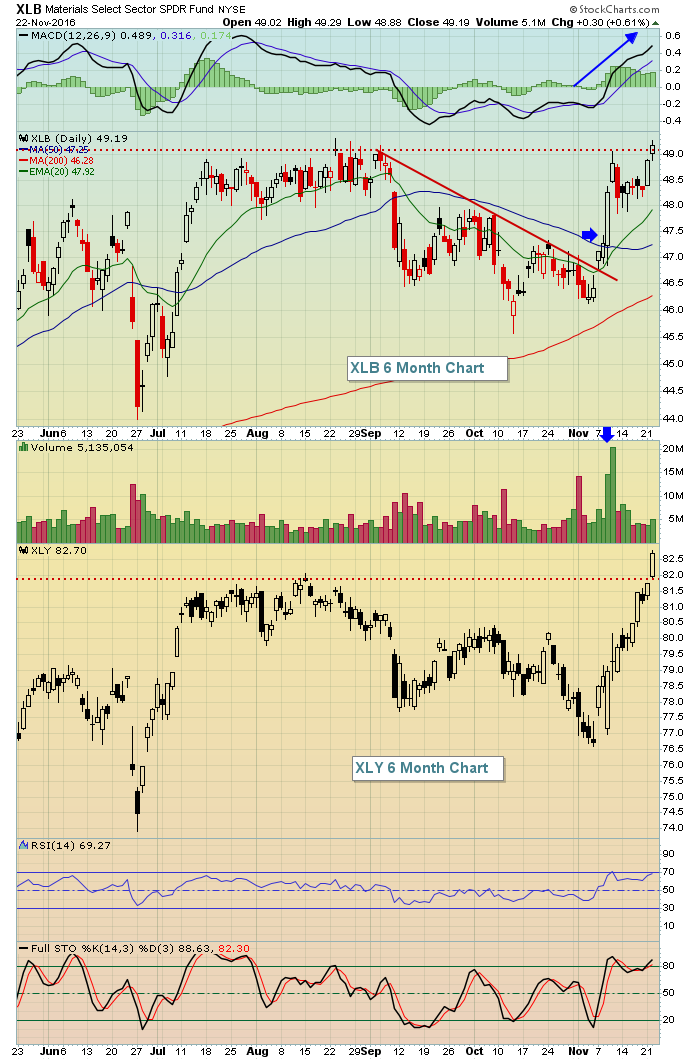
You can't keep the bulls down right now, it's that simple. Yesterday, leadership turned to consumer discretionary (XLY, +1.19%) and materials (XLB, +0.61%) as small caps led a surge that took all of our major indices to...
READ MORE
MEMBERS ONLY
Shrinking Volume - Holiday Trading or Lack of Participation?
by Erin Swenlin,
Vice President, DecisionPoint.com
Since the election and the explosive rally that resulted, volume has been slowly trending lower. This isn't a phenomenon specific to one index, it has been occurring in three of the large-cap indexes we track using the DecisionPoint Scoreboards. Some have pointed to holiday trading as a possibility....
READ MORE
MEMBERS ONLY

CONSUMER DISCRETIONARY SPDR HITS NEW RECORD -- S&P 500 RETAIL SPDR ACHIEVES BULLISH BREAKOUT-- MATERIAL SPDR NEARS UPSIDE BREAKOUT -- COPPER AND STEEL STOCKS LEAD XLB HIGHER
by John Murphy,
Chief Technical Analyst, StockCharts.com
RETAILERS LEAD CYCLICALS TO NEW HIGHS... My message from last Monday wrote about apparel retailers leading retail stocks higher which were leading the cyclical sector higher. The same headline could be written again today. Chart 1 shows the Consumer Discretionary SPDR (XLY) rising above its August high to a new...
READ MORE
MEMBERS ONLY

Get Your Motor Going

by Bruce Fraser,
Industry-leading "Wyckoffian"
Recently Toyota Motors (TM) has shown signs of life after a long cyclic decline. There seems to be a rhythm between the swings in the price of TM and the trend of the dollar. A strong dollar can improve profit margins of the Japan based auto manufacturer. The current rising...
READ MORE
MEMBERS ONLY
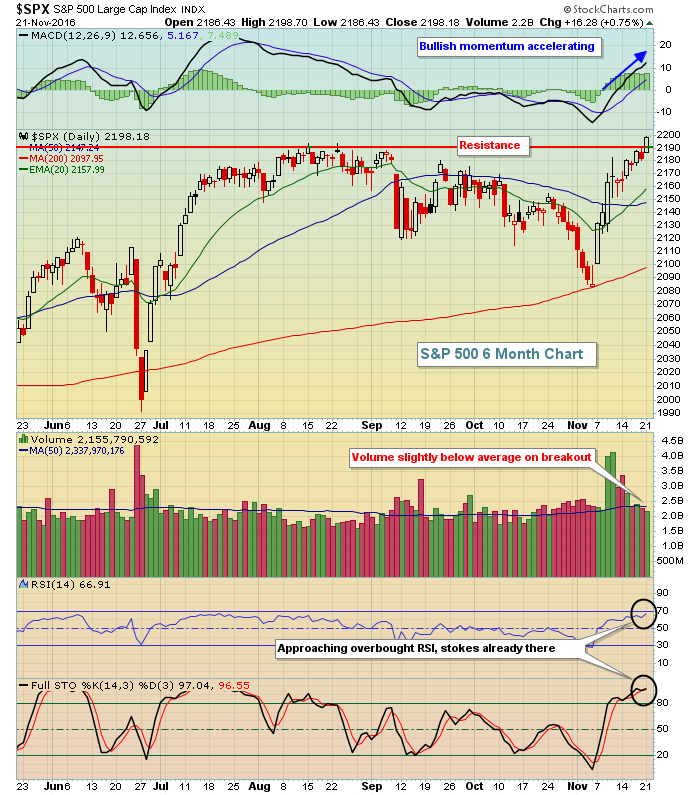
S&P 500 Hits All-Time High, NASDAQ Rolls, Energy Breaks Out
by Tom Bowley,
Chief Market Strategist, EarningsBeats.com
Market Recap for Monday, November 21, 2016
It took months, but the S&P 500 finally did what bulls had been hoping for - it closed at an all-time high, breaking above the previous record of 2190. If there was one negative, it was that volume finished below its...
READ MORE
MEMBERS ONLY
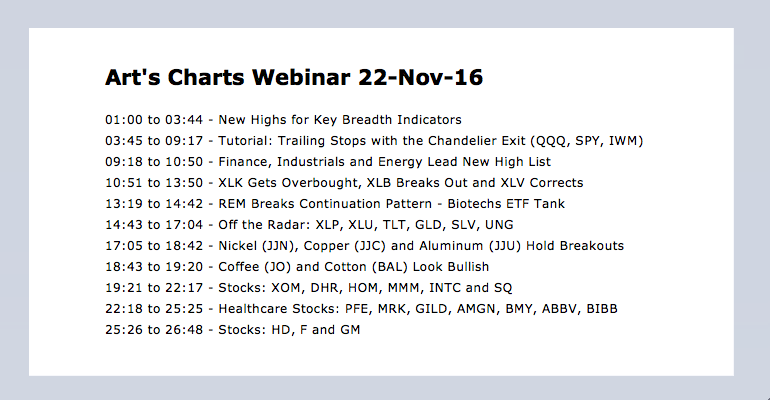
Breadth Lines Hit New Highs - Trailing with a Chandelier Exit - Leading Sectors - An Island Reversal for XLV - Webinar Video
by Arthur Hill,
Chief Technical Strategist, TrendInvestorPro.com
-----Webinar Video ----- Art's Charts ChartList -----
New Highs for Key Breadth Indicators .... Trailing with the Chandelier Exit .... QQQ Joins the Overbought Ranks .... Finance, Industrials and Energy .... Lead New High List .... XLK Becomes Overbought .... XLB Breaks out of Pennant .... XLV Corrects after Island Reversal .... REM Breaks Continuation Pattern...
READ MORE
MEMBERS ONLY

CRUDE OIL JUMPS 4% ON HOPES FOR OPEC CUT -- ENERGY SPDR HITS NEW HIGH -- OIL SERVICES ETF MAY BE NEXT -- ENERGY AND MINERS LEAD CANADIAN STOCKS HIGHER -- HUDBAY MINERALS ACHIEVES BULLISH BREAKOUT -- SO DOES FREEPORT MCMORAN
by John Murphy,
Chief Technical Analyst, StockCharts.com
CRUDE OIL CLIMBS ABOVE 50-DAY AVERAGE... Renewed optimism for an OPEC output cut has pushed crude oil 4% higher in today's trading and has given a big boost to energy shares and the rest of the stock market. Chart 1 shows WTIC Light Crude oil rising above its...
READ MORE
MEMBERS ONLY

Why Is A Strong Housing Report Is Good For The Stock Market
by Martin Pring,
President, Pring Research
* Subdued response to great housing numbers is a bullish sign
* What does this mean for housing stocks?
* Housing conclusion
* Small cap big profits?
Subdued response to great housing numbers is a bullish sign
Sometimes very important developments for the market receive widespread attention, quickly experiencing a swing in sentiment as...
READ MORE
MEMBERS ONLY
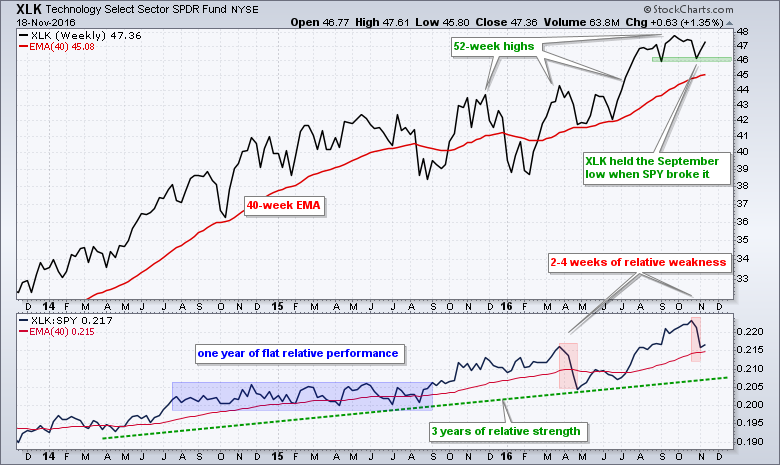
Technology SPDR: Lagging for 3 Weeks and Leading for 3 Years
by Arthur Hill,
Chief Technical Strategist, TrendInvestorPro.com
Despite relative weakness the last few weeks, XLK remains in a clear uptrend and shows no signs of weakness on the price chart. First, note that XLK recorded 52-week highs throughout 2016 and is currently less than 2% from a new high. Second, XLK held the September low when the...
READ MORE
MEMBERS ONLY
S&P 500 On Brink Of Milestone Breakout
by Tom Bowley,
Chief Market Strategist, EarningsBeats.com
Market Recap for Friday, November 18, 2016
Friday was mostly a day of profit taking - nothing horrible but down nonetheless. Energy (XLE, +0.41%) was able to avoid the downdraft and financials (XLF, +0.00%) broke even, but the other seven sectors finished down, led by healthcare (XLV, -1....
READ MORE
MEMBERS ONLY

Dancing with the One That Brung Ya!

by Greg Morris,
Veteran Technical Analyst, Investor, and Author
My apologies to the late Darrell Royal, the University of Texas football coach who used this saying often when defending his continued use of the “wishbone T,” an offensive football formation that some were always questioning. The saying has a valuable message that is applicable to many endeavors; simply, do...
READ MORE
MEMBERS ONLY
Breaking Down the Energy Sector - Oil, Breadth and Trends - XLE and XES - Symbols for Futures Contracts
by Arthur Hill,
Chief Technical Strategist, TrendInvestorPro.com
Near-by Futures, Continuous Futures and ETFs .... December Crude Shows Signs of a Reversal .... Brent Crude is Holding up Better .... Upside Targets for Light Crude and Bren .... Energy Breadth Still Bullish Overall .... XLE Extends Choppy Uptrend .... XES Surges toward Range Resistance .... Symbols for Futures Contracts .... //// ....
Today's commentary will dissect...
READ MORE
MEMBERS ONLY
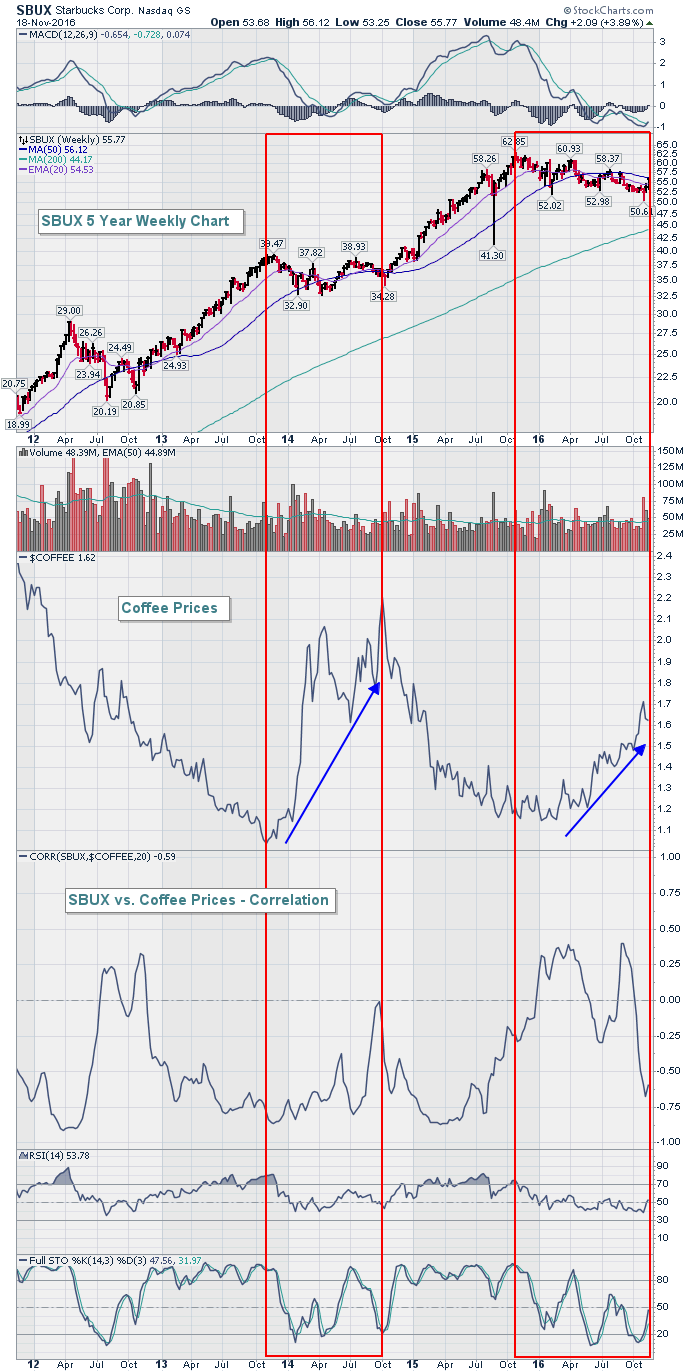
There's Only One Thing That Slows Starbucks
by Tom Bowley,
Chief Market Strategist, EarningsBeats.com
One of the best stock market stories of this century has been the remarkable growth of Starbucks (SBUX) and over the past five years, I can only point to one thing that slows the price appreciation. Coffee prices. That seems simple enough to understand, but the chart below brings it...
READ MORE
MEMBERS ONLY
There Are Bear Markets Out There
by Carl Swenlin,
President and Founder, DecisionPoint.com
When we discuss bear markets, we usually think of the major market indexes, the S&P 500 Index in particular; however, any price index -- market sector or even an individual stock -- can be experiencing a bear market, even in the midst of a broad-based bull market like...
READ MORE
MEMBERS ONLY
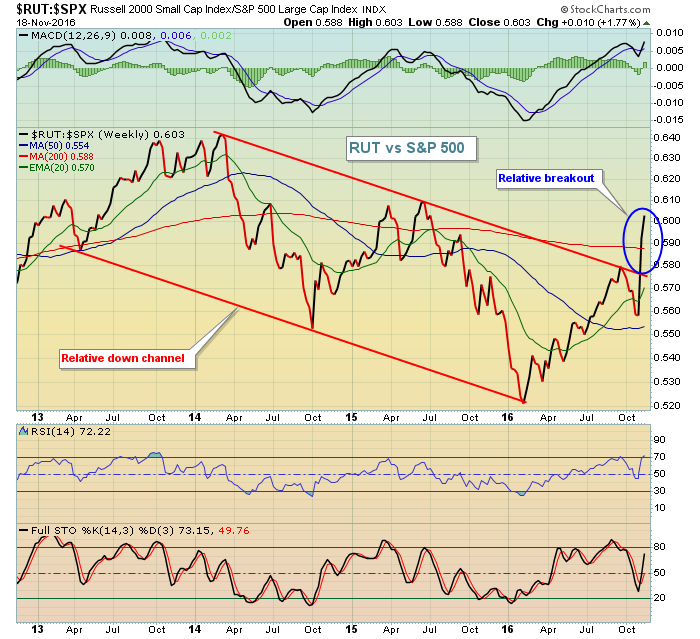
Small Caps Flying High, Now Feeling Historical Tailwinds
by Tom Bowley,
Chief Market Strategist, EarningsBeats.com
The Russell 2000 is a small cap index and it had been lagging for quite awhile....until 2016. This year the Russell 2000 is wildly outperforming the S&P 500 and now we're heading into December, its most bullish calendar month of the year by far. Since...
READ MORE
MEMBERS ONLY
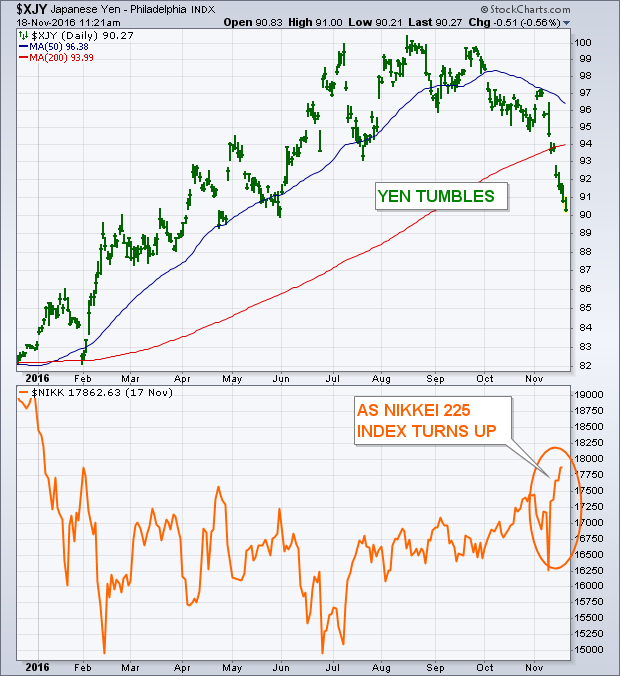
Falling Yen Boosts Nikkei Index
by John Murphy,
Chief Technical Analyst, StockCharts.com
My October 6 market message suggested that the Japanese yen was peaking which would give a boost to export-oriented Japanese stocks which appeared to be bottoming. Since then, the yen has fallen to the lowest level in six months against the dollar, and has fallen below its 200-day average (Chart...
READ MORE
MEMBERS ONLY
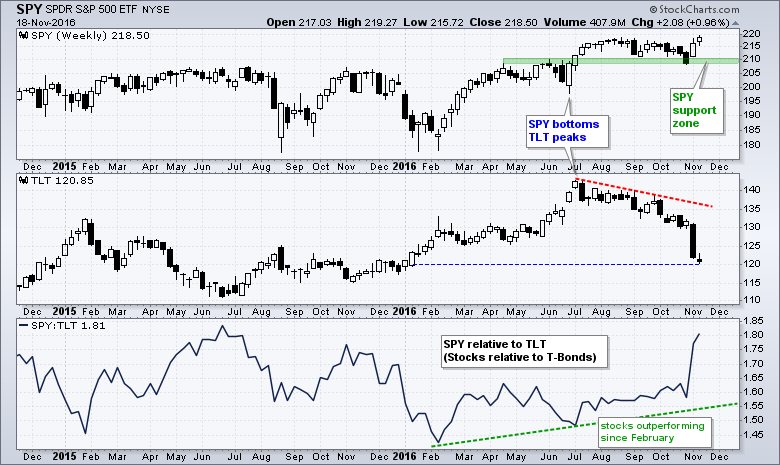
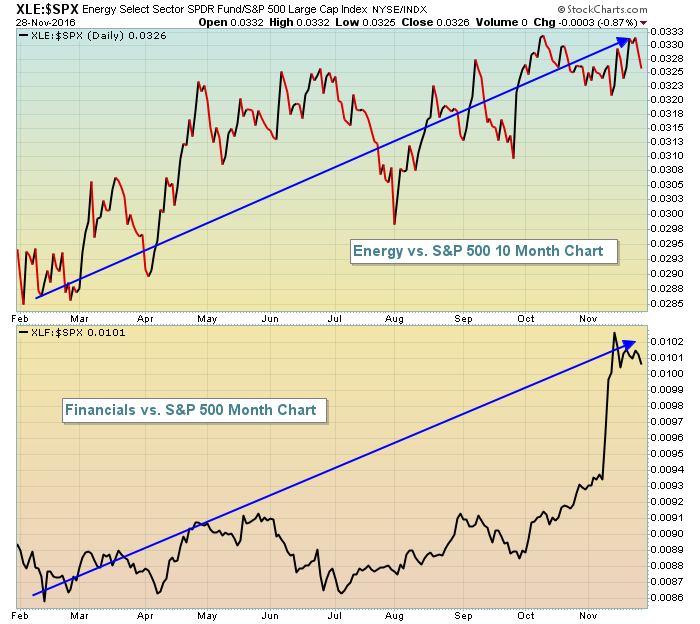
Move to Risk Began in July and Continued in November
by Arthur Hill,
Chief Technical Strategist, TrendInvestorPro.com
The market began its move to riskier assets in July and this move simply accelerated over the last two weeks. The chart below shows stocks (risk assets) bottoming in late June and Treasury bonds (safe-haven assets) peaking in early July. The S&P 500 SPDR (SPY) hit a new...
READ MORE
MEMBERS ONLY

How to use Relative Rotation Graphs to monitor your portfolio.
by Julius de Kempenaer,
Senior Technical Analyst, StockCharts.com
As (many of) you may know my fellow commentator Arthur Hill lives in Belgium. That makes him, geographically, my closest StockCharts.com colleague.
On Tuesday 8 November, indeed election day, the Amsterdam chapter of the MTA (Market Technicians Association) had Katie Stockton of BTIG over as a guest speaker for...
READ MORE
MEMBERS ONLY
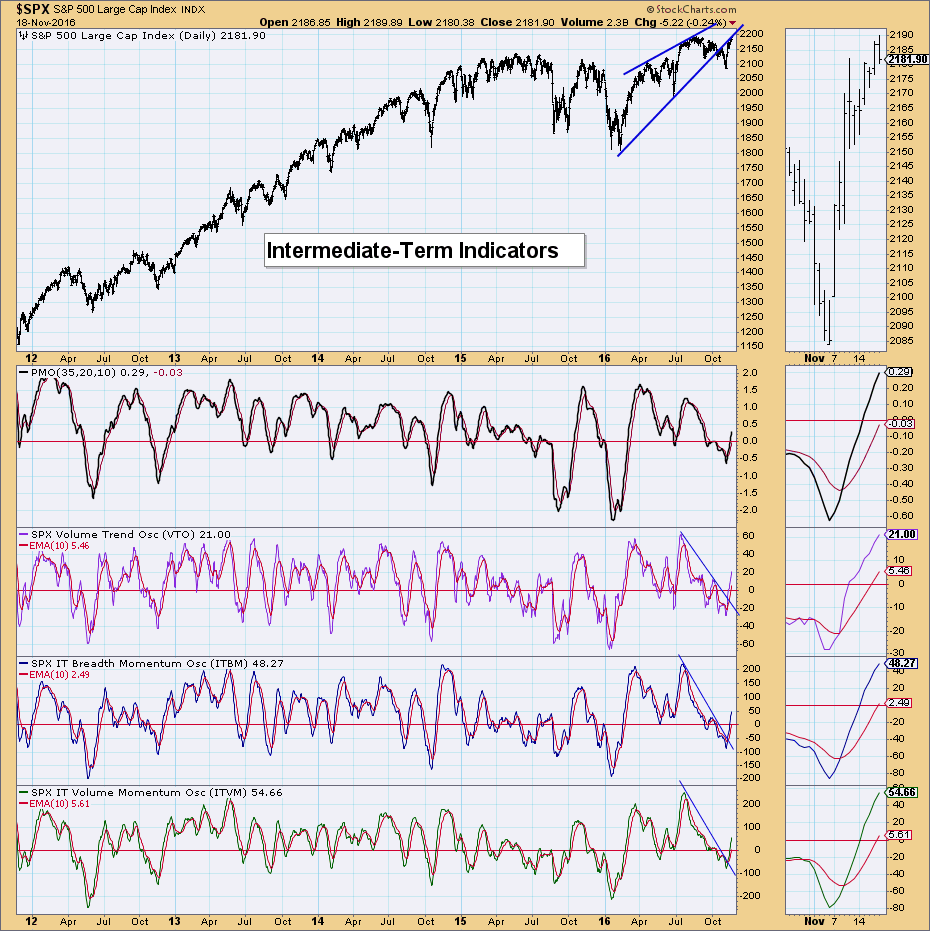
Put/Call Ratio and PMO Analysis Intermediate-Term Bullish
by Erin Swenlin,
Vice President, DecisionPoint.com
The Dow has shattered records, small- and mid-caps are doing the same. Those that have not yet reached record highs are still participating, preparing to break above all-time highs. Indicators for some time have been leaning bearish, but in the past week DecisionPoint indicators in the intermediate term have a...
READ MORE