MEMBERS ONLY

Are Extremely Overbought Conditions Good or Bad for Stocks?

by David Keller,
President and Chief Strategist, Sierra Alpha Research
When a stock shows an RSI value above 80, is that a good thing or a bad thing? In this video, Dave reviews a series of examples showing this "extreme overbought" condition, highlights how these signals usually occur not at the end of, but often earlier in an...
READ MORE
MEMBERS ONLY

Riding the Stock Market's Wave: How to Maximize Your Gains

by Jayanthi Gopalakrishnan,
Director of Site Content, StockCharts.com
KEY TAKEAWAYS
* The broader US stock market indexes took a breather on Tuesday.
* Mega-cap Mag 7 stocks are back in the limelight.
* Investors are rotating into Technology and Communication Services sectors.
The post-election euphoria may have taken a breather on Tuesday, as the US stock market indexes closed lower. The...
READ MORE
MEMBERS ONLY

What Seasonality Charts Reveal About the Top Sectors to Watch Right Now!

by Karl Montevirgen,
The StockCharts Insider
KEY TAKEAWAYS
* Seasonality provides a unique historical technical context, as long as you remember that it's more of a traffic flow map than a crystal ball.
* Seasonality charts can be useful for drilling down from market to sector or sector to stocks.
* Checking the daily chart is crucial...
READ MORE
MEMBERS ONLY
MUST SEE Updates to RRG Charts on StockCharts!

by Julius de Kempenaer,
Senior Technical Analyst, StockCharts.com
In this video from StockCharts TV,Julius pulls the curtain back on the updated Relative Rotation Graphs that are now available on the StockCharts website. He demonstrates a myriad of new features, including alignment of the intraday time frames with SharpCharts/ACP, zoom and position control with your mouse, and...
READ MORE
MEMBERS ONLY
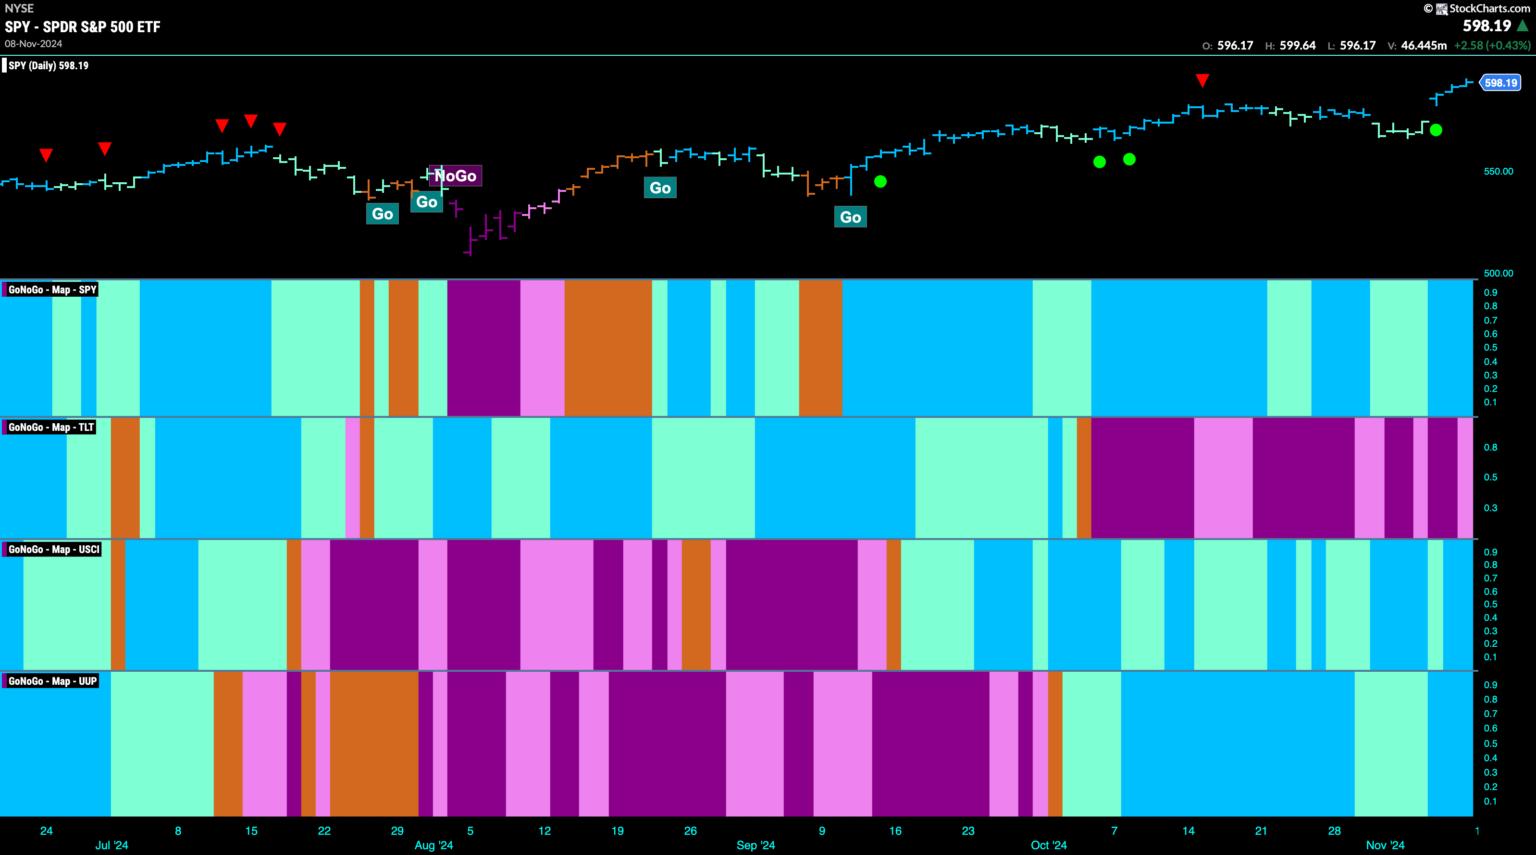
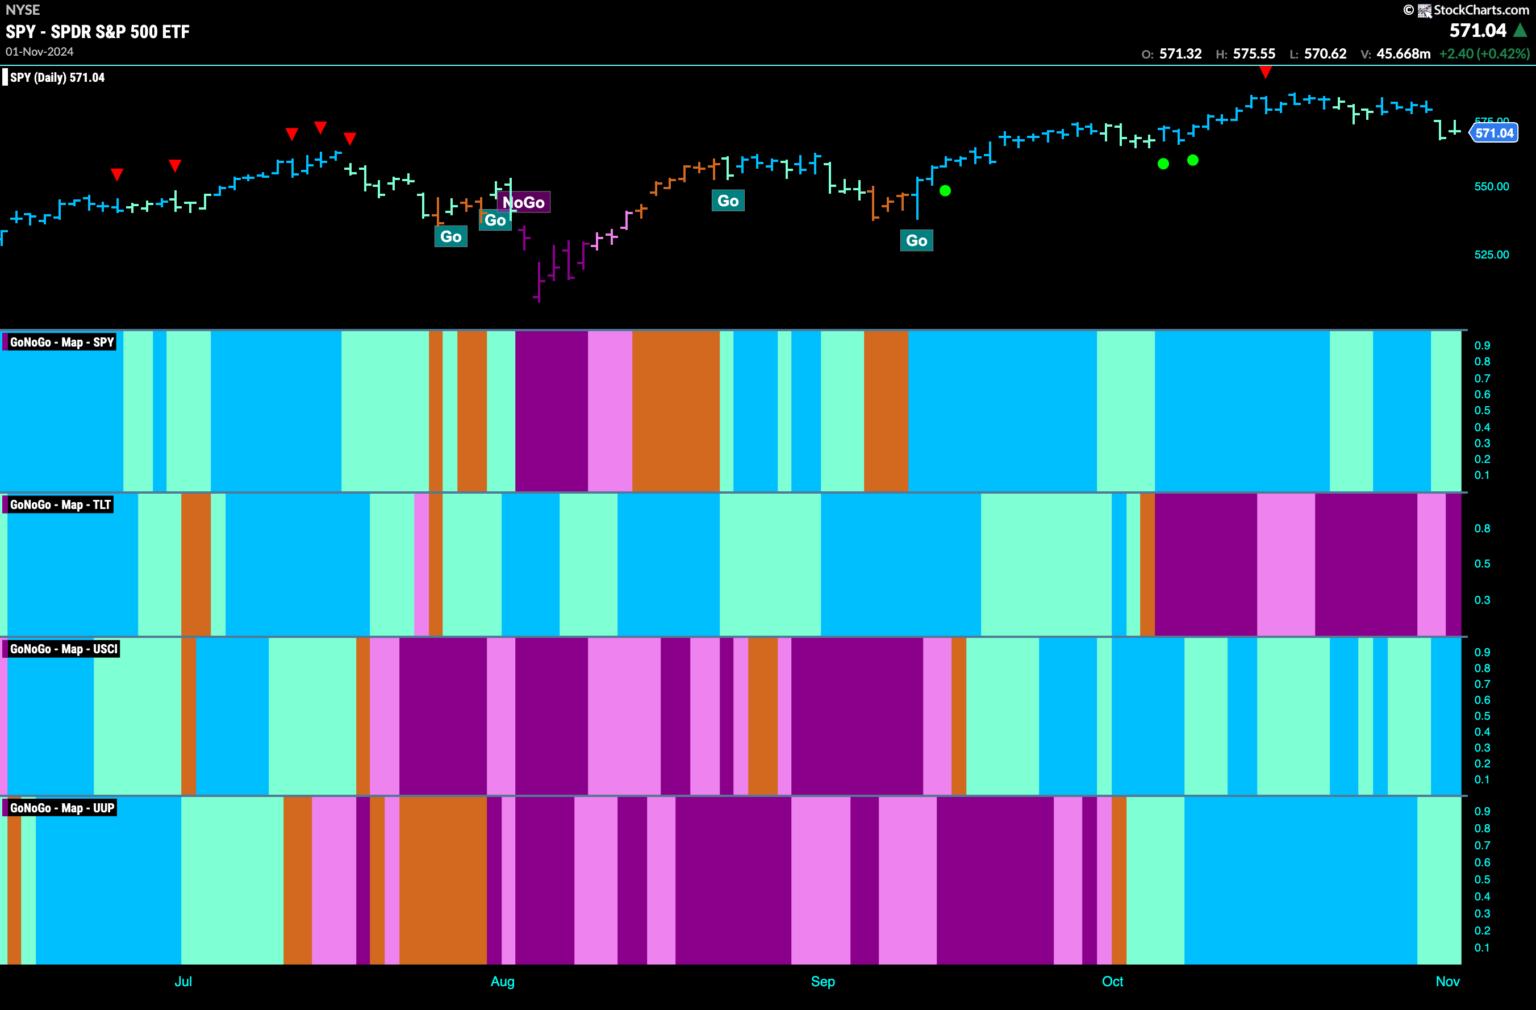
Equity "Go" Trend Sees Surge in Strength as Financials Drive Price Higher

by Alex Cole,
Co-founder, GoNoGo Charts®

by Tyler Wood,
Co-founder, GoNoGo Charts®
Good morning and welcome to this week's Flight Path. Equities saw the "Go" trend continued this week and price gapped higher after some weaker aqua bars. We now see GoNoGo Trend painting strong blue bars at new highs. Treasury bond prices remained in a "NoGo&...
READ MORE
MEMBERS ONLY
Is the Trump Rally Like the Reagan Rally?

by Erin Swenlin,
Vice President, DecisionPoint.com
Today Carl compares this week's Trump Rally with the rally we saw after Reagan was elected in 1980. There are similarities and differences. The Trump rally has lifted certain sectors of the market as well as Cryptocurrencies. While the Reagan rally had different catalysts.
The market continues to...
READ MORE
MEMBERS ONLY

Secular Bull Market Continues, But With Major Rotation

by Tom Bowley,
Chief Market Strategist, EarningsBeats.com
Enjoying these HUGE rallies is much easier when you have confidence the stock market is in a secular bull market and heading higher. It also helps when you enter a period of historical strength - the absolute best strength that we see anytime throughout the calendar year. This combination can...
READ MORE
MEMBERS ONLY

Week Ahead: NIFTY Likely to Stay Sluggish; Multiple Resistances Nestled in This Zone

by Milan Vaishnav,
Founder and Technical Analyst, EquityResearch.asia and ChartWizard.ae
The markets remained tentative over the past five days while continuing to trade with a weak undertone, while the Nifty digested the reaction to the US election outcome. There were two days of a strong technical rebound; this was subsequently sold into, which kept Nifty in a broadly-defined range. The...
READ MORE
MEMBERS ONLY

Best Way to Capitalize on Election Rally!

by Mary Ellen McGonagle,
President, MEM Investment Research
In this StockCharts TV video, Mary Ellen presents a deep dive into last week's sharp rally in the markets. She highlights what areas could perform best under a Trump administration and how to spot a pullback. She takes a close look at the "New Economy" and...
READ MORE
MEMBERS ONLY

Stock Market Hits Record Levels: Prepare for What Inflation Can Bring Next
by Jayanthi Gopalakrishnan,
Director of Site Content, StockCharts.com
KEY TAKEAWAYS
* The broader stock market indexes hit milestone levels this week.
* Monitoring volatility in bonds could be a leading indicator in market action shifts.
* The US dollar can provide clues about future stock market action.
Another packed week for the stock market has come to a close. The broader...
READ MORE
MEMBERS ONLY
Three Sectors Leading SPY Back to Offense
by Julius de Kempenaer,
Senior Technical Analyst, StockCharts.com
KEY TAKEAWAYS
* The market came out of defensive mode after the election.
* Old resistance at 585 is now support for SPY.
* XLC, XLY, and XLF are all showing strength.
First of all, for those of you looking for a new video this week, I have intentionally skipped it because I...
READ MORE
MEMBERS ONLY

This Sector is Worth Watching, Not Just For Itself But as a Market Bellwether

by Martin Pring,
President, Pring Research
Last week, I drew your attention to the fact that out that three US market sectors had experienced bearish two-bar reversals on the weekly charts and were likely to retrace some of their previous advances. I also pointed out that this was only one piece of negative evidence and that...
READ MORE
MEMBERS ONLY

Election Aftermath: Unleashing Profitable Small Cap Stocks
by Jayanthi Gopalakrishnan,
Director of Site Content, StockCharts.com
KEY TAKEAWAYS
* Small cap stocks were the biggest gainers in post-election Wednesday.
* Financials was the top-performing sector in Wednesday's trading.
* Cryptocurrencies, US dollar, and Treasury yields rose in anticipation of an inflationary environment.
The risk-on sentiment has returned to the stock market. Stocks traded significantly higher ahead of...
READ MORE
MEMBERS ONLY

Markets Surge Post-Election: Is It Time to Go All-In?
by Karl Montevirgen,
The StockCharts Insider
KEY TAKEAWAYS
* The S&P 500 jumped post-election, exhibiting a strong gap.
* Sentiment indicators remain bullish, though not quite euphoric.
* Momentum indicators, however, signal a slowdown ahead for stocks.
When major shifts happen in the market, such as the one we're seeing the morning after the election,...
READ MORE
MEMBERS ONLY

The SCTR Report: What Coinbase's Dramatic Price Surge Means For Your Portfolio
by Jayanthi Gopalakrishnan,
Director of Site Content, StockCharts.com
KEY TAKEAWAYS
* Coinbase made it to the top of the Top Up Large Cap stocks SCTR Report on the day after the US elections.
* The price surge in Coinbase stock could be the start of an upward move.
* Trading options on COIN provide an alternative to buying COIN stock.
Now...
READ MORE
MEMBERS ONLY

It's GAME ON for These Stocks

by Joe Rabil,
President, Rabil Stock Research
In this exclusive StockCharts video, Joe shows a specific trade setup in multiple timeframes that identifies the start of an important trend. He explains the 4 keys to this setup and shows 5 examples of stocks meeting the criteria right now. Joe then covers numerous indices, commodities, 10-year Rates, and...
READ MORE
MEMBERS ONLY
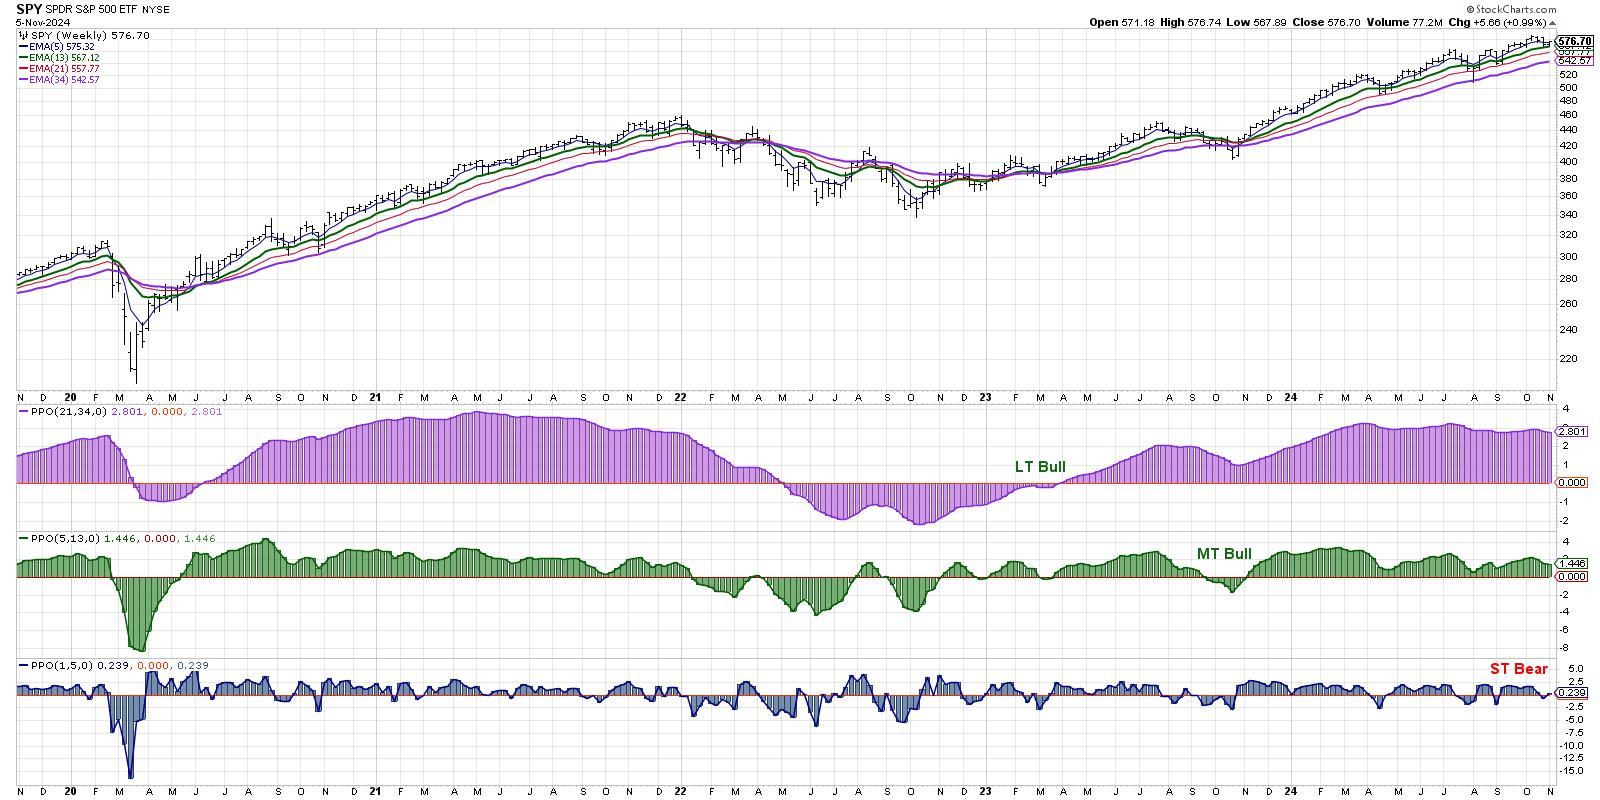
Short-Term Bearish Signal as Markets Brace for News-Heavy Week
by David Keller,
President and Chief Strategist, Sierra Alpha Research
KEY TAKEAWAYS
* We can define the market trend on multiple time frames using a series of exponential moving averages.
* While our short-term Market Trend Model turned bearish last week, the medium-term and long-term models remain bullish.
* 2021 could provide a compelling analogue to what we're experiencing so far...
READ MORE
MEMBERS ONLY
Stock Market Today: How to Scan for Post-Election Profit Opportunities
by Karl Montevirgen,
The StockCharts Insider
KEY TAKEAWAYS
* Pre- and post-election jitters can cause market reactions and overreactions.
* The best thing you can do is get a bird's-eye view of opportunities that may unfold as the political fog clears.
* MarketCarpets is an effective tool to help you gauge market activity and spot high-probability trades....
READ MORE
MEMBERS ONLY
Market Trend Model Flashes Short-Term Bearish, What's Next?
by David Keller,
President and Chief Strategist, Sierra Alpha Research
In this video, Dave breaks down the three time frames in his Market Trend Model, reveals the short-term bearish signal that flashed on Friday's close, relates the current configuration to previous bull and bear market cycles, and shares how investors can best track this model to ensure they&...
READ MORE
MEMBERS ONLY

DP Trading Room: Six-Month Period of Favorable Seasonality Begins Now!
by Erin Swenlin,
Vice President, DecisionPoint.com
It's here! The SPY starts a period of favorable seasonality for the next six months. Carl takes us through his charts and explains favorable versus unfavorable periods of seasonality.
Carl covers our signal tables showing new weakness seeping in despite this period of favorable seasonality. The market looks...
READ MORE
MEMBERS ONLY
Equities Hang on to Weaker "Go" Trend as Communications Offers a Helping Hand
by Alex Cole,
Co-founder, GoNoGo Charts®
by Tyler Wood,
Co-founder, GoNoGo Charts®
Good morning and welcome to this week's Flight Path. Equities saw the "Go" trend remain in place this week but we saw weakness with a few aqua bars. GoNoGo Trend shows that the "NoGo" trend strengthened at the end of the week in treasury...
READ MORE
MEMBERS ONLY
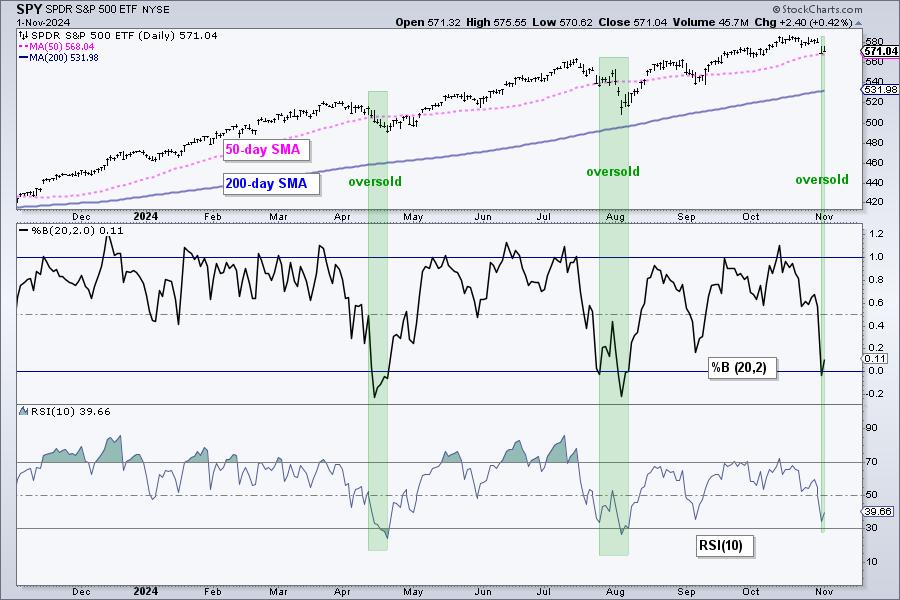
Finding and Trading Oversold Conditions within Long-term Uptrends

by Arthur Hill,
Chief Technical Strategist, TrendInvestorPro.com
KEY TAKEAWAYS
* Oversold conditions create opportunities to trade with the long-term uptrend.
* Oversold conditions provide the setup, but not the signals.
* Chartists need a signal because price can become oversold and remain oversold.
There is only one way to trade in a long-term uptrend: long. Forget about picking tops and...
READ MORE
MEMBERS ONLY

Week Ahead: NIFTY May See Stable Start; Likely to Remain Under Selling Pressure at Higher Levels
by Milan Vaishnav,
Founder and Technical Analyst, EquityResearch.asia and ChartWizard.ae
The Nifty largely consolidated over the past five sessions, but did so with a bearish undertone. The Nifty traded in a defined range and closed the week with a modest gain. Importantly, the index also stayed below its crucial resistance points. The volatility also expanded; the IndiaVIX surged higher by...
READ MORE
MEMBERS ONLY

S&P 500 Under Pressure, Can Strong Seasonality Save It?
by Julius de Kempenaer,
Senior Technical Analyst, StockCharts.com
In this video from StockCharts TV,Julius begins by looking back at the completed monthly bars for October to assess the long term trends in the 11 S&P sectors. He follows that up with an updated view for SPY in coming weeks. After that, Julius looks forward using...
READ MORE
MEMBERS ONLY

These S&P 500 Stocks Are Poised To Outperform!
by Mary Ellen McGonagle,
President, MEM Investment Research
In this StockCharts TV video, Mary Ellen reviews the negative price action in the broader markets while highlighting pockets of strength. She shares how the rise in interest rates is impacting the markets ahead of next week's FOMC meeting. Last up is a segment on how to use...
READ MORE
MEMBERS ONLY

Election-Related Market Swings: How to Stay Ahead
by Jayanthi Gopalakrishnan,
Director of Site Content, StockCharts.com
KEY TAKEAWAYS
* Markets bounced back after Thursday's selloff.
* Small-cap stocks are struggling to gain steam even though interest rates are likely to decline.
* Treasury yields continue to rise.
After yesterday's "trick," investors received a "treat" at the end of the trading week,...
READ MORE
MEMBERS ONLY

Top Ten Charts to Watch for November 2024
by David Keller,
President and Chief Strategist, Sierra Alpha Research
With the Magnificent 7 stocks struggling to hold up through a tumultuous earnings season, what sort of opportunities are emerging on the charts going into November? Today, we'll break down some of the names we've included in our Top Ten Charts to Watch for November 2024....
READ MORE
MEMBERS ONLY

Price Momentum Oscillator (PMO) Internals Still a Problem
by Erin Swenlin,
Vice President, DecisionPoint.com
We noticed on Thursday evening how poor the internals were for the SPY, based on Price Momentum Oscillator (PMO) internals. These internals are the percent of stocks with rising PMOs and the percent of stocks with PMO Crossover BUY Signals. The accompanying short-term Swenlin Trading Oscillators (STOs), along with IT...
READ MORE
MEMBERS ONLY

Market Rotation Fueled by Large-Cap Growth (Again)
by Julius de Kempenaer,
Senior Technical Analyst, StockCharts.com
KEY TAKEAWAYS
* Large-cap stocks are pushing the market higher.
* Large-cap growth is the only segment driving the market.
* AAPL, TSLA, NVDA, and AMD are having trouble pushing higher.
Following the recent market fluctuations, with a sharp decline and a subsequent rally, it's crucial to examine these movements'...
READ MORE
MEMBERS ONLY

Halloween Scare: The Stock Market Ends October on a Wicked Tone
by Jayanthi Gopalakrishnan,
Director of Site Content, StockCharts.com
KEY TAKEAWAYS
* Tepid earnings and negative news sends Tech stocks plunging.
* Economic data supports the narrative that the Fed will cut interest rates by 25 basis points in November.
* The long-term trend of the broader indexes are still bullish.
The Halloween effect caught up with the stock market! October 31...
READ MORE
MEMBERS ONLY

Will Breadth Divergences Signal the End of the Bull?
by David Keller,
President and Chief Strategist, Sierra Alpha Research
KEY TAKEAWAYS
* A negative McClellan Oscillator suggests short-term weakness in breadth conditions.
* About 30% of the S&P 500 members have already broken down below their 50-day moving average.
* The Bullish Percent Index has broken a key bearish threshold, indicating that many stocks have already begun bearish trends.
As...
READ MORE
MEMBERS ONLY

Homebuilding Rebound: How to Catch the Trend Early On
by Karl Montevirgen,
The StockCharts Insider
KEY TAKEAWAYS
* Homebuilders are getting ready for a potential comeback in 2025.
* Many homebuilder stocks are exhibiting tepid-to-poor technical strength.
* When the homebuilding industry flips to the upside, there are undervalued names that could offer early investment opportunities.
Homebuyers are still on the sidelines, waiting for better mortgage rates, while...
READ MORE
MEMBERS ONLY

The SCTR Report: Learn How to Scan and Identify Winning Stocks
by Jayanthi Gopalakrishnan,
Director of Site Content, StockCharts.com
KEY TAKEAWAYS
* Use the SCTR scan to help you find technically strong stocks.
* Filter scan results further using additional criteria such as trends and momentum indicators.
* Narrow your analysis further with additional criteria and add the most likely candidates to a watchlist.
When the stock market hesitates to move in...
READ MORE
MEMBERS ONLY

A Simple Candle With BIG Meaning
by Joe Rabil,
President, Rabil Stock Research
In this exclusive StockCharts video, Joe shows a specific candlestick pattern that, when it develops at the right time, can signal the start of a new upleg. He uses NVDA, MSFT and GLD to explain how this can setup at different times and can give a timely signal to look...
READ MORE
MEMBERS ONLY

Cruise Or Soar? Carnival, Delta, and United Hit New Highs—Which One's Your Best Bet?
by Karl Montevirgen,
The StockCharts Insider
KEY TAKEAWAYS
* Carnival Corp occupies the top spot for new highs across different timeframes.
* Delta Air Lines and United Airlines, two other transportation companies, have also gained new highs.
* Compare Carnival Corp, Delta, and United stock price action and determine which might present a strong opportunity in the coming weeks....
READ MORE
MEMBERS ONLY
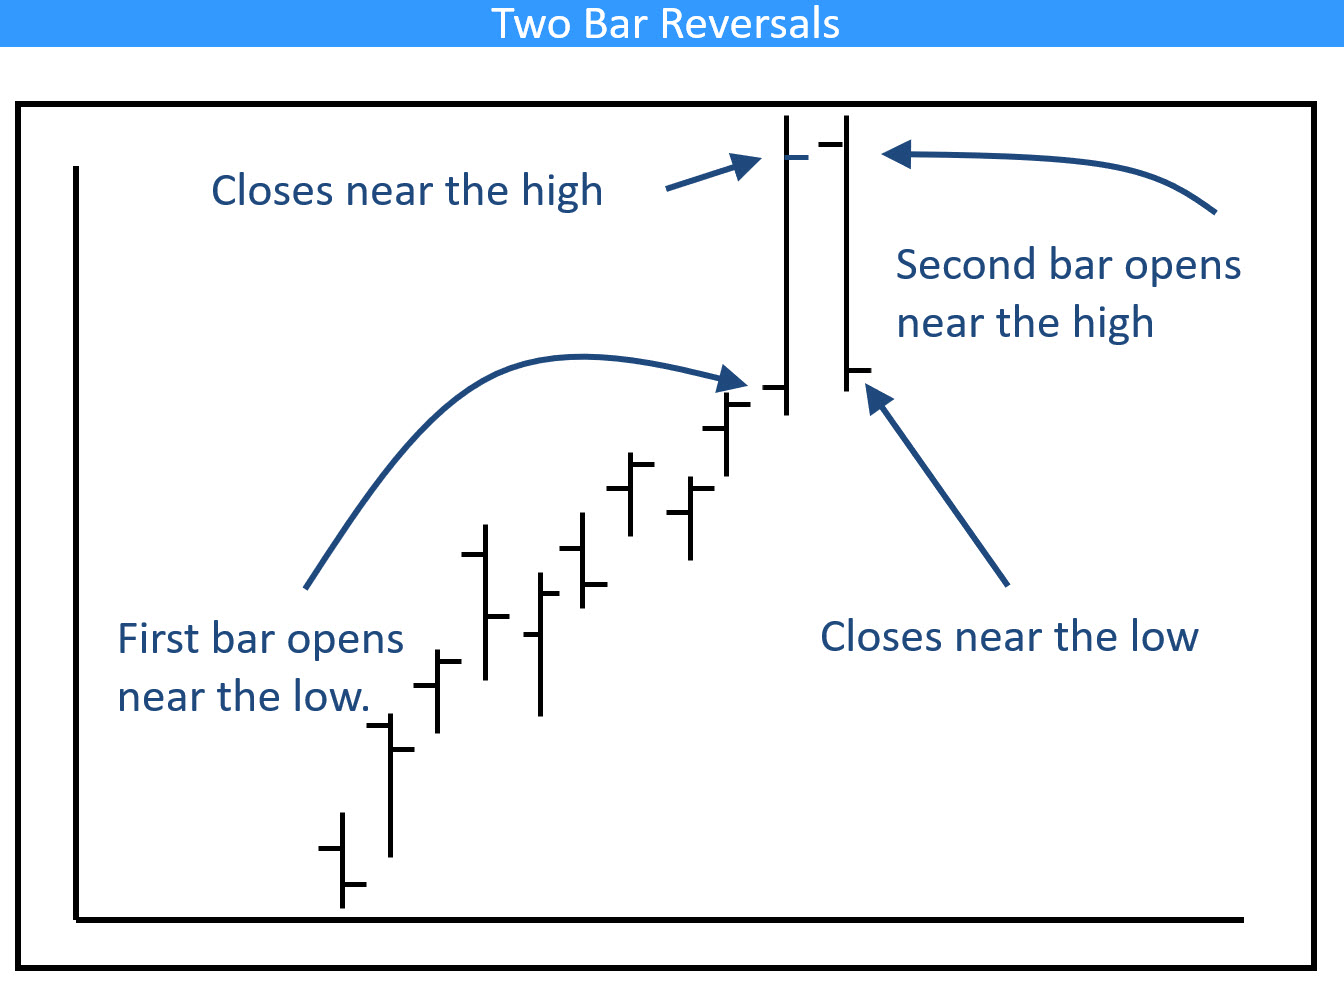
Four Sectors That Have Just Experienced Bearish Weekly Action
by Martin Pring,
President, Pring Research
Most weekends, I flip through a chartlist featuring weekly bars and candles for sectors, country ETFs, currencies, bonds and some commodities. The idea is to see whether any of these entities are showing signs of bullish or bearish reversals. Most of the time, this fishing exercise does not uncover a...
READ MORE
MEMBERS ONLY
Top 5 Breadth Indicators You Can't Afford to Ignore!
by David Keller,
President and Chief Strategist, Sierra Alpha Research
In this video, Dave digs into five market breadth indicators every investor should track as we navigate a volatile period including Q3 earnings, the US elections, and the November Fed meeting. He breaks down key insights on each of the five charts, talks about why breadth indicators are equal-weighted, and...
READ MORE
MEMBERS ONLY
DP Trading Room: Magnificent Seven Earnings Preview
by Erin Swenlin,
Vice President, DecisionPoint.com
As part of today's coverage of the Magnificent Seven we remind you when the big mega-caps are reporting and give you are current perspective of each. We also cover all of the Magnificent Seven in the short and intermediate terms with daily and weekly charts.
Carl gives us...
READ MORE
MEMBERS ONLY

Secular Shenanigans

by Bruce Fraser,
Industry-leading "Wyckoffian"
The secular bull market in stocks has been epic both in duration and extent. The NASDAQ 100 Index illustrates this bull run best of all. Using Wyckoff Method classic trendline construction techniques, the chart below illuminates this secular bull phenomena. The stride of the bull market run is set with...
READ MORE
MEMBERS ONLY

Two Indicators to Improve Your Edge
by Arthur Hill,
Chief Technical Strategist, TrendInvestorPro.com
KEY TAKEAWAYS
* Trend and momentum are proven concepts we can use to improve our edge.
* Longer timeframes are better for trend-momentum
* CandleGlance charts make it easy to rank and sort for momentum.
There are no magic bullets, but we can improve our trading edge by starting our selection process with...
READ MORE