MEMBERS ONLY

ELLIOTT WAVE ANALYSIS SUGGESTS THAT STOCKS HAVE BEEN IN A WAVE FOUR CORRECTION -- SINCE BULL MARKETS USUALLY HAVE FIVE WAVES, THAT MEANS THERE'S ANOTHER UPWAVE TO COME -- BOTH VERSIONS OF NYSE ADVANCE-DECLINE LINE LOOK STRONG

by John Murphy,
Chief Technical Analyst, StockCharts.com
STOCKS ARE ENDING WAVE FOUR CORRECTION... I find Elliott Wave Analysis very helpful in keeping the stock market's trend in proper perspective. I'm revisiting the subject here because I believe it may explain what's happening in global stocks. Here's a brief explanation....
READ MORE
MEMBERS ONLY
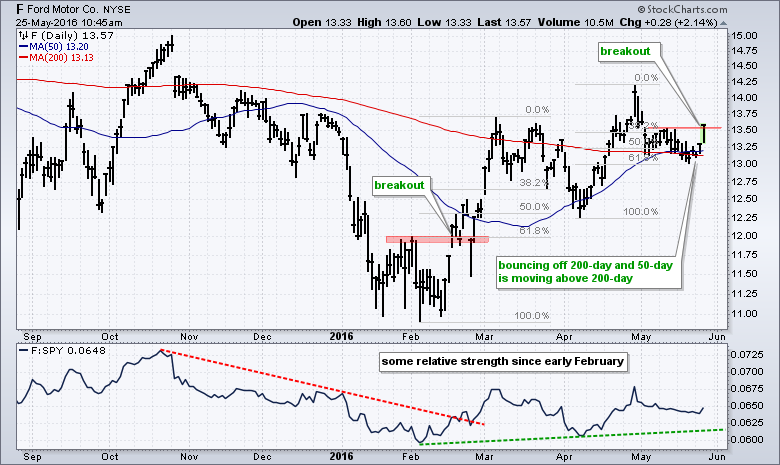
Two Steps Forward and One Step Backward for Ford

by Arthur Hill,
Chief Technical Strategist, TrendInvestorPro.com
Ford is making a big statement today with a successful test of the 200-day moving average and a break above the mid May high. The chart shows Ford (F) surging in February for its first breakout at 12. After exceeding 13.50, the stock retraced 50-62% with a pullback to...
READ MORE
MEMBERS ONLY
Semiconductors Close At 2016 High; Technology Leads Big Rally

by Tom Bowley,
Chief Market Strategist, EarningsBeats.com
Market Recap for Tuesday, May 24, 2016
Tuesday was one of the best days of 2016. Technically, the jump in our major indices was large with the Russell 2000 and NASDAQ leading the charge with gains of 2.15% and 2.00%, respectively. Our four aggressive sectors performed extremely well...
READ MORE
MEMBERS ONLY
NDX Brushes Off Long-Term SELL Signal and Triggers New Short-Term BUY Signal

by Erin Swenlin,
Vice President, DecisionPoint.com
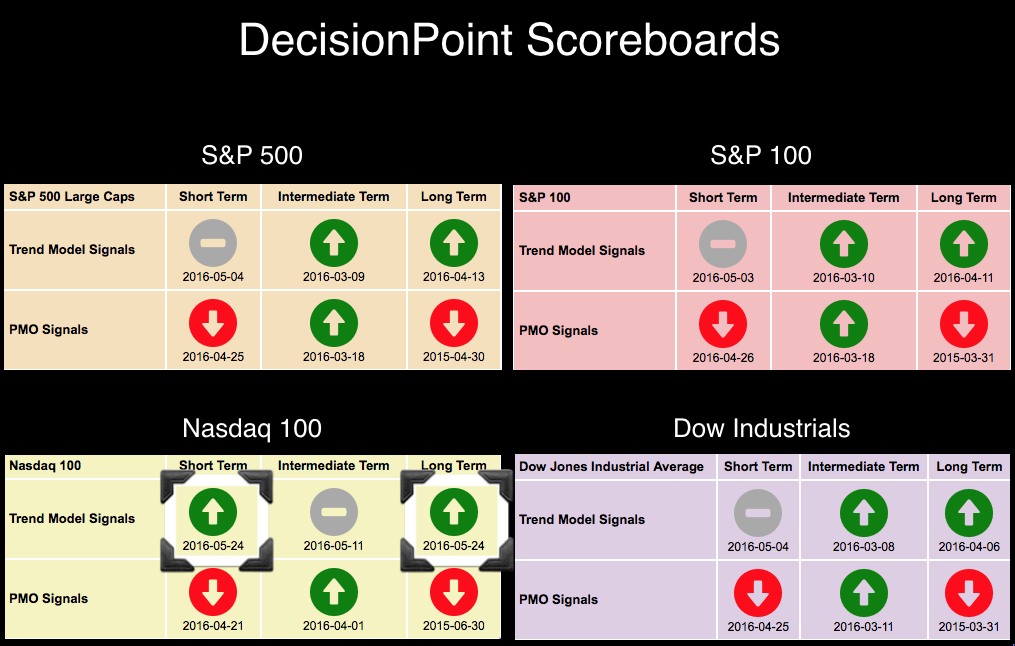
The Nasdaq 100 (NDX) has been very weak in comparison to most of the large cap indexes; however, it was reinvigorated with today's rally. You'll note on the DecisionPoint Scoreboard Summary below a highlight of the new BUY signals for the NDX. One important point to...
READ MORE
MEMBERS ONLY

STRONG HOUSING DATA GIVES HOMEBUILDERS AND STOCKS A BIG LIFT -- BANKS HELP LEAD FINANCIALS TO ANOTHER STRONG DAY -- TECHNOLOGY SPDR TURNS UP AS SEMICONDUCTORS NEAR UPSIDE BREAKOUT -- NASDAQ INDEXES CLEAR MOVING AVERAGE LINES
by John Murphy,
Chief Technical Analyst, StockCharts.com
HOME CONSTRUCTION ISHARES CLEAR MOVING AVERAGES ... April new home sales surged to the highest level since 2008. That followed on the heels of last week's report of strong existing home sales. The prospect of newer homes being built is good for homebuilders, the economy, and the stock market....
READ MORE
MEMBERS ONLY
U.S. Stocks End Flat On Monday, Eye Housing Data
by Tom Bowley,
Chief Market Strategist, EarningsBeats.com
Market Recap for Monday, May 23, 2016
Despite seven of nine sectors finishing lower, the major U.S. indices managed to close near the flat line due to strength in basic materials (XLB, +1.17%). Consumer staples (XLP, +0.10%) was the only other sector in positive territory at the...
READ MORE
MEMBERS ONLY
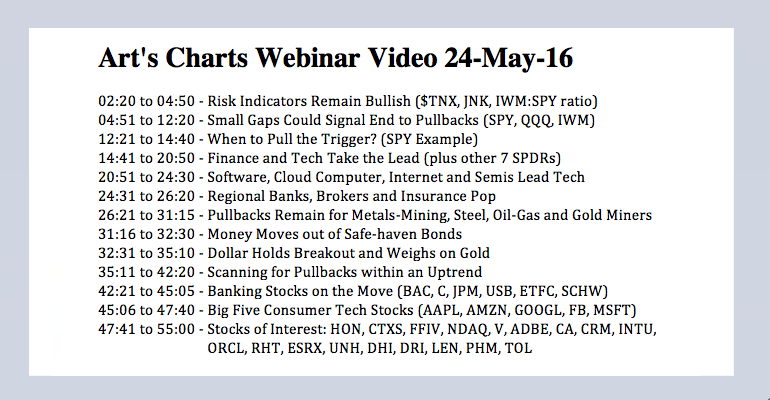
Small Gaps Could End Pullbacks - When to Pull the Trigger? - Scanning for Pullbacks within an Uptrend - Webinar Video
by Arthur Hill,
Chief Technical Strategist, TrendInvestorPro.com
ÂÂ
Small Gaps Could Signal End to Pullbacks // When to Pull the Trigger? // Money Moves out of Safe-haven Bonds // Finance Remains in the Spotlight // Regional Banks Take the Lead // Webinar Preview //// ...........
Small Gaps Could Signal End to Pullbacks
The short-term trends remain down, but I am seeing signs that these...
READ MORE
MEMBERS ONLY

The Balance of Technical Evidence At The Short-end Is Now Pointing Towards Higher Rates

by Martin Pring,
President, Pring Research
* A tale of two possible market scenarios
* Are we there yet?
* Watch those techies
* The charts support a higher interest rate scenario
A tale of two possible market scenarios
I have been calling for a US equity market correction for the last few weeks because an overbought condition in several...
READ MORE
MEMBERS ONLY
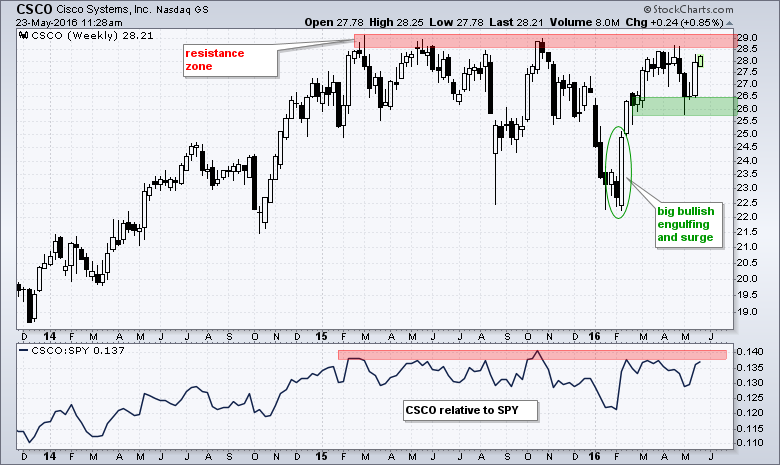
The Next Big Tech Stock to Watch for a New High
by Arthur Hill,
Chief Technical Strategist, TrendInvestorPro.com
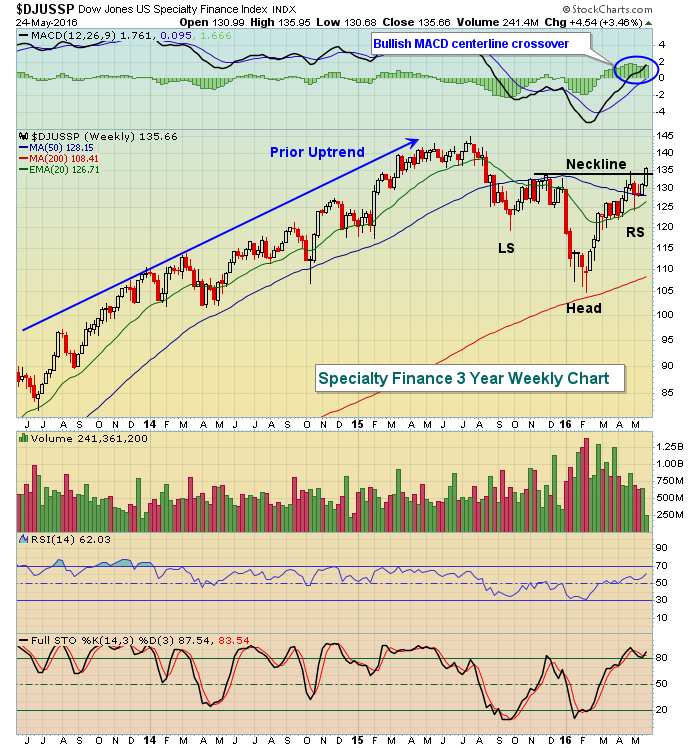
Stocks hitting 52-week highs are in clear uptrends and they are the market leaders. I am not going to feature a stock hitting a new high today, but rather look at one that has a good chance of hitting a new high in the coming weeks. The weekly chart below...
READ MORE
MEMBERS ONLY
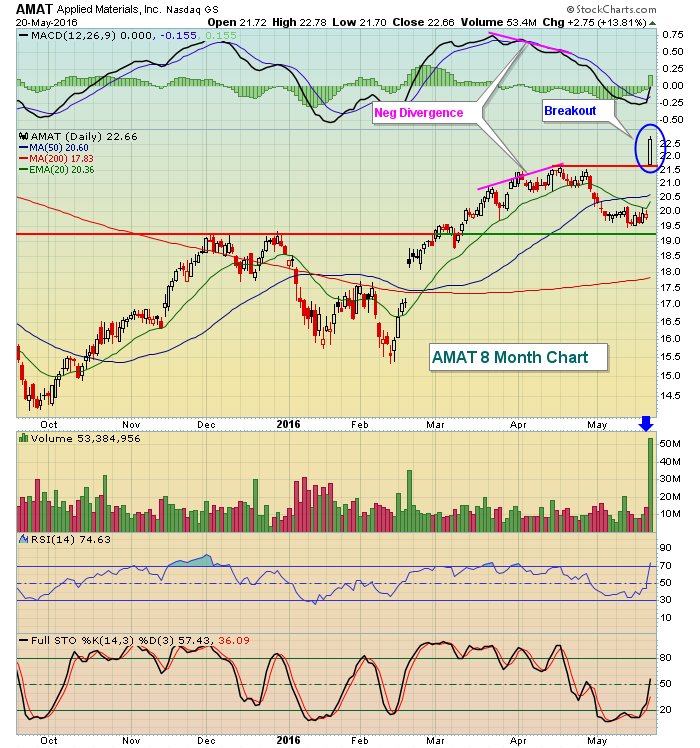
Technology Leads Market As Applied Materials Buoys Semiconductors
by Tom Bowley,
Chief Market Strategist, EarningsBeats.com
Market Recap for Friday, May 20, 2016
Applied Materials (AMAT) posted excellent quarterly earnings results on Thursday after the closing bell and that lifted semiconductors ($DJUSSC, +3.0%) on Friday. Technology (XLK, +1.21%) in general performed exceptionally well, leading all sectors. AMAT cleared short-term price resistance at the opening...
READ MORE
MEMBERS ONLY
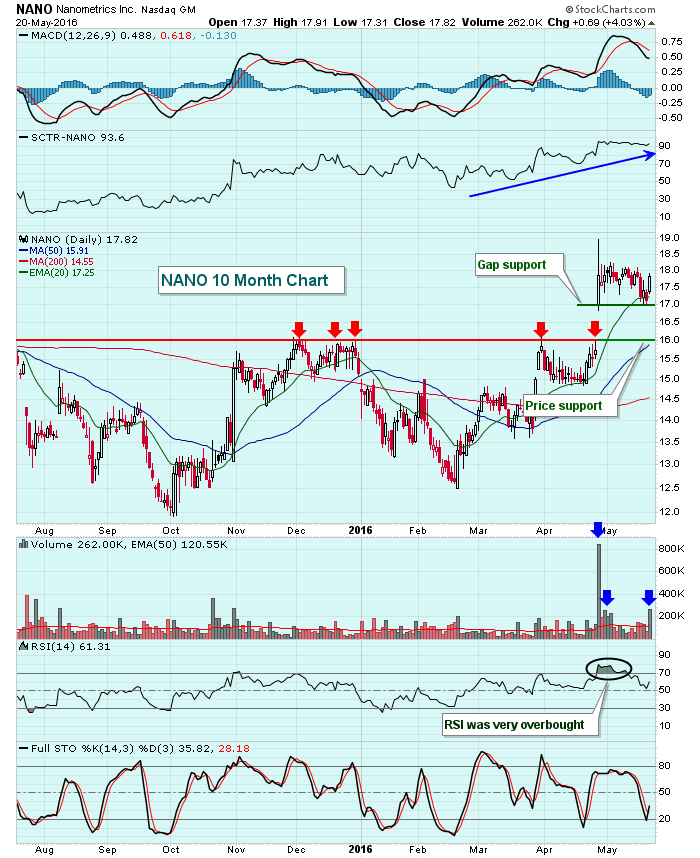
This Small Semiconductor Stock Has A Big Chart
by Tom Bowley,
Chief Market Strategist, EarningsBeats.com
A little more than three weeks ago, a very small $435 million semiconductor company reported quarterly EPS that nearly tripled Wall Street consensus estimates. Quarterly revenues also beat estimates by roughly 3%. That combination sent Nanometrics (NANO) soaring on April 27th, at one point up 20% on the session. NANO...
READ MORE
MEMBERS ONLY
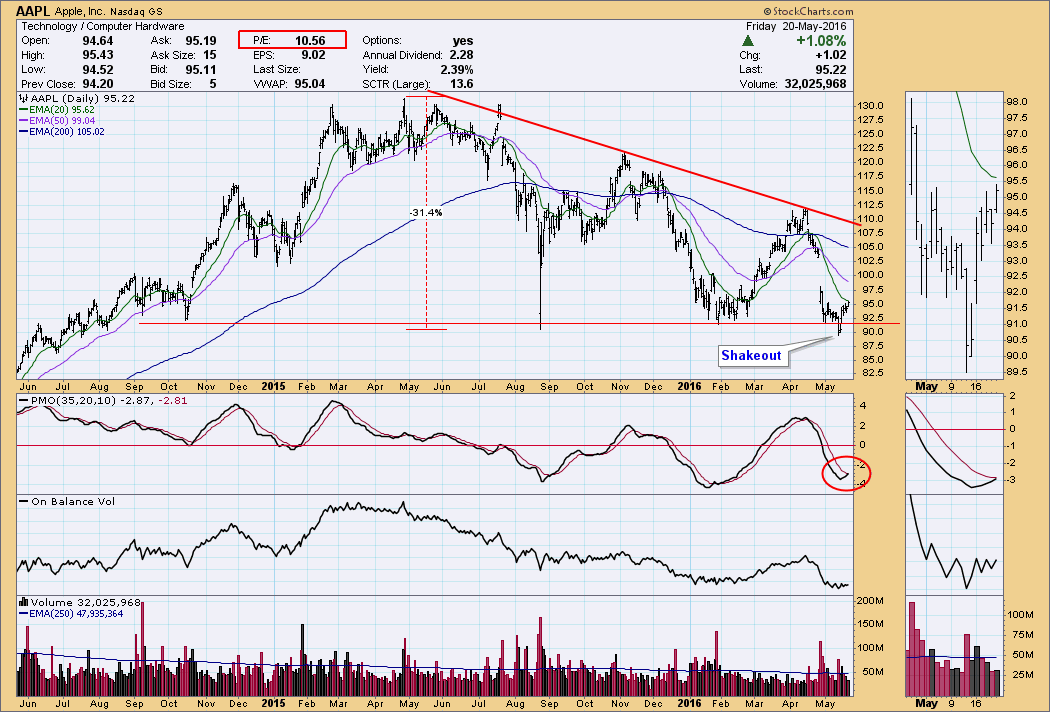
AAPL: Possible Bottom

by Carl Swenlin,
President and Founder, DecisionPoint.com
I don't spend much time with TV business news channels, but I do use them as company when I'm getting up in the morning. Several days ago there was a headline that Apple (AAPL) was down -14% this year, providing a perfect example of how business...
READ MORE
MEMBERS ONLY
Four Things All StockCharts Users Need to Know
Hello Fellow ChartWatchers!
Short Version: The Dow continues moving lower. The upcoming death of Flash means everyone is getting the new version of ChartNotes. You really need to sign up for ChartCon 2016 soon. We have 10 once-in-a-lifetime seats available if you want to see ChartCon 2016 in person.
1....
READ MORE
MEMBERS ONLY
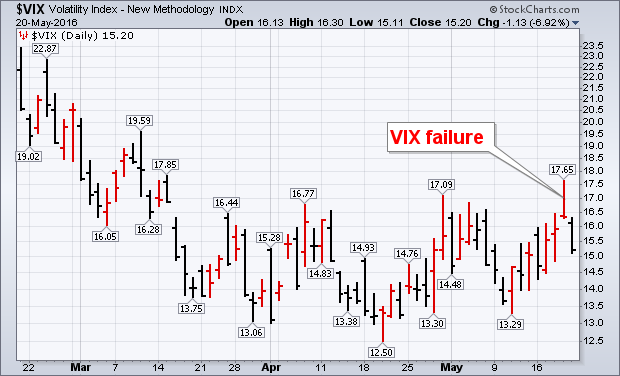
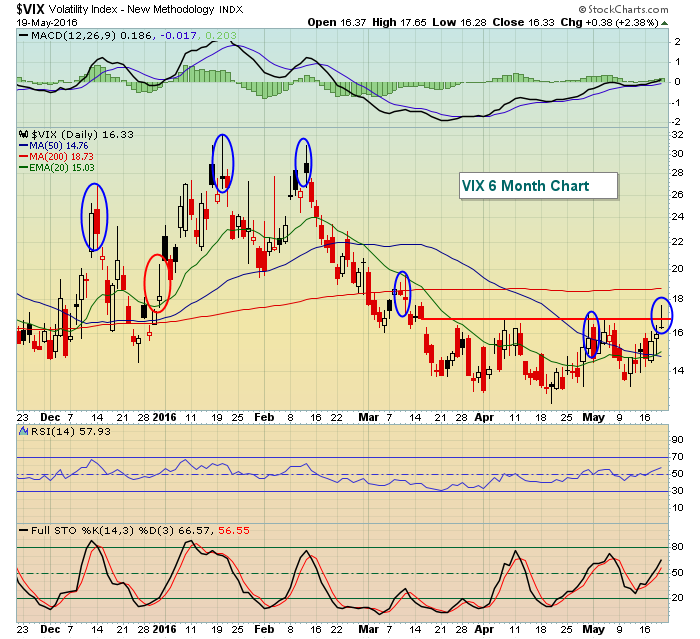
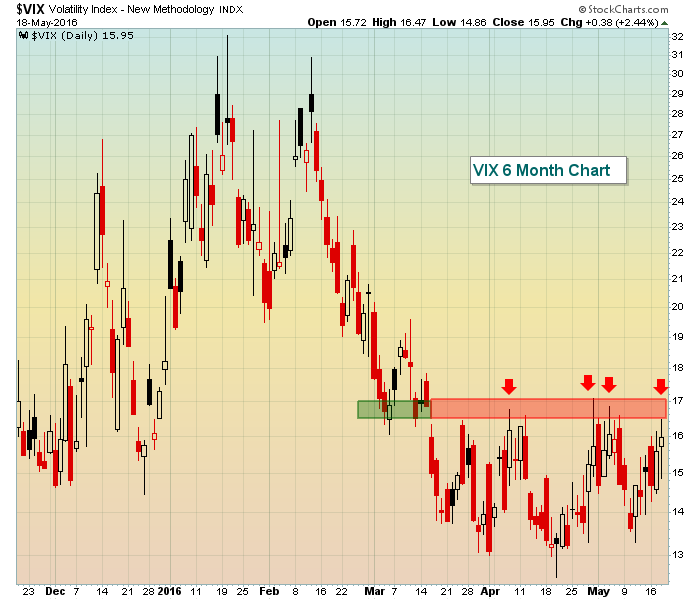
VIX Fails Breakout Attempt, NASDAQ May Be Turning Higher
by John Murphy,
Chief Technical Analyst, StockCharts.com
My Thursday morning message showed the Volatility Index (VIX) trying to break through resistance near 17. It rose as high as 17.65 intra-day which was the highest level in two months. Fortunately, it wasn't able to close there. The good news is that the VIX closed at...
READ MORE
MEMBERS ONLY
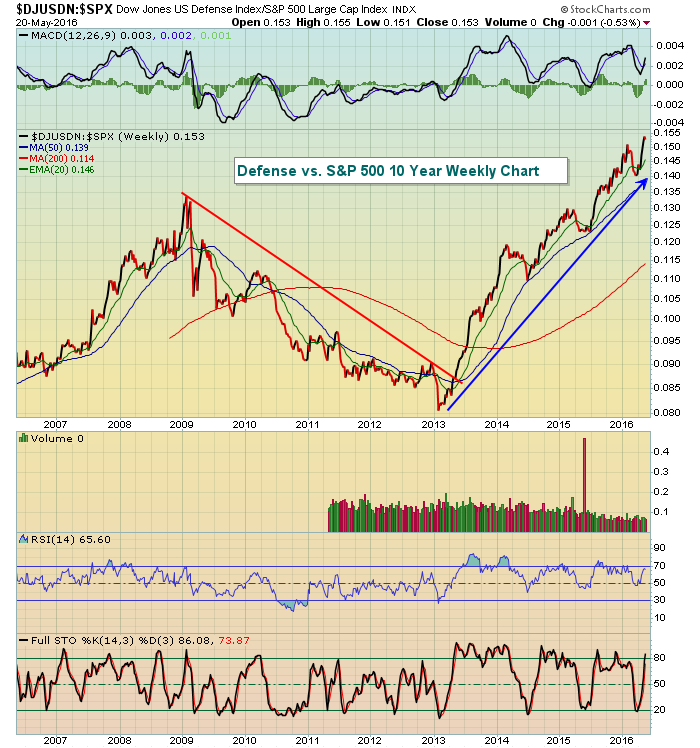
Defense Stocks Remain A Must Own
by Tom Bowley,
Chief Market Strategist, EarningsBeats.com
The Dow Jones U.S. Defense Index has been annihilating its competition for the past few years. It's very clear if you take a look at a longer-term relative performance chart. Check this out:
This is an interesting chart. During the bear market from 2007 to 2009, defense...
READ MORE
MEMBERS ONLY
Trading Tune Up Part Two

by John Hopkins,
President and Co-founder, EarningsBeats.com
In my last ChartWatchers article I pointed to the importance of taking a time out now and then to analyze trading habits. I referred to it as a "Trading Tune Up".
The article served as a reminder to me that you need to be on your toes at...
READ MORE
MEMBERS ONLY
Investing with the Trend

by Greg Morris,
Veteran Technical Analyst, Investor, and Author
Warning! This is a sales pitch for my latest and last book, Investing with the Trend. Instead of hearing from me, I have included a few actual reviews from readers. I basically tell people that I dumped 40+ years of experience in this book. There are many things in this...
READ MORE
MEMBERS ONLY

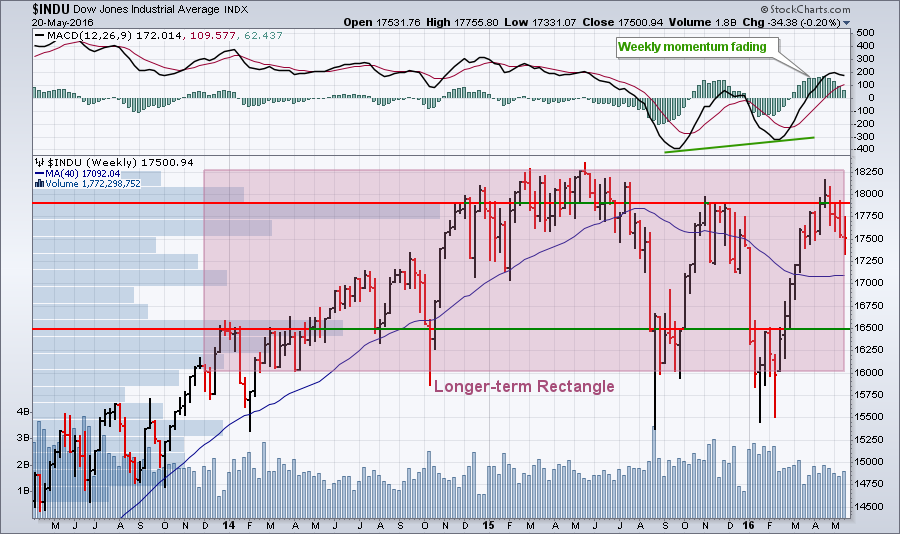
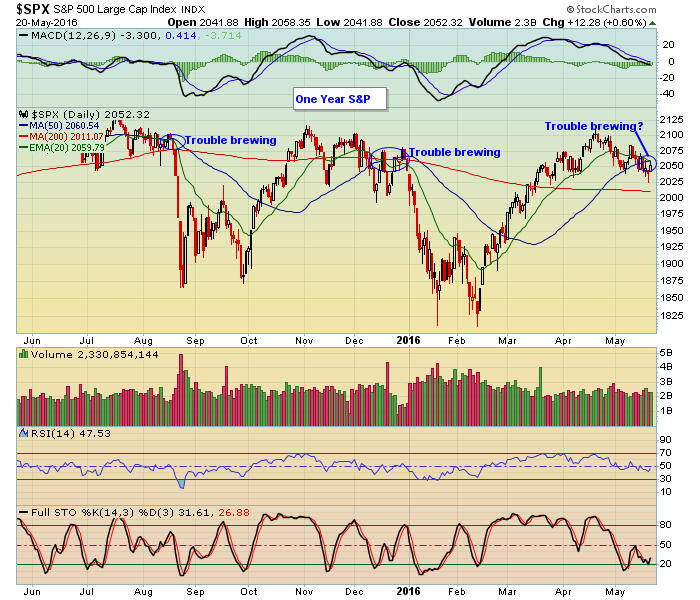
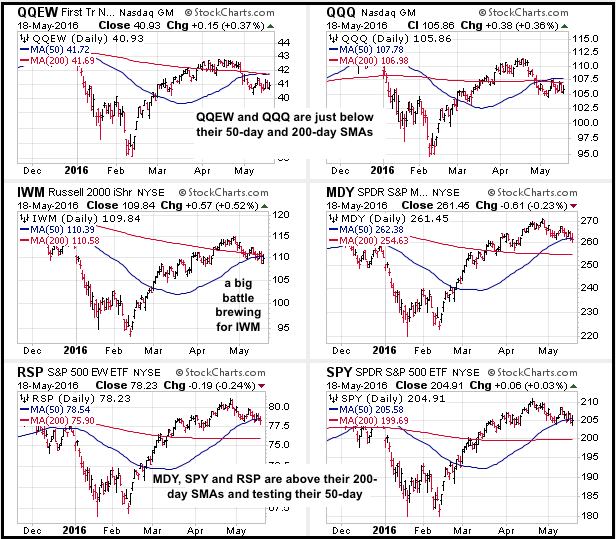
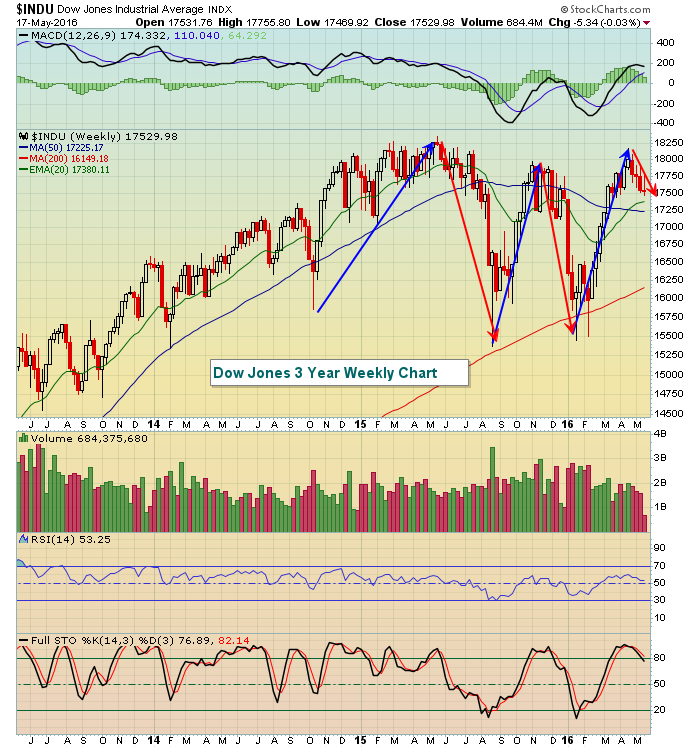
DOW AND S&P 500 REMAIN IN SIDEWAYS PATTERN AFTER PASSING ONE-YEAR ANNIVERSARY OF MAY 2015 TOP -- BOTH ARE IN SHORT-TERM PULLBACKS BUT REMAIN ABOVE THEIR 200-DAY LINES -- NASDAQ UNDERPERFORMANCE MAY BE ABOUT TO TAKE A TURN FOR THE BETTER
by John Murphy,
Chief Technical Analyst, StockCharts.com
VIX FAILS BREAKOUT ATTEMPT... My Thursday morning message showed the Volatility Index (VIX) trying to break through resistance near 17. It rose as high as 17.65 intra-day which was the highest level in two months. Fortunately, it wasn't able to close there. The good news is that...
READ MORE
MEMBERS ONLY
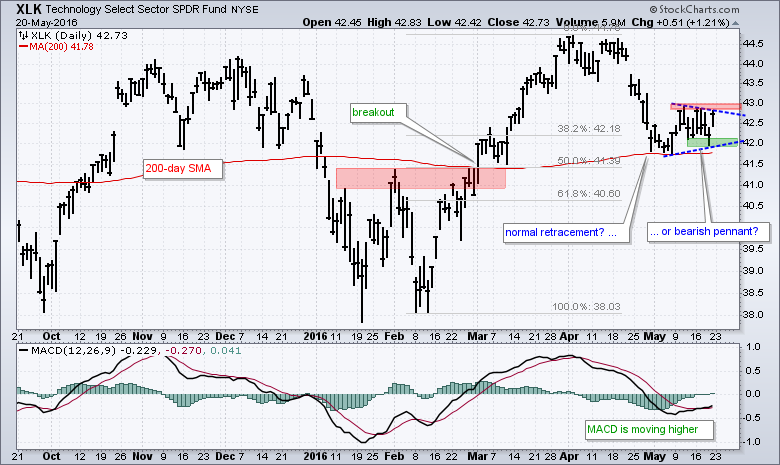
XLK Shows Signs of Life as Key Moving Average Holds
by Arthur Hill,
Chief Technical Strategist, TrendInvestorPro.com
It has been a wild ride for the Technology SPDR (XLK) since August, but the ETF is showing signs of strength by holding the 200-day moving average in May. The red line shows the 200-day SMA dissecting the chart in the 41.5-42 area. Note that XLK broke above this...
READ MORE
MEMBERS ONLY
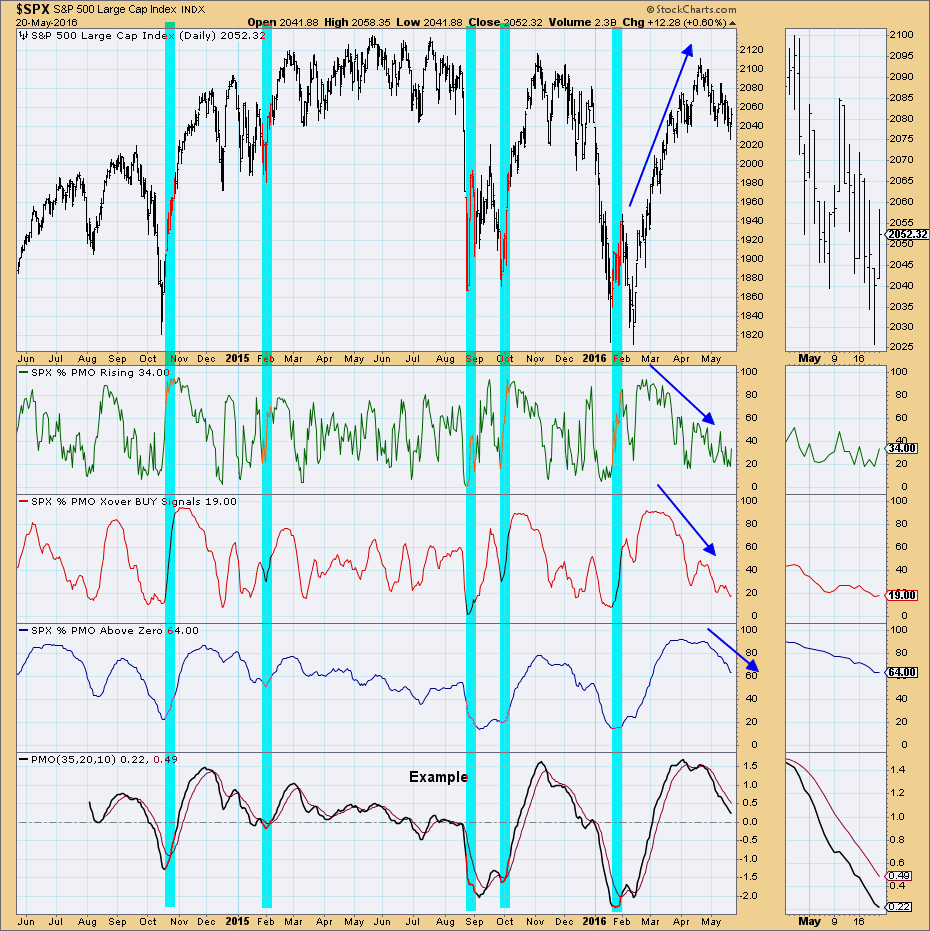
PMO Analysis - SPX Not Ready to Bottom, But NDX Is?
by Erin Swenlin,
Vice President, DecisionPoint.com
During today's webinar, my "Bonus Indicator Chart" was the Price Momentum Oscillator (PMO) Analysis chart for the SPX. It reveals that it doesn't have the internal strength necessary (yet) to rally out of the current declining trend. The NDX is beginning to show signs...
READ MORE
MEMBERS ONLY

Stalking the "Best of Breed" Equities

by Gatis Roze,
Author, "Tensile Trading"
The same investment analysis seldom yields consistent conclusions over a period of time. As much as investors would like to believe they are predictably consistent in their analysis, I’d be willing to wager that this is seldom the case.
This is especially true if you are stalking similar equities,...
READ MORE
MEMBERS ONLY
Volatility Contracts on Pullback - QQQ Stalls - Treasury Yields can Effect other Assets - Dollar Gets Breakout
by Arthur Hill,
Chief Technical Strategist, TrendInvestorPro.com
Volatility Contracts on SPY Chart // QQQ Extends its Stall // April Gaps Remain for AAPL, GOOGL and MSFT // A Reasonable Pullback for IWM // Index and Sector Table Update // Industrials and Finance Hold the Key // How Treasury Yields affect other Assets // 7-10 YR T-Bond ETF Puts Breakout on Hold // Dollar Gets a...
READ MORE
MEMBERS ONLY
Defensive Stocks Fuel Bounce Off Key Price Support
by Tom Bowley,
Chief Market Strategist, EarningsBeats.com
Market Recap for Thursday, May 19, 2016
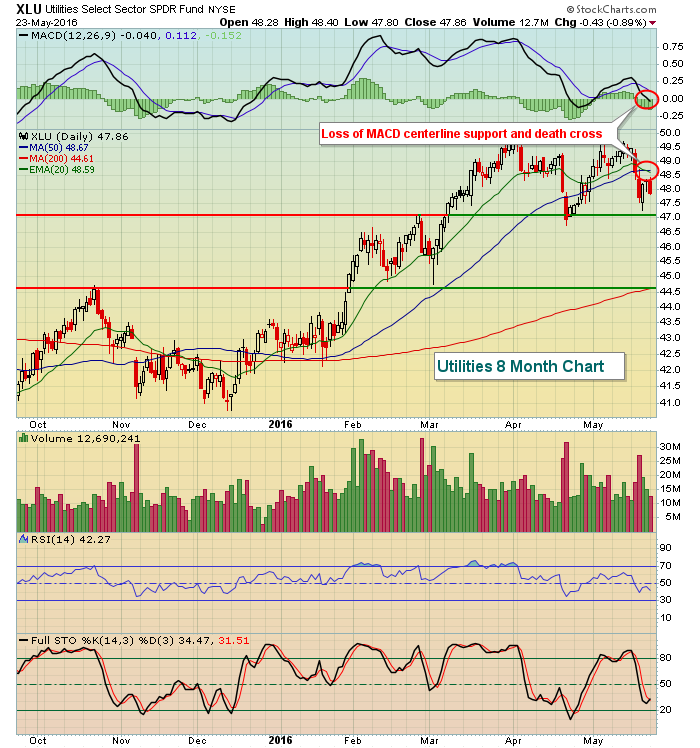
Utilities (XLU, +1.01%) and consumer staples (XLP, +0.98%), two defensive sectors, easily outdistanced all of the other sectors with respect to Thursday performance. So while the save of price support across all of our major indices was nice, keep in mind...
READ MORE
MEMBERS ONLY

Wyckoff Group Think

by Bruce Fraser,
Industry-leading "Wyckoffian"
Finding the best emerging stock ideas can seem like finding a needle in a haystack. The goal is to organize your market analysis in such a way that you can drill down into the market structure and find leadership quickly and efficiently. There are many good ways to survey the...
READ MORE
MEMBERS ONLY
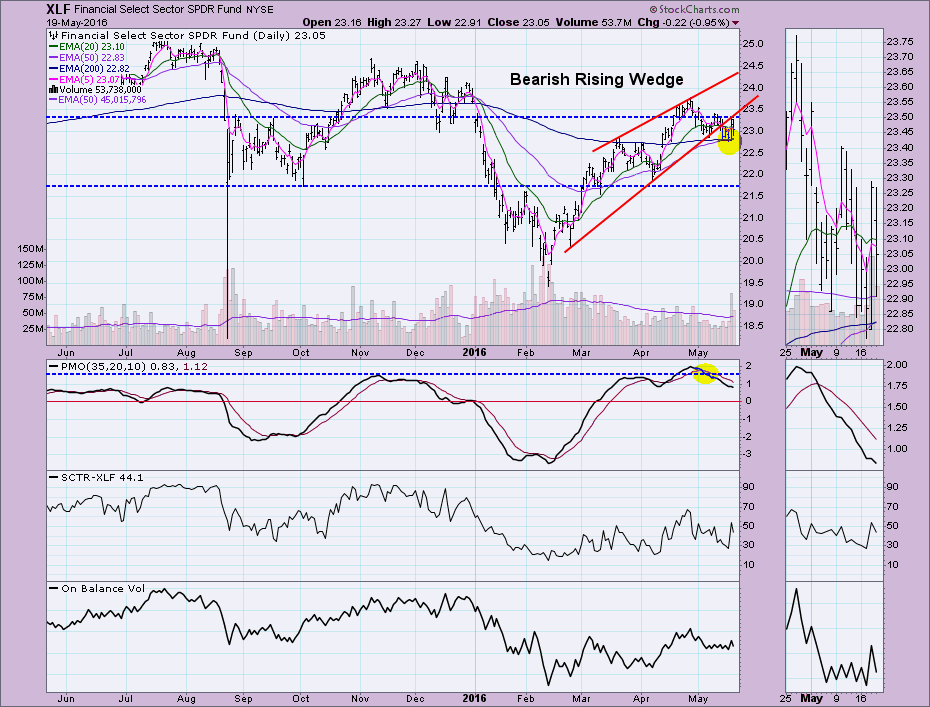
Financial SPDR (XLF) Garners a Long-Term Trend Model BUY Signal
by Erin Swenlin,
Vice President, DecisionPoint.com
What, what? A new Long-Term Trend Model (LTTM) BUY signal for XLF? Indeed. Yet, how bullish is the Financial sector in the short, medium and long terms? After reviewing the daily, weekly and monthly charts, the conclusion is that the Financial sector may not be as robust as this signal...
READ MORE
MEMBERS ONLY
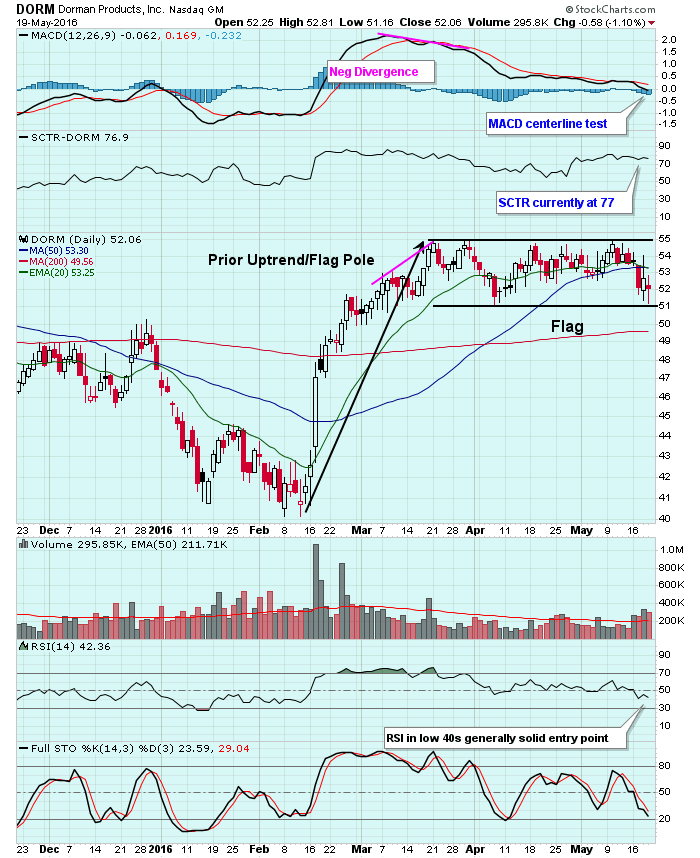
Dorman Bounces Off Flag Support
by Tom Bowley,
Chief Market Strategist, EarningsBeats.com
Dorman Products (DORM) touched price support near 51.00, which is technically significant as DORM has been trading in a continuation pattern for the past several weeks and 51.00 has marked flag support. There was a prior uptrend (flag pole) in play off the February low and DORM longs...
READ MORE
MEMBERS ONLY

VIX NEARS UPSIDE BREAKOUT -- SHORT TERM MARKET CORRECTION CONTINUES AS DOW AND S&P 500 HEAD TOWARD 200-DAY AVERAGES -- RISING DOLLAR WEAKENS COMMODITIES AND MULTINATIONALS -- STOCKS COULD PULL BACK TOWARD MIDDLE OF YEARLONG TRADING RANGE
by John Murphy,
Chief Technical Analyst, StockCharts.com
VIX MAY BE TURNING UP ... Chart 1 shows the Volatility (VIX) Index trying to clear 17 for the first time since early March. A rising VIX is usually associated with lower stock prices. Chart 2 shows a point & figure version of the VIX and shows a similar picture. After...
READ MORE
MEMBERS ONLY
Fed Minutes Suggest Possible Rate Hike, Banks Bounce Off Support
by Tom Bowley,
Chief Market Strategist, EarningsBeats.com
Market Recap for Wednesday, May 18, 2016
It was an interesting day on Wall Street on Wednesday. Once the FOMC minutes were released at 2pm EST, traders panicked as the Fed signaled the possibility of a June interest rate hike. They said what they've been saying, that a...
READ MORE
MEMBERS ONLY
Small-caps Gear up for Big Test - Using %B for Setups - Treasuries Signal Risk On
by Arthur Hill,
Chief Technical Strategist, TrendInvestorPro.com
Small-caps Gear Up for Big Test // Using %B to Identify Oversold Conditions // Indicators Overshoot for QQQ // IWM Remains with a Bullish Setup // Intraday or End-of-day Signals? // Treasuries Signal Risk On // XLF Surges as KRE and IAI Break Out //// ...........
Small-caps Gear Up for Big Test
Today I will show QQQ, SPY...
READ MORE
MEMBERS ONLY

Is The Recent Superior Performance Of Oil Over Equities Sustainable?
by Martin Pring,
President, Pring Research
* The big picture for oil prices
* Oil versus stocks
* Commodities versus bonds-the ultimate inflation/deflation relationship
* Clean-tech starting to turn around
This morning ‘s MarketWatch had a story featuring a recent Goldman Sachs report favoring oil over equities. They also had another, right next to it, saying to the effect...
READ MORE
MEMBERS ONLY

RISING BOND YIELDS BOOST FINANCIALS -- FINANCIAL SPDR BOUNCES OFF 200-DAY LINE -- BANK LEADERS INCLUDE REGIONS FINANCIAL, SUNTRUST, AND JP MORGAN CHASE -- PRUDENTIAL AND UNUM ARE LIFE INSURANCE LEADERS -- E*TRADE AND SCHWAB LEAD INVESTMENT SERVICE GROUP
by John Murphy,
Chief Technical Analyst, StockCharts.com
BOND YIELDS JUMP... Chart 1 shows the 10-Year Treasury Yield ($TNX) bouncing strongly today. That's partially the result of stronger economic news this week combined with higher inflation. The Consumer Price Index (CPI) for April saw the biggest gain in three years. Most of that came from rising...
READ MORE
MEMBERS ONLY
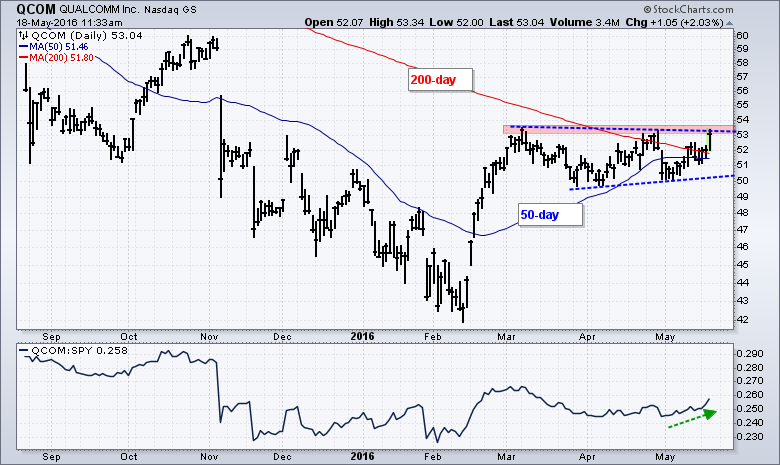
QualCom Battles Two Key Moving Averages
by Arthur Hill,
Chief Technical Strategist, TrendInvestorPro.com
QualCom has been going nowhere since early March, but a breakout may be in the making as the stock distances itself from two key moving averages. The chart shows QCOM with the 50-day and 200-day SMAs in the 51-52 area. The stock has bounced between 50 and 53 since early...
READ MORE
MEMBERS ONLY
Defensive Utilities And Consumer Staples Spearhead Tuesday's Selling
by Tom Bowley,
Chief Market Strategist, EarningsBeats.com
Market Recap for Tuesday, May 17, 2016
The wishy-washy, back and forth, yo-yo action continued on Tuesday as Monday's gains were completely erased by Tuesday's close. The culprits? Well, eight of the nine sectors finished lower after all nine rose on Monday, but the primary weakness...
READ MORE
MEMBERS ONLY

Intermediate-Term versus Short-Term Conditions
by Erin Swenlin,
Vice President, DecisionPoint.com
We haven't seen much change to the DecisionPoint Scoreboards and as they stand now (seen below), the intermediate term is clearly bullish versus the short term which is bearish.
One of the best ways to make a more detailed comparison by index and sector is to use the...
READ MORE
MEMBERS ONLY

AIRLINE SELLING HAS WEIGHED ON TRANSPORTS -- BUT THAT MAY BE IMPROVING -- DELTA AND UAL BOUNCE OFF FEBRUARY LOWS -- SOUTHWEST AIR SHOWS RELATIVE STRENGTH -- OIL SERVICE ETF BOUNCES OFF MOVING AVERAGES
by John Murphy,
Chief Technical Analyst, StockCharts.com
TRANSPORTS SHOW SHORT-TERM WEAKNESS... One of the market's short-term problems has been the recent downturn in transportation stocks. The daily bars in Chart 1 show the Dow Jones Transportation Average ($TRAN) slipping below its April low and trading under its moving average lines. So far, the decline has...
READ MORE
MEMBERS ONLY
Tech Offsets Finance - Correction Remains Mild - Watching Bonds for Risk - 2 Tech ETFs Showing Strength
by Arthur Hill,
Chief Technical Strategist, TrendInvestorPro.com
Mixed Up May as Tech offsets Finance // Mild Correction Extends for SPY // QQQ Reflects Strength in Tech // Watching Bonds for Clues on Risk Appetite // Adding an Exit Strategy to the PPO Signals // Watching Regional Banks, Semis and Homebuilders // Finance Sector Fails to Pop // SKYY and IGV Show Relative Strength //// ...........
Mixed...
READ MORE
MEMBERS ONLY
Critical Short-Term Support Holds As All Sectors Advance
by Tom Bowley,
Chief Market Strategist, EarningsBeats.com
Market Recap for Monday, May 16, 2016
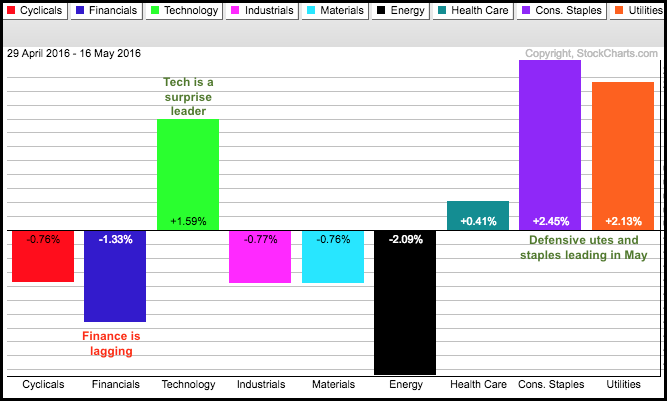
Monday saw a very solid advance across the board, but clearly was led once again by materials (XLB, +1.72%) and energy (XLE, +1.69%). These two sectors were not only the leaders yesterday, but they also represent the top two performing sectors...
READ MORE
MEMBERS ONLY
Semiconductor SPDR Bounces off Key Moving Average
by Arthur Hill,
Chief Technical Strategist, TrendInvestorPro.com
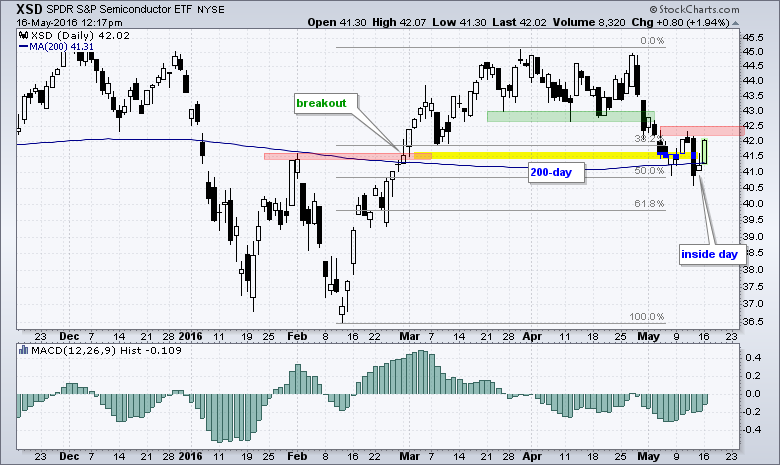
The Semiconductor SPDR (XSD) is one the leading industry-group ETFs at midday on Monday with a gain of around 2%. A look at the chart shows this big gain coming at a potential support or reversal zone. First, notice that XSD broke resistance with a big move in February. Broken...
READ MORE
MEMBERS ONLY
Major U.S. Indices All Lose 50 Day Moving Averages
by Tom Bowley,
Chief Market Strategist, EarningsBeats.com
Market Recap for Friday, May 13, 2016
I suppose it's only fitting that all of our major indices close beneath their 50 day SMAs simultaneously for the first time on Friday the 13th. The NASDAQ has been trading beneath its 50 day SMA for the past several trading...
READ MORE
MEMBERS ONLY
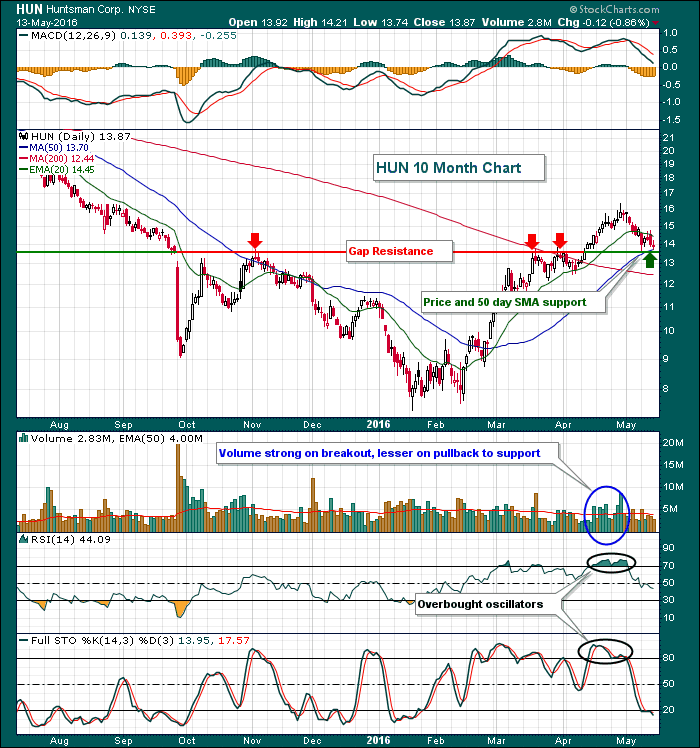
Huntsman (HUN) Pulls Back To Key Support Zone
by Tom Bowley,
Chief Market Strategist, EarningsBeats.com
Not many stocks have been spared the past few weeks as our major indices have trended lower. Huntsman Corp (HUN) doubled in a little more than two months, but became very overbought in late April. Since that time, HUN has fallen 15% and its overbought oscillators have seen relief with...
READ MORE
