MEMBERS ONLY

All Sectors Experiencing Short-term Momentum Sell Signals. Does This Mean The February Lows Will Be Taken Out?

by Martin Pring,
President, Pring Research
* Long-term picture still mixed
* Analyzing the Short-term Picture
* Global equities are still vulnerable
* Confidence looking questionable again
* Spot the bullish sector
Long-term picture still mixed
A couple of weeks ago I pointed out that several long-term indicators had tentatively turned bullish and that others were not far behind. The problem...
READ MORE
MEMBERS ONLY
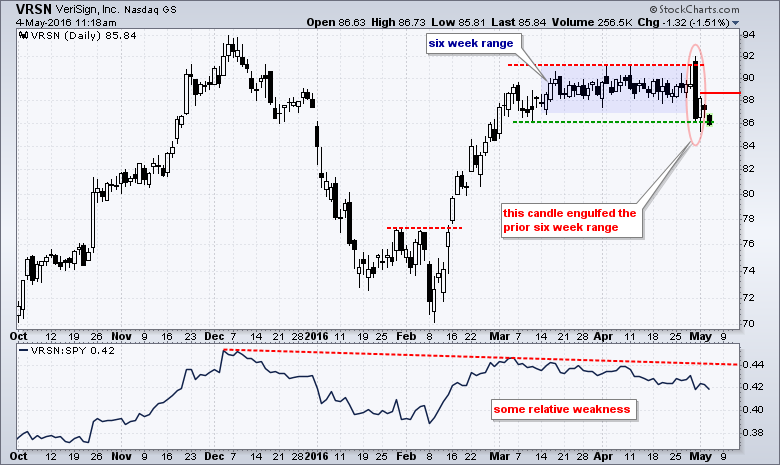
VeriSign Whiffs with a Big Bearish Engulfing

by Arthur Hill,
Chief Technical Strategist, TrendInvestorPro.com
There are bearish engulfing patterns and then there are BEARISH ENGULFING patterns. VeriSign formed the latter with one of the biggest I have seen in some time. The chart shows the bearish engulfing pattern opening above the April high and finishing near the early March low. The stock got a...
READ MORE
MEMBERS ONLY

Candlestick Analysis - Performance

by Greg Morris,
Veteran Technical Analyst, Investor, and Author
The following tables of data reflect the performance of 14 different technical indicators using the perceived popular parameters for each one (see Table A). However, each table uses a different setting for analyzing the candle patterns. The success or failure of a candle pattern is determined by the price relative...
READ MORE
MEMBERS ONLY
Gold Strengthening As Dollar Faces Major Test Of Support

by Tom Bowley,
Chief Market Strategist, EarningsBeats.com
Market Recap for Tuesday, May 3, 2016
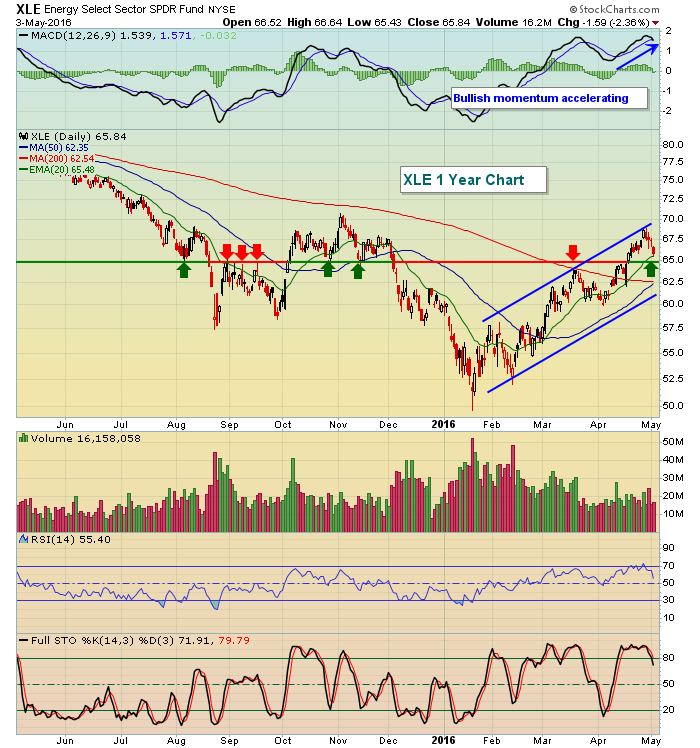
Energy (XLE) was hit hard on Tuesday as all nine sectors retreated. But the XLE's drop of 2.36% was notable as it nears a key short-term price support level and its rising 20 day EMA, both generally strong areas during...
READ MORE
MEMBERS ONLY

Percent Buy Index (PBI) - Excellent Compass in Volatile Times

by Erin Swenlin,
Vice President, DecisionPoint.com
I received an email from a reader "thanking" me for a lucrative trade that he based off of the Thrust/Trend Model. In actuality, it turned out he used the Percent Buy Index (PBI) negative crossover not the Thrust/Trend Model per se (see the series of articles...
READ MORE
MEMBERS ONLY
Current Point and Figure Counts

by Bruce Fraser,
Industry-leading "Wyckoffian"
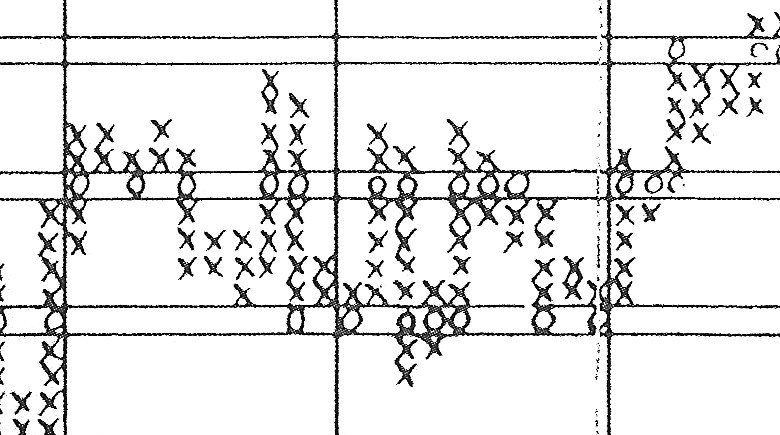
The concept of Cause and Effect is at work in markets constantly. This Wyckoff Law is codified and measured using Point and Figure charts. These charts are robust tools for measuring market potential or cause that has been built and then expended. Let’s take a survey of the current...
READ MORE
MEMBERS ONLY

GLOBAL STOCKS SLIDE AS MONEY MOVES INTO TREASURIES -- STAPLES AND UTILITIES SHOW RELATIVE STRENGTH -- CLOROX AND CVS ARE STAPLE LEADERS -- PFIZER HAS A STRONG DAY -- BANK INDEX PULLS BACK FROM 200-DAY AVERAGE

by John Murphy,
Chief Technical Analyst, StockCharts.com
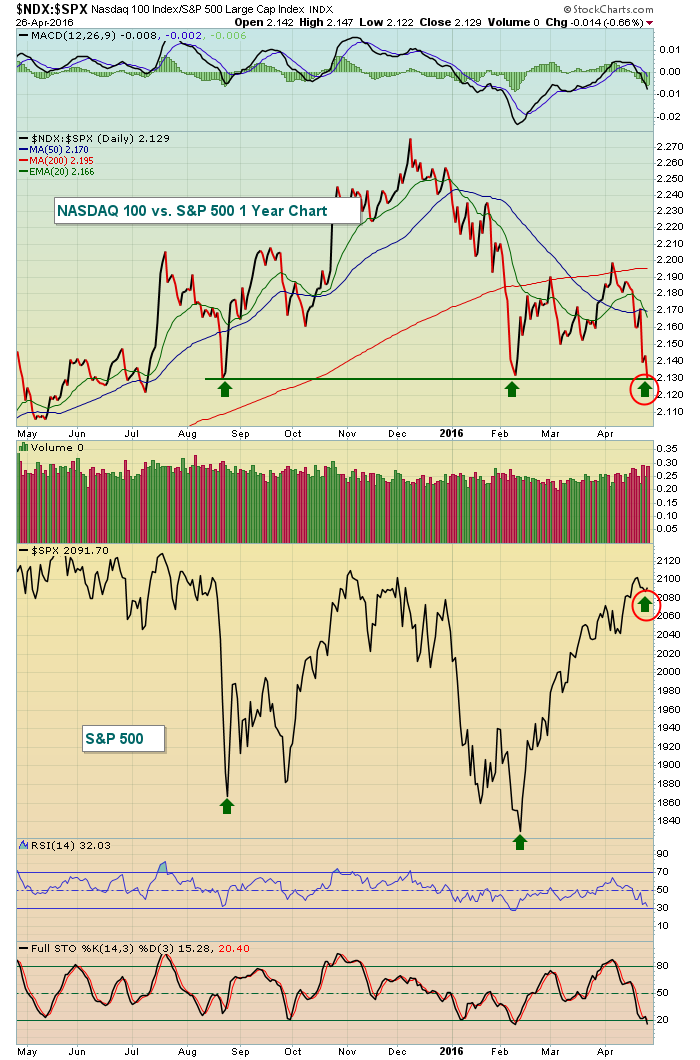
SHORT-TERM STOCK PULLBACK DEEPENS... Global stocks are continuing the pullback that started last week. Chart 1 shows the S&P 500 heading down toward a test of its early April low and/or its moving average lines. The 14-day RSI line (top of chart) has slipped below the 50...
READ MORE
MEMBERS ONLY
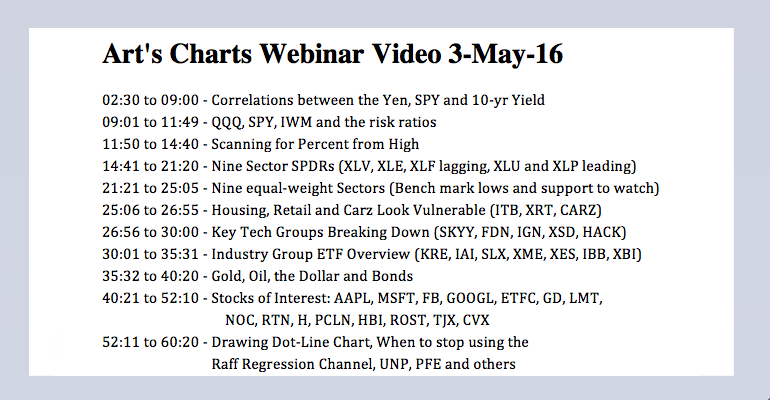
Techs Continue to Weigh - Utilities are Actually Leading - Materials are Most Extended - Webinar Video
by Arthur Hill,
Chief Technical Strategist, TrendInvestorPro.com
SPDRs versus Equal-weight Sectors // Three Long-term Sector Laggards // Two Long-term Sector Leaders // Technology and Consumer Discretionary Weigh // Marking Key Support for Finance, Industrials and Healthcare // Staples and Utilities Still Leading on Price Charts // Materials is Most Extended // Webinar Preview //// .......
SPDRs versus Equal-weight Sectors
The sector SPDRs represent large-caps stocks with...
READ MORE
MEMBERS ONLY
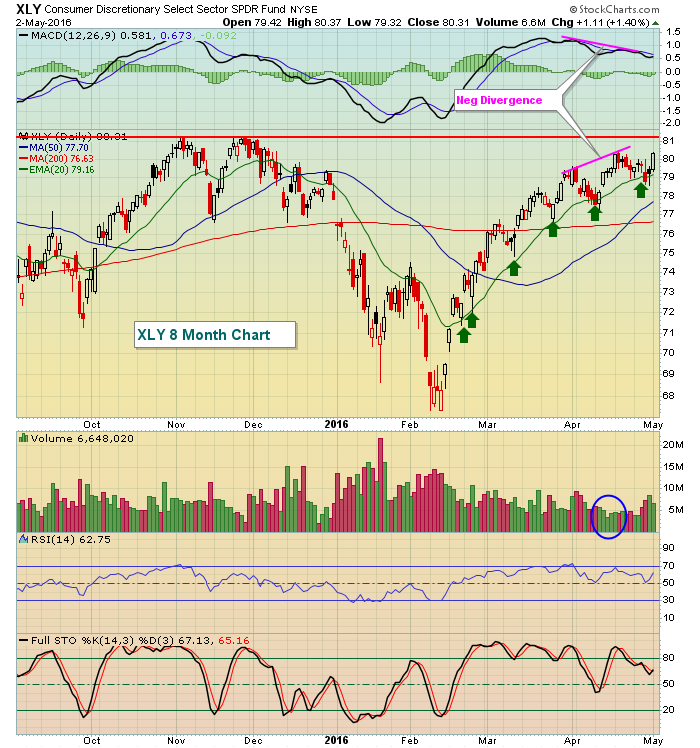
Consumer Stocks Lead U.S. Equities Higher
by Tom Bowley,
Chief Market Strategist, EarningsBeats.com
Market Recap for Monday, May 2, 2016
Consumer discretionary (XLY) and consumer staples (XLP) were the sector leaders on Monday as they posted gains of 1.40% and 1.15%, respectively. But like so many areas of the market, even sizable gains and market leadership come with warning signs and...
READ MORE
MEMBERS ONLY
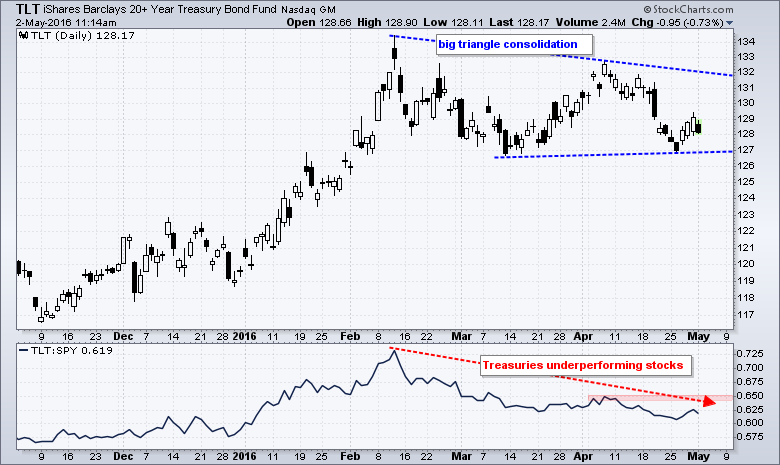
Three White Soldiers or a Bear Flag for TLT?
by Arthur Hill,
Chief Technical Strategist, TrendInvestorPro.com
The first week of the month is always a big week for Treasury bonds and the 20+ YR T-Bond ETF (TLT). There are always a slew of key economic reports and the employment report is usually the first Friday of the month. I am not going to get into the...
READ MORE
MEMBERS ONLY
Is It Time To Sell In May And Go Away?
by Tom Bowley,
Chief Market Strategist, EarningsBeats.com
Market Recap for Friday, April 29, 2016
The U.S. stock market suffered further damage on Friday as all of our major indices ended lower. There were a few bright spots despite the NASDAQ losing more than its fair share and closing at its lowest level in more than a...
READ MORE
MEMBERS ONLY
Is this a Correction or More? - Breadth Softens - A Battle Zone Brews for IWM - A Clear Level for SPY
by Arthur Hill,
Chief Technical Strategist, TrendInvestorPro.com
Putting the Pullback into Perspective // Breadth Softens, but Bullish Signals Remain // New Highs Dwindle, but Stay Net Positive // The Key Level for SPY is Obvious // A Battle Zone Brews for IWM // A Bull Flag for QQQ? //// .......
Putting the Pullback into Perspective
The Nasdaq 100 ETF led the market lower with...
READ MORE
MEMBERS ONLY
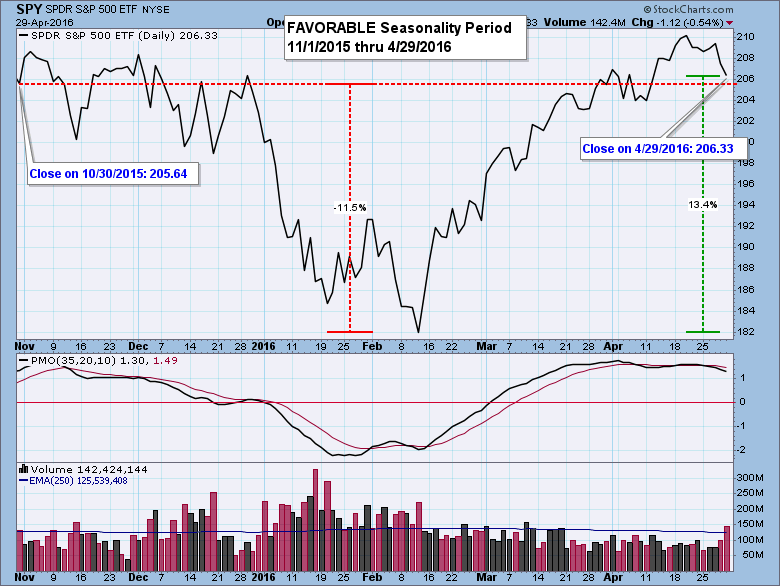
Six-Month Favorable Seasonality Period Has Ended

by Carl Swenlin,
President and Founder, DecisionPoint.com
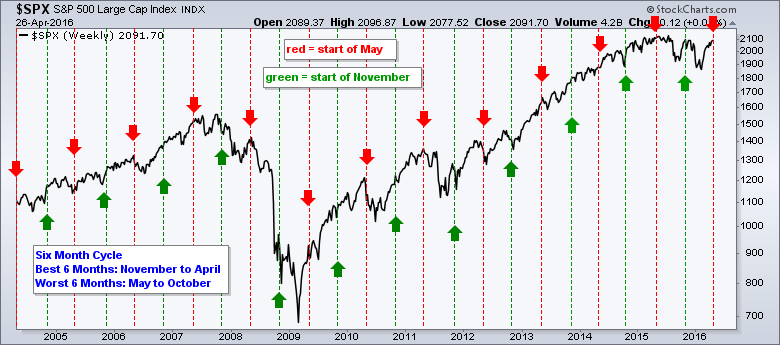
Research published by Yale Hirsch in the Stock Trader’s Almanac shows that the market year is broken into two six-month seasonality periods. The period from May 1 through October 31 is seasonally unfavorable, and the market most often finishes lower than it was at the beginning of the period....
READ MORE
MEMBERS ONLY
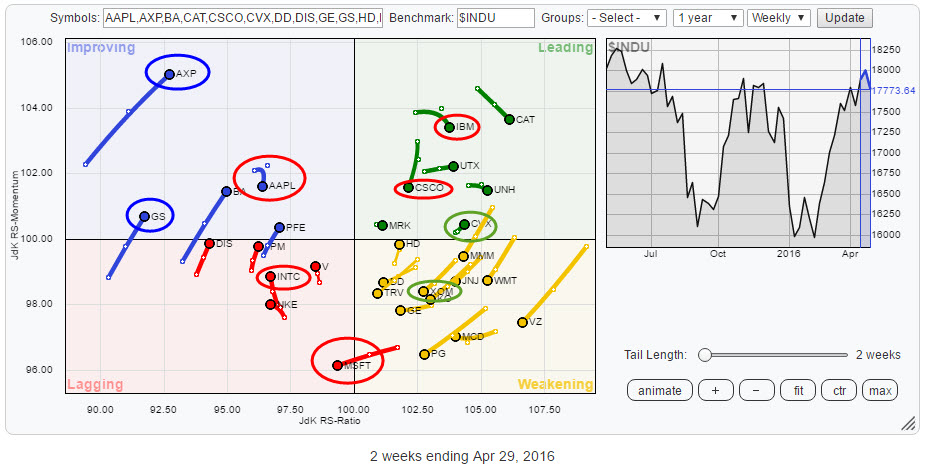
Trouble in Tech but opportunities in Energy

by Julius de Kempenaer,
Senior Technical Analyst, StockCharts.com
This Relative Rotation Graph holds the constituents of the Dow Jones Industrials Average ($INDU) and shows the position and movement of their relative trends against $INDU and each other.
In this article, I will focus on the movements in the technology- and the energy sectors and briefly touch on financials....
READ MORE
MEMBERS ONLY
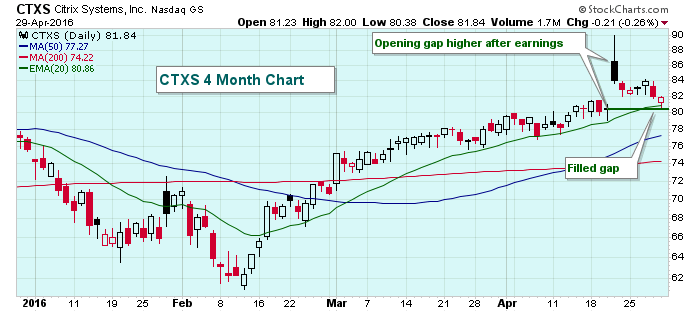
It's Not Wise To Chase Gaps
by Tom Bowley,
Chief Market Strategist, EarningsBeats.com
You have to keep in mind that when everyone wants to buy a stock (or sell a stock), it's the market makers job to provide liquidity and take the other side of the trade. That's why so often we see stocks gap higher or lower from...
READ MORE
MEMBERS ONLY

DOLLAR CONTINUES TO WEAKEN AS EURO AND YEN RALLY -- THAT FAVORS HIGHER COMMODITY PRICES, AND GOLD IN PARTICULAR -- GOLD INDICATORS SUPPORT HIGHER PRICES -- SO DOES THE FACT THAT GOLD MINERS ARE RISING EVEN FASTER THAN THE COMMODITY
by John Murphy,
Chief Technical Analyst, StockCharts.com
DOLLAR INDEX TESTS SUMMER LOW... The decline in the U.S. dollar continued this past week. The daily bars in Chart 1 show the US Dollar Index ($USD) falling to the lowest level since last summer. That was its lowest close since the start of 2015. Part of the dollar...
READ MORE
MEMBERS ONLY

Trading the Reaccumulation
by Bruce Fraser,
Industry-leading "Wyckoffian"
When a stock enters a robust uptrend it can go on for a long period of time, for years in some cases. But eventually even the best uptrend needs a rest. Leading up to this pause, the ownership quality of the float deteriorates. Strong handed Composite Operators lock up much...
READ MORE
MEMBERS ONLY

ChartPack Quarterly Update: Over 100 New Enhancements (v 8.0)

by Gatis Roze,
Author, "Tensile Trading"
Visual Analysis on Steroids
I am a big believer that investing should be fun and need not eat up all my time. One element I’ve found that makes it more so is creating colorful and visually alluring charts. To this end, present ChartPack users will therefore notice that over...
READ MORE
MEMBERS ONLY
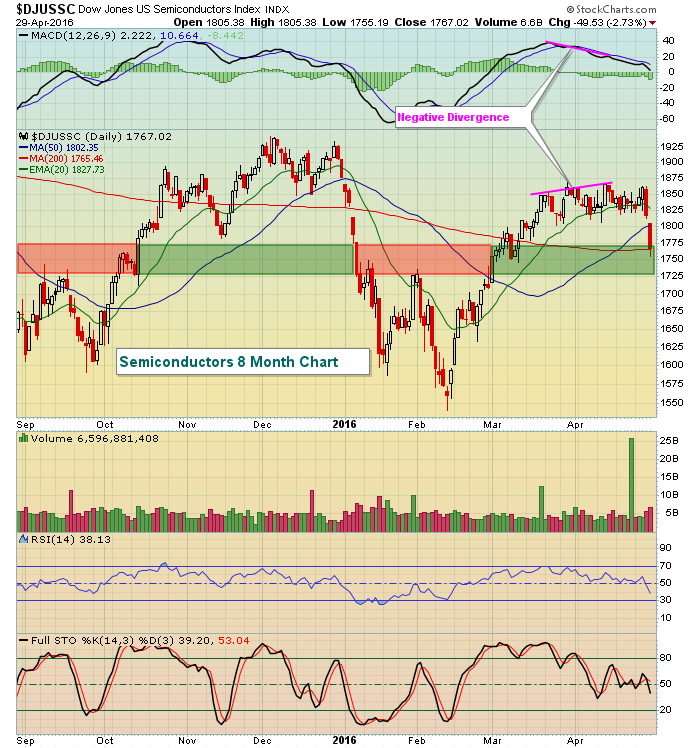
Semis Lead Tech Breakdown - Retail Weighs on Discretionary - Adding MACD and Bonds to Best Seven Months Strategy
by Arthur Hill,
Chief Technical Strategist, TrendInvestorPro.com
Semis Lead Tech Breakdown // Retail Leads EW Consumer Discretionary Lower // Adding MACD to the Best Seven Months Strategy // Adding Bonds for a Rotational Seven Month Strategy // Friday Food for Thought //// .......
Semis Lead Tech Breakdown
Semiconductors and the average tech stock were holding up better than large-cap techs, but that changed...
READ MORE
MEMBERS ONLY
Dow Drops 200 Points; U.S. Futures Lower
by Tom Bowley,
Chief Market Strategist, EarningsBeats.com
Market Recap for Thursday, April 28, 2016
U.S. indices tumbled on Thursday, the day after central bankers temporarily closed the candy store. Neither the Federal Reserve here in the U.S. nor Bank of Japan offered up any stimulus that traders could wrap their arms around and amid signs...
READ MORE
MEMBERS ONLY
This Small Technology Company Is Drifting Back To Support
by Tom Bowley,
Chief Market Strategist, EarningsBeats.com
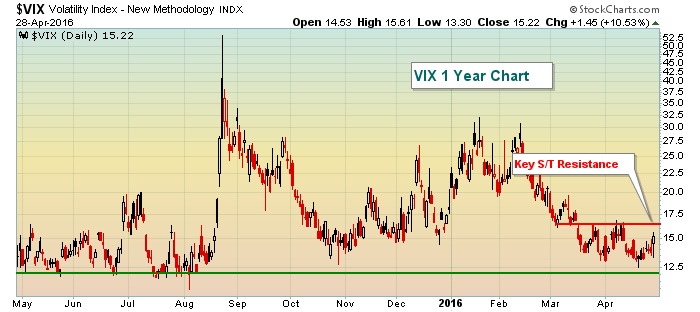
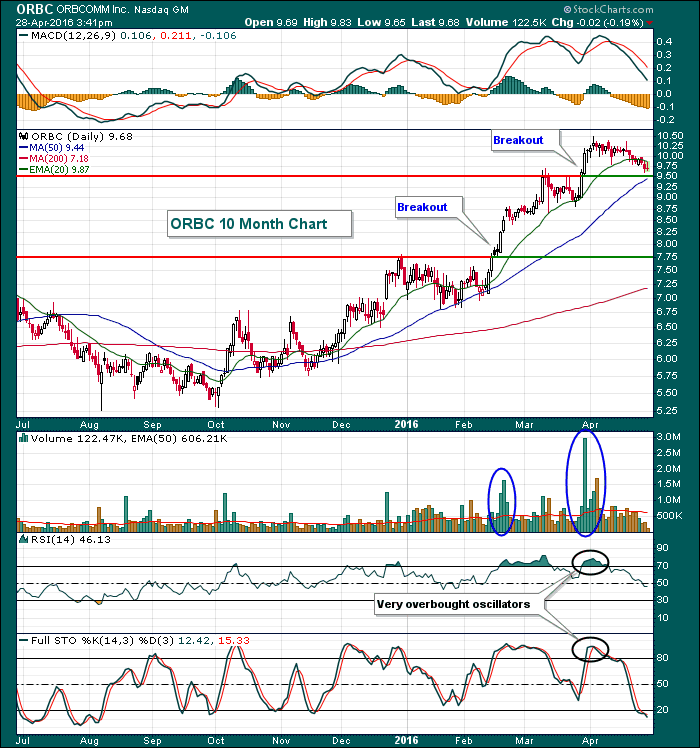
When a stock breaks out to fresh highs with light volume, a negative divergence and overbought oscillators, you need to be on high alert for a period of selling. That's exactly the signal that ORBCOMM (ORBC) provided astute traders as we entered April. Since that time ORBC has...
READ MORE
MEMBERS ONLY
Generals Diverge from Troops - XLI Leads - XSD Breaks Out - Dollar, Yen, Gold & Oil
by Arthur Hill,
Chief Technical Strategist, TrendInvestorPro.com
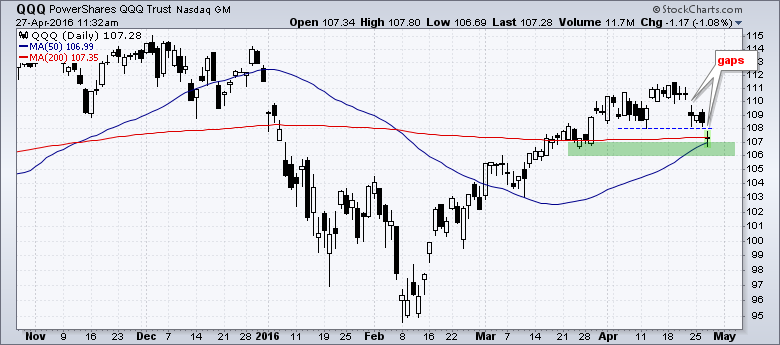
Generals Not Following the Troops // Unfilled Gaps Haunt QQQ // SPY Set to Test Gap Zone // IWM is the Current Leader // XLI Leads with New High // Three Strong Groups within Technology // Yen Broke out Before BoJ Surprise // Gold Battles Flag Breakout // Oil Reaches Fibonacci Retracement // Stocks to Watch ADI, INTC, QCOM,...
READ MORE
MEMBERS ONLY
Energy And Utilities Lead Market After FedSpeak
by Tom Bowley,
Chief Market Strategist, EarningsBeats.com
Market Recap for Wednesday, April 27, 2016
Well another FOMC meeting has come and gone. Not much has changed really. The Fed still seems adamant about raising rates, but they're not sure as to the timing. The next meeting in June is a real possibility, but they'...
READ MORE
MEMBERS ONLY

Bearish Dollar Index Signal Has Major Implications For All Kinds Of Markets And Relationships
by Martin Pring,
President, Pring Research
* Changes in key relationships
* Implications for specific stock sectors of a declining dollar
* The US versus the world
At this week’s Market Roundup webinar, I suggested that we had reached an inflexion point for many markets as well as several Intermarket and inter-asset relationships. That inflexion point centered on...
READ MORE
MEMBERS ONLY
Candlestick Analysis - Filtering
by Greg Morris,
Veteran Technical Analyst, Investor, and Author
Candle pattern filtering offers a method of trading with candlesticks that is complemented by other popular technical tools for analysis. Filtering is a concept that has been used in many other forms of technical analysis and is now a proven method with candle patterns.
Since any one indicator on its...
READ MORE
MEMBERS ONLY

VALUE ISHARES CONTINUE TO OUTPACE GROWTH ISHARES WHICH ARE BEING PULLED DOWN BY TECHNOLOGY SELLING -- BUT FINANCIALS, HEALTHCARE, ENERGY, AND INDUSTRIALS SECTORS ARE RISING -- BOEING CLEARS 200-DAY LINE AND LEADS DOW HIGHER
by John Murphy,
Chief Technical Analyst, StockCharts.com
ROTATION FROM GROWTH TO VALUE CONTINUES... Last Thursday I wrote about a rotation from "growth stocks" which rely on growing earnings into "value stocks" that are viewed as relatively cheap. That rotation is continuing. Chart 1 shows the S&P Value iShares (IVE) trading at...
READ MORE
MEMBERS ONLY
The Other QQQ is Still Holding Up
by Arthur Hill,
Chief Technical Strategist, TrendInvestorPro.com
The Nasdaq 100 ETF (QQQ) is one of the weakest of the major index ETFs right now because of several large-caps within the ETF. Note that Apple (-10%), Facebook (-6%), Google (-6.5%) and Microsoft (-8%) are all down sharply this month. Amazon (+2%) is the only one of the...
READ MORE
MEMBERS ONLY
Apple Crushed After Earnings, NASDAQ Futures Tank
by Tom Bowley,
Chief Market Strategist, EarningsBeats.com
Market Recap for Tuesday, April 26, 2016
April has not been kind to technology stocks (XLK). We've seen several key earnings disappointments from the group, including Microsoft (MSFT), Alphabet (GOOGL) and Apple (AAPL), and investors in those three are not happy. We've seen bifurcated action throughout...
READ MORE
MEMBERS ONLY
SystemTrader - Testing the Best Six Months Strategy and a Classic Moving Average Crossover System
by Arthur Hill,
Chief Technical Strategist, TrendInvestorPro.com
SystemTrader // Dissecting the Best Six Months Pattern // Historical Numbers Confirm // Shorting the Market is a Challenge // What is the deal with October? // Reducing the Dreaded Drawdown // Testing the 50-200 Cross Since 1950 // Final Thoughts // .........
May is approaching and this means the stock market is entering its weakest six-month period. With...
READ MORE
MEMBERS ONLY

Four Signs that a Bull Market is Upon Us
by Erin Swenlin,
Vice President, DecisionPoint.com
During last Friday's webinar, I attempted to answer the "$64 Million Dollar Question" (For old-timers like me who know it was the $64,000 Question, I chose to use poetic license because $64,000 sounds lame by today's standards!) that readers and viewers have...
READ MORE
MEMBERS ONLY

COMMODITIES ETF CHALLENGES 200-DAY AVERAGE WHICH MAY BE PULLING TREASURY BOND YIELDS HIGHER -- HIGHER YIELDS ARE HELPING FINANCIALS -- INDUSTRIAL SPDR SIGNALS SHIFT TO ECONOMICALLY-SENSITIVE STOCKS -- RYDER, PACCAR, AND LOCKHEED MARTIN LEAD XLI HIGHER
by John Murphy,
Chief Technical Analyst, StockCharts.com
RISING COMMODITIES PULL BOND YIELDS HIGHER... The rally in commodity markets may be about to move into higher gear. Chart 1 shows the DB Commodities Tracking Index Fund (DBC) on the verge of moving above its 200-day average for the first time in two years. A weaker dollar is one...
READ MORE
MEMBERS ONLY
Crude Oil Hasn't Done This In Nearly Two Years
by Tom Bowley,
Chief Market Strategist, EarningsBeats.com
Market Recap for April 25, 2016
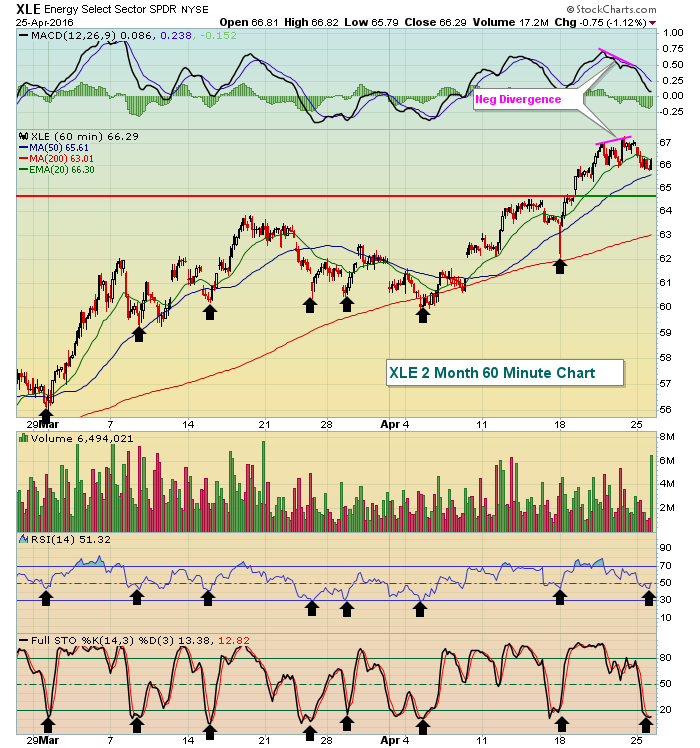
Energy (XLE) was very weak on Monday, losing 1.12% to finish 9th out of 9 sectors. Technically, the sector is still very strong and has essentially "reset" its hourly MACD to centerline support. A negative divergence on the hourly chart suggested...
READ MORE
MEMBERS ONLY
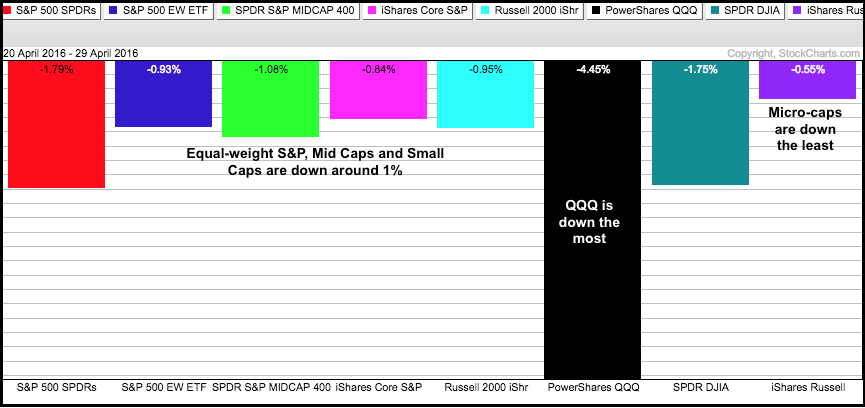
Micro-caps Take the Lead
by Arthur Hill,
Chief Technical Strategist, TrendInvestorPro.com
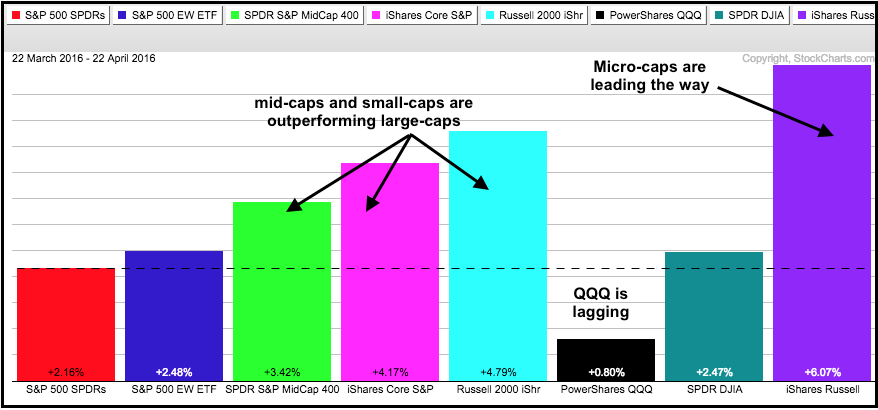
The appetite for risk has increased over the past month with small-caps, mid-caps and micro-caps leading the market higher. The PerfChart below shows one-month performance for the S&P 500 SPDR (red) and seven other broad market index ETFs. The S&P MidCap SPDR (green), S&P...
READ MORE
MEMBERS ONLY
Stock Market Bulls: "Let's Have A Toast"
by Tom Bowley,
Chief Market Strategist, EarningsBeats.com
Market Recap for Friday, April 22, 2016
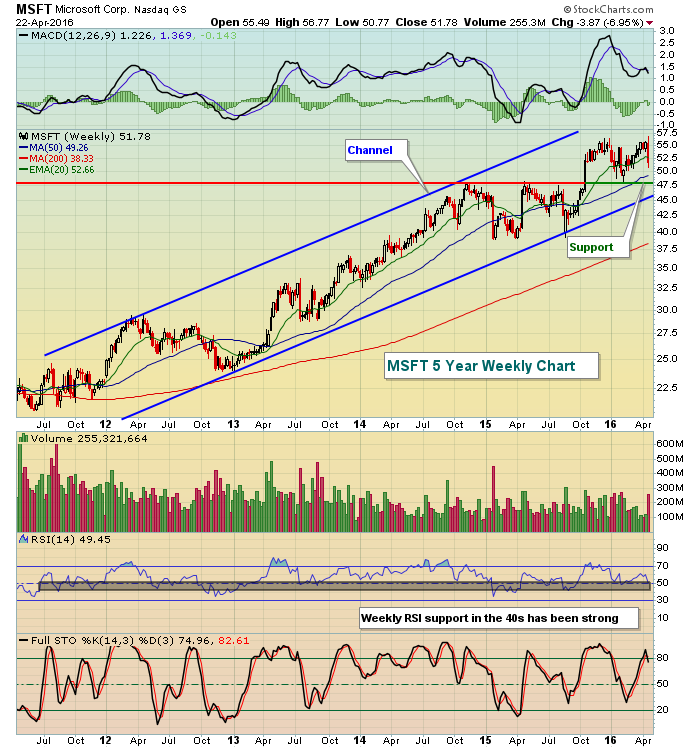
The technology world (-1.74%) was rocked on Friday with disappointing earnings announcements from a host of NASDAQ names, particularly a couple large technology companies. Microsoft (MSFT) stumbled badly, losing 7.17% after posting EPS that fell slightly below expectations. Revenue guidance in...
READ MORE
MEMBERS ONLY
Strong rotation for commodities, SPY and IEF (ratio) under threat
by Julius de Kempenaer,
Senior Technical Analyst, StockCharts.com
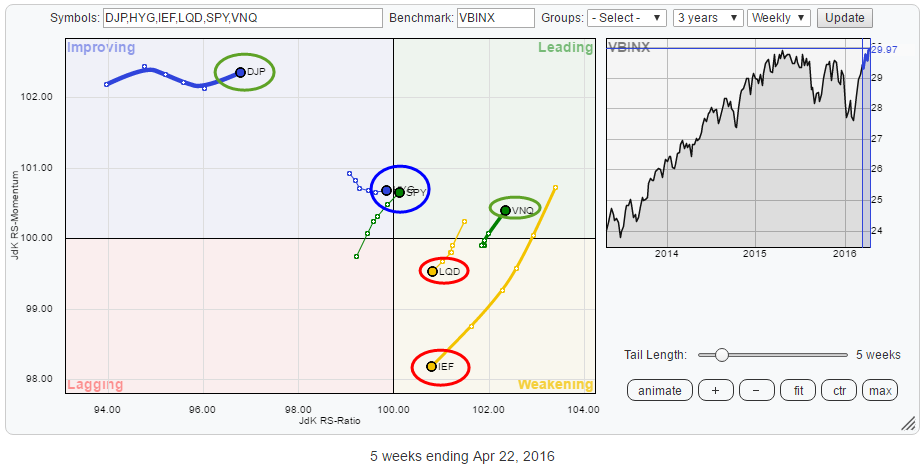
The Relative Rotation Graph below shows the rotational picture for a number of asset classes, based on ETFs, against the Vanguard Balanced index fund on a weekly basis. For some of these asset classes, the equivalent picture on a daily basis is confirming but for others it is contrarian. Or...
READ MORE
MEMBERS ONLY
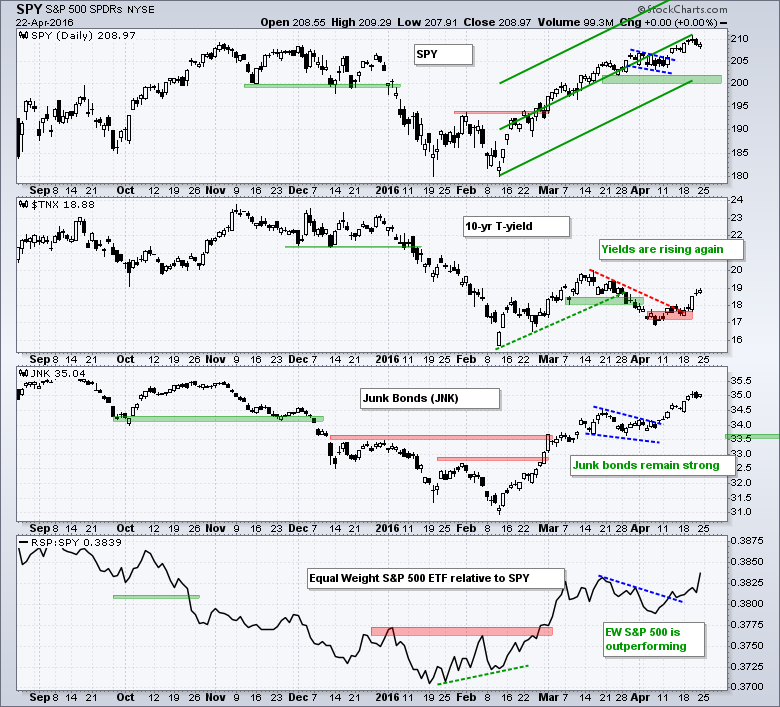
Small-caps, Junk and Risk Appetite - HACK Firms - 7 Cyber Security Stocks to Watch
by Arthur Hill,
Chief Technical Strategist, TrendInvestorPro.com
Small-caps, Junk Bonds and Risk Appetite // QQQ Forms Island Reversal // IWM Continues to Outperform // SPY Holds Breakout // HACK Consolidates after Big Surge // Seven Cyber Security Stocks to Watch ////
Small-caps, Junk Bonds and Risk Appetite
Even though the stock market may be ripe for a correction of some sort in the...
READ MORE
MEMBERS ONLY
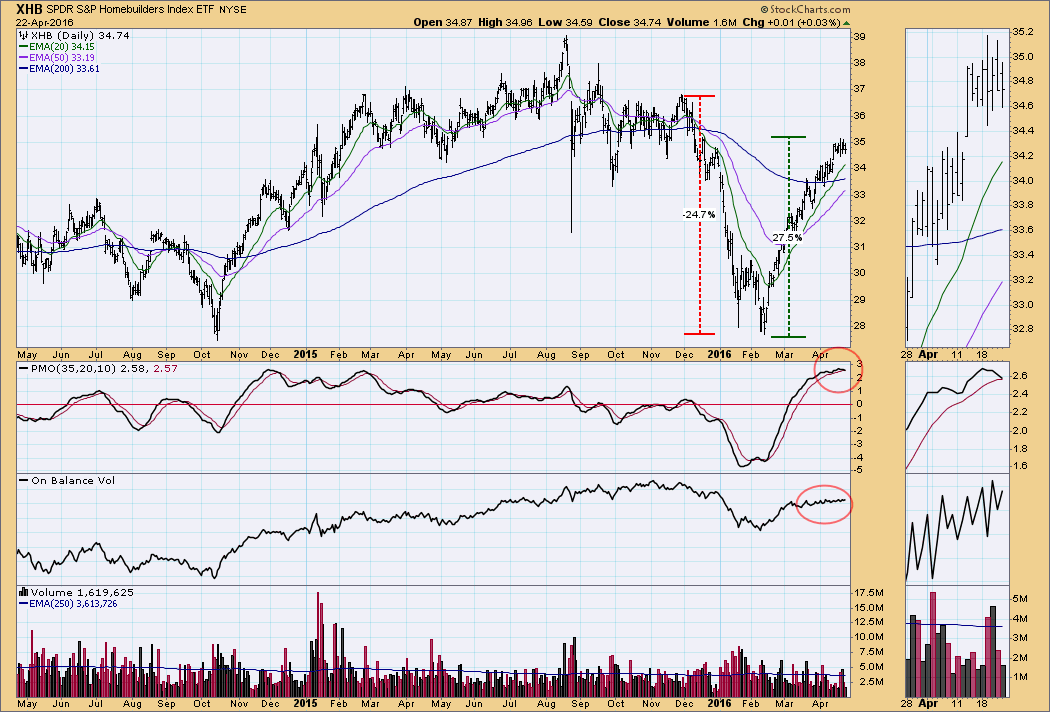
Homebuilders: Watch for Correction
by Carl Swenlin,
President and Founder, DecisionPoint.com
The Homebuilders sector (XHB) has had an interesting six months, declining -25% from the December high, then rallying +27% from the February low. Now the internals are implying that a correction is about to start.
First, the PMO has topped in very overbought territory, and it is about the cross...
READ MORE
MEMBERS ONLY
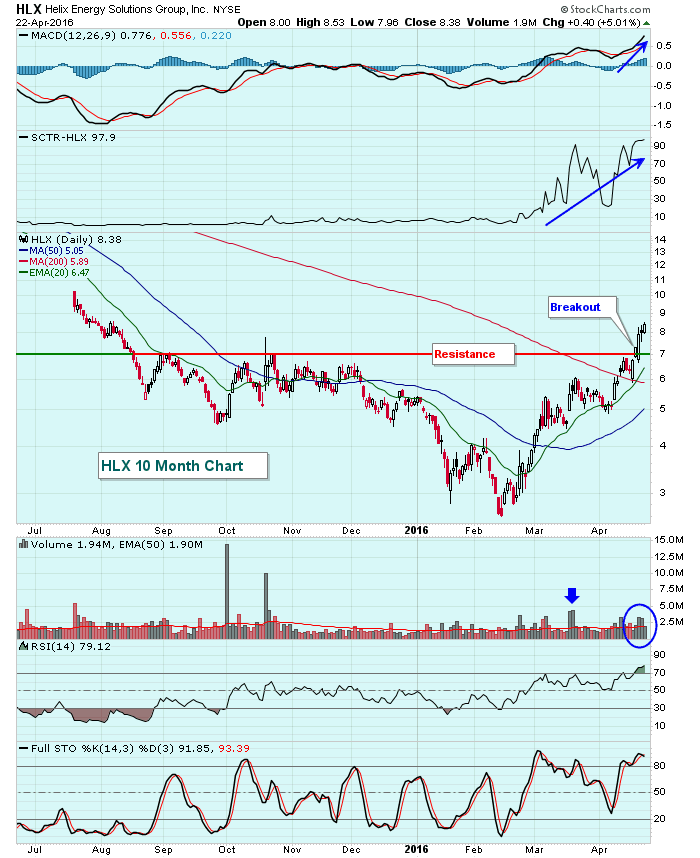
Helix Energy Breaks Out, SCTR Surges Above 90
by Tom Bowley,
Chief Market Strategist, EarningsBeats.com
Energy stocks have been strengthening throughout 2016 and Helix Energy Solutions (HLX) is a small $900 million market cap company that just broke out his past week. Its SCTR rank has quickly soared to above 90 after recently printing SCTR readings in the single digits for several months. Check out...
READ MORE
MEMBERS ONLY

Wyckoff Skill Building
by Bruce Fraser,
Industry-leading "Wyckoffian"
There are no absolutes in trading financial markets. The best market operators are exceptional risk managers. The Wyckoff Method seeks conditions where a high likelihood of success is probable. Wyckoffians systematically search for the clues that precede a stock becoming a persistent and long term leader. Some of these characteristics...
READ MORE
MEMBERS ONLY
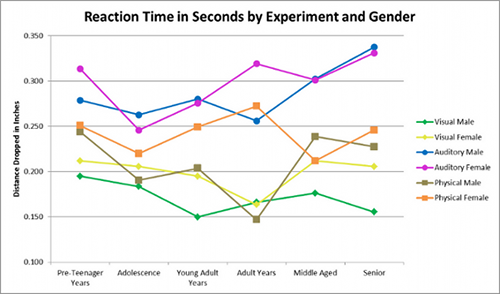
Here's How Your Buying & Selling RT (Reaction Time) Flows Through to Your Bottom Line
by Gatis Roze,
Author, "Tensile Trading"
I’ve been told I’m a little unusual in that I rate my trades on a scale of 1 – 5 stars depending on my reaction time (RT). My reaction time rating is merely a measure of the quickness an investor responds to some sort of market stimulus. I rate...
READ MORE