MEMBERS ONLY
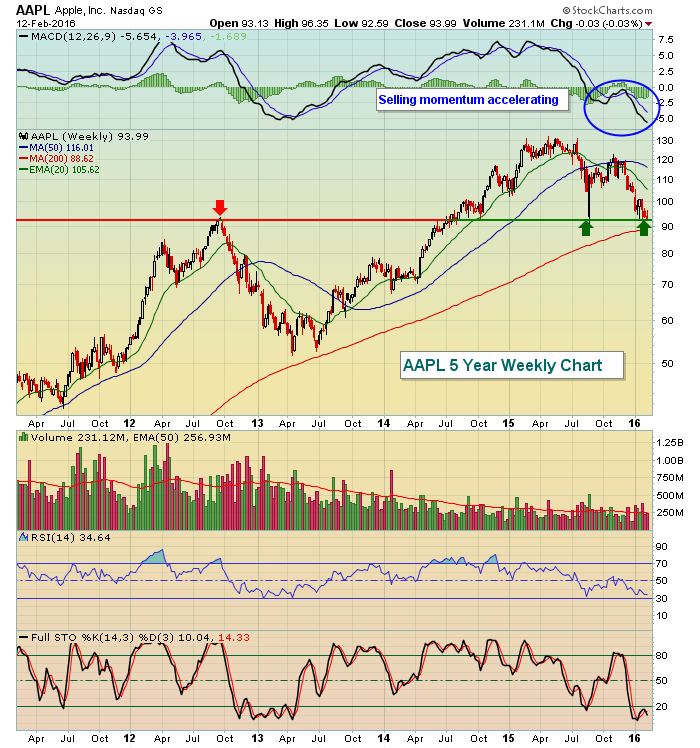
Is The Long-Term Run Over For Apple (AAPL)?

by Tom Bowley,
Chief Market Strategist, EarningsBeats.com
It's difficult to argue that Apple has been one of the best performing stocks - if not the best - in the 21st century. But every stock has its limitations and a good question is whether AAPL has reached its top. AAPL has fallen 30% from its peak...
READ MORE
MEMBERS ONLY

More Evidence Of An Intermediate Bear Market Rally Falls Into Place

by Martin Pring,
President, Pring Research
* World breadth series signal that global equities are ready to advance
* Dollar faces an important technical test
Sometimes when the market declines, things actually improve, and that’s what may have been happening this week. In my most recent article, Intermediate Indicators Signal a Rally but Remember It’s a...
READ MORE
MEMBERS ONLY
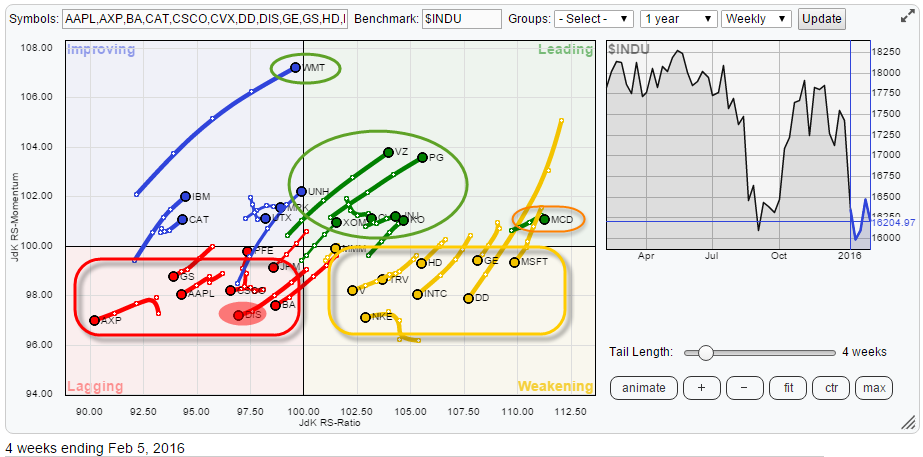
Strong sector rotation inside S&P 500 suggests more weakness in Financials

by Julius de Kempenaer,
Senior Technical Analyst, StockCharts.com
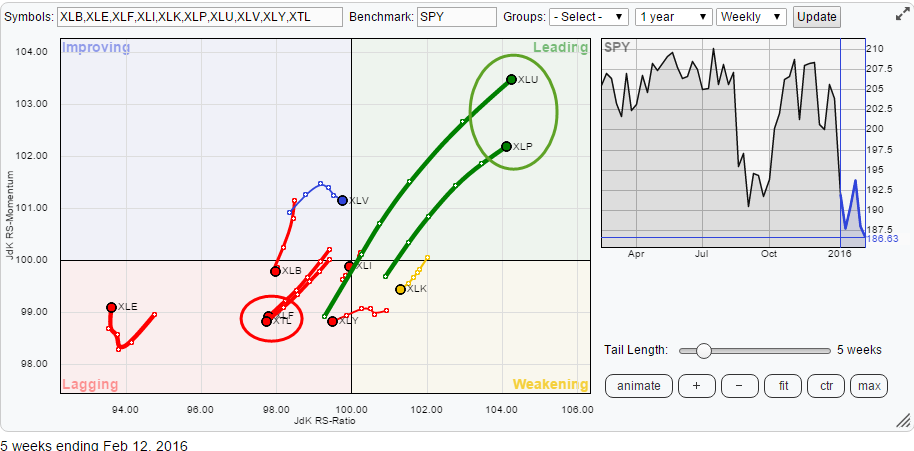
Since the beginning of the year, the internal characteristics of the S&P 500 universe are characterized by strong sector rotation. The Relative Rotation Graph below shows the sector rotation over the past five weeks. A few sectors are standing out and worth a further inspection.
Summary
* XTL expected...
READ MORE
MEMBERS ONLY

FRIDAY'S RALLY PREVENTS CHART BREAKDOWN -- OIL RALLY GIVES STOCKS A STRONG BOOST -- ENERGY SHARES ARE IN POTENTIAL SUPPORT ZONE -- BANK SHARES TEST LONG-TERM SUPPORT LINES -- FRIDAY'S JUMP IN BOND YIELDS ALSO HELPS STOCKS

by John Murphy,
Chief Technical Analyst, StockCharts.com
MARKET BENDS BUT DOESN'T BREAK... It looked on Thursday like the major U.S. stock indexes were on the verge of closing below their January lows. A Thursday afternoon rebound, however, followed by a 2% gain on Friday kept those support levels intact. Chart 1 shows the Dow...
READ MORE
MEMBERS ONLY

The Point and Figure Distribution Paradox

by Bruce Fraser,
Industry-leading "Wyckoffian"
Counting Point and Figure Distributions is a bit of a paradox. Accumulation counts can grow very large and lead to advances that are multiples of their starting point. However, a stock under Distribution is bound by the zero line. Counting conventions for Distribution are therefore different from Accumulation.
Judicious counting...
READ MORE
MEMBERS ONLY

Your Survival and Success As An Investor Depends On This

by Gatis Roze,
Author, "Tensile Trading"
“The way to pick an investor’s pocket is through the ear.” – Jason Zweig
There is a direct correlation between an investor’s profitability and his or her communication skills. I would be willing to wager you that I could ascertain the degree of your success as an investor within...
READ MORE
MEMBERS ONLY
New Lows across US, Asia & Europe - Measuring Participation w/ %Above 50-day

by Arthur Hill,
Chief Technical Strategist, TrendInvestorPro.com
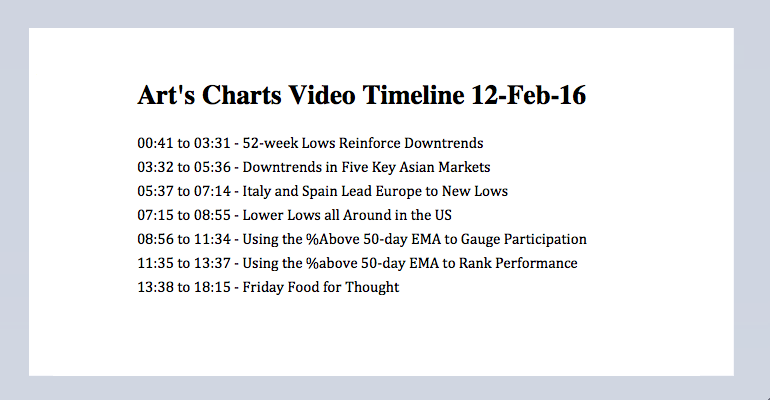
52-week Lows Reinforce Downtrends // Downtrends in Five Key Asian Markets // Italy and Spain Lead Europe to New Lows // Lower Lows all Around in the US // Using the %Above 50-day EMA to Gauge Participation // Using the %Above 50-day EMA to Rank Performance // Friday Food for Thought
52-week Lows Reinforce Downtrends
The...
READ MORE
MEMBERS ONLY
Why This Rally Could Last A Bit Longer
by Tom Bowley,
Chief Market Strategist, EarningsBeats.com
Market Recap for Thursday, February 11, 2016
It was another very rough outing for financials (XLF) in general and banks ($DJUSBK) in particular with losses of 3.06% and 4.28%, respectively. The banking issue is most definitely a global one as has been very well documented here at StockCharts....
READ MORE
MEMBERS ONLY
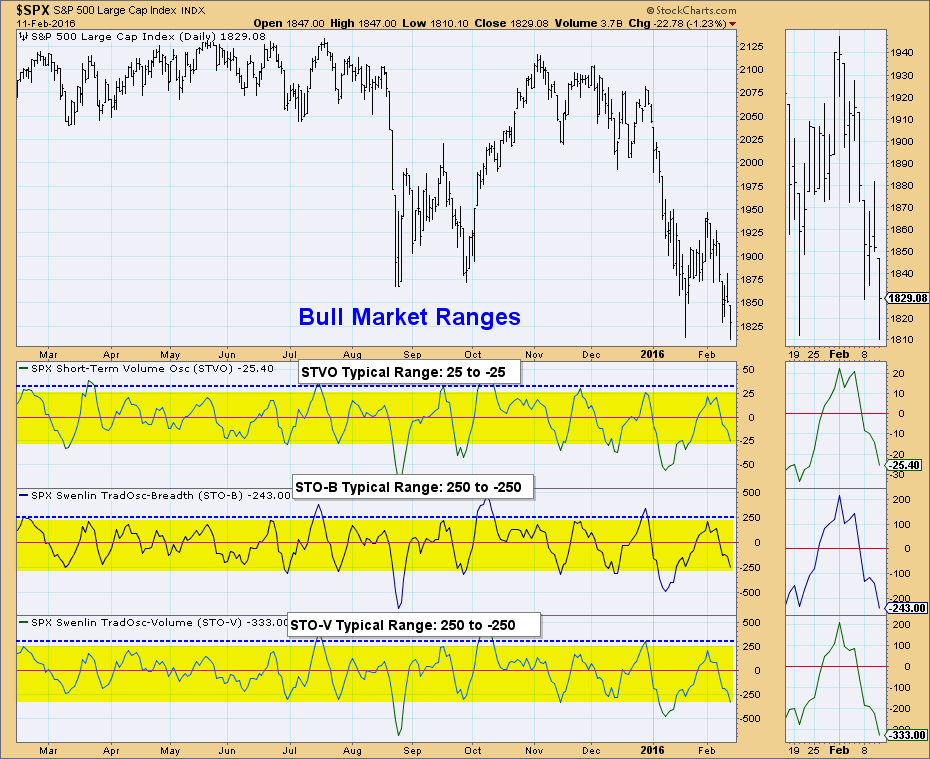
Bear Market Oscillator Ranges - Oversold Territory Expands

by Erin Swenlin,
Vice President, DecisionPoint.com
I think we can all agree that we are currently consumed in a bear market. If you remember the Bear Market Rules article I wrote last year, I discussed how our bullish expectations need to be tempered. Part of that is realizing that "oversold" in a bear market...
READ MORE
MEMBERS ONLY
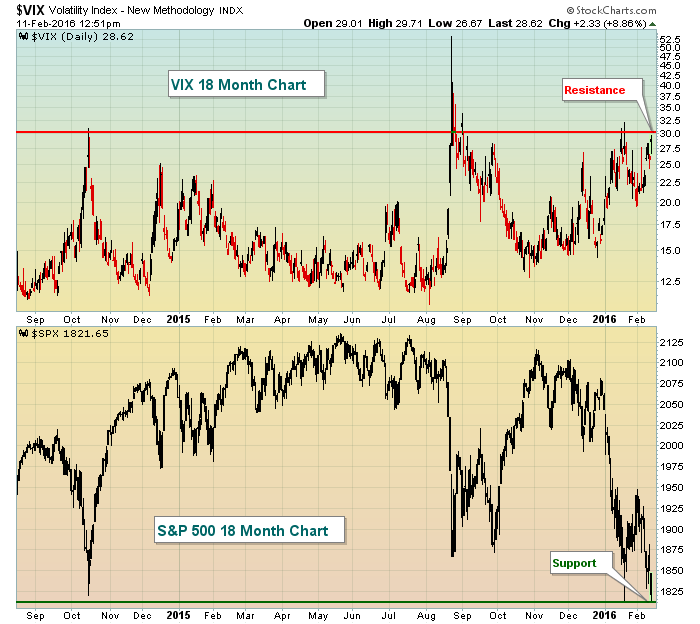
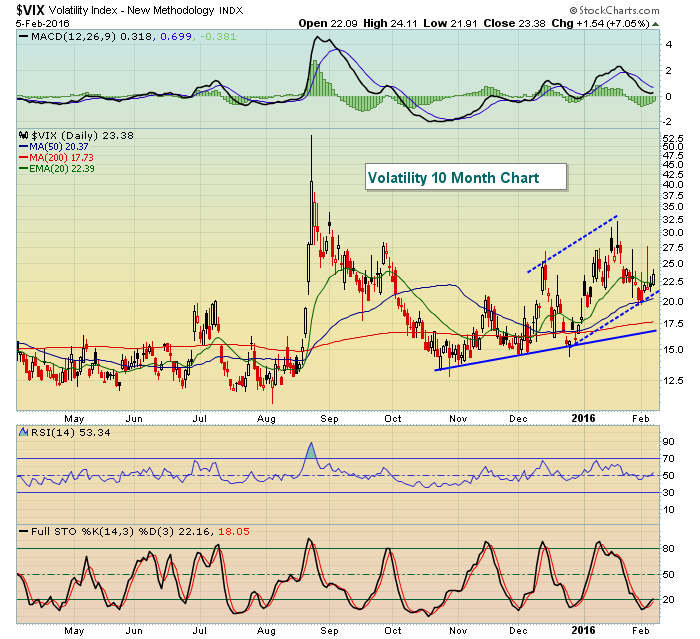
Volatility ($VIX) Nearing Key Breakout As S&P 500 Nears Support
by Tom Bowley,
Chief Market Strategist, EarningsBeats.com
Volatility and S&P 500 performance tend to move in opposite directions. As fear escalates and the VIX prices in higher expected volatility, equity markets sell off. Currently, the VIX is nearing its recent resistance near 30, which is a very high level of expected volatility, one in which...
READ MORE
MEMBERS ONLY

TREASURY YIELDS FALL TO THREE-YEAR LOW AS PRICES SURGE -- THAT'S REALLY HURTING BANKS AND LIFE INSURERS -- PRUDENTIAL TUMBLES -- MONEY CONTINUES TO FLOW INTO TREASURY BONDS, GOLD, AND THE JAPANESE YEN -- DOW ON VERGE OF BREAKDOWN
by John Murphy,
Chief Technical Analyst, StockCharts.com
TREASURY YIELDS FALL TO THREE-YEAR ... The rapid descent in global bond yields continues uninterrupted. The 10-Year Japanese bond yield recently fell into negative territory for the first time in its history. That's helping drive sovereign bond yields lower everywhere else. Chart 1 shows the 10-Year Treasury Yield falling...
READ MORE
MEMBERS ONLY
The Realities of Support, Oversold Conditions, Hiding Places, Correlations and Cash in Bear Markets
by Arthur Hill,
Chief Technical Strategist, TrendInvestorPro.com
Trend Trumps All Else // Forget about Support Levels in a Downtrend // Oversold Can Become Even More Oversold // Elevator Down Stairs Higher // Few Places to Hide // Correlations Rise in a Bear Market // Cash is a Real Position // A Penny Saved is Worth more Than a Penny Earned ////
Stocks are getting slammed...
READ MORE
MEMBERS ONLY
Oil, Global Markets And Fed Sink U.S. Futures
by Tom Bowley,
Chief Market Strategist, EarningsBeats.com
Market Recap for Wednesday, February 10, 2016
There was a bit of strength on Wednesday as the NASDAQ managed to finish with a minor gain, while the remaining key indices gave up earlier gains to end the session in negative territory. The bifurcated action was very disappointing to those hoping...
READ MORE
MEMBERS ONLY

TRANSPORTS TEST LONG-TERM SUPPORT LINES -- AIRLINES AND TRUCKERS ATTRACT SOME BUYING -- TRANSPORTATION/UTILITY RATIO IS OVERSOLD -- SO IS THE TRANSPORTATION/INDUSTRIAL RATIO -- THE DOW USUALLY HOLDS UP BETTER IN A WEAK MARKET
by John Murphy,
Chief Technical Analyst, StockCharts.com
TRANSPORTS START TO SHOW SOME BOUNCE... Transportation stocks have been one of the weakest parts of the stock market over the last year. In fact, the downtrend in that economically-sensitive group was cited several times last year as a negative warning for the economy and stock market. The daily bars...
READ MORE
MEMBERS ONLY
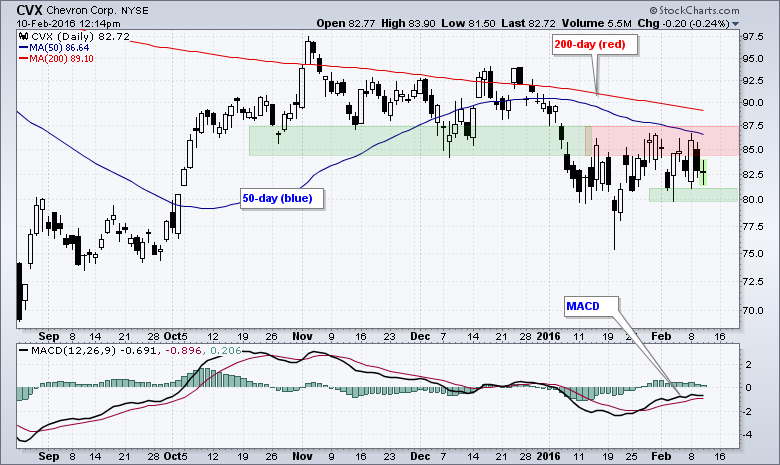
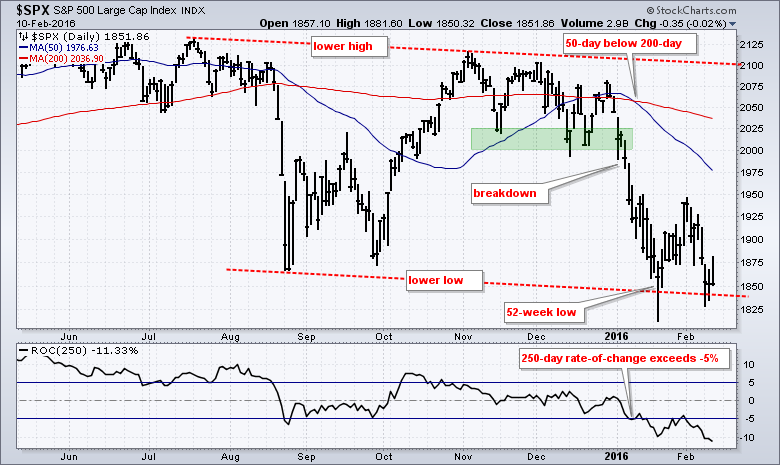
Chevron Stalls out Below Two Key Moving Averages
by Arthur Hill,
Chief Technical Strategist, TrendInvestorPro.com
Chevron (CVX) is a long-term downtrend and looks vulnerable to another leg lower. The price chart shows CVX trading below the falling 200-day moving average and below the 50-day moving average. Also notice that the 50-day is below the 200-day. These relationships indicate that the long-term trend is down. The...
READ MORE
MEMBERS ONLY
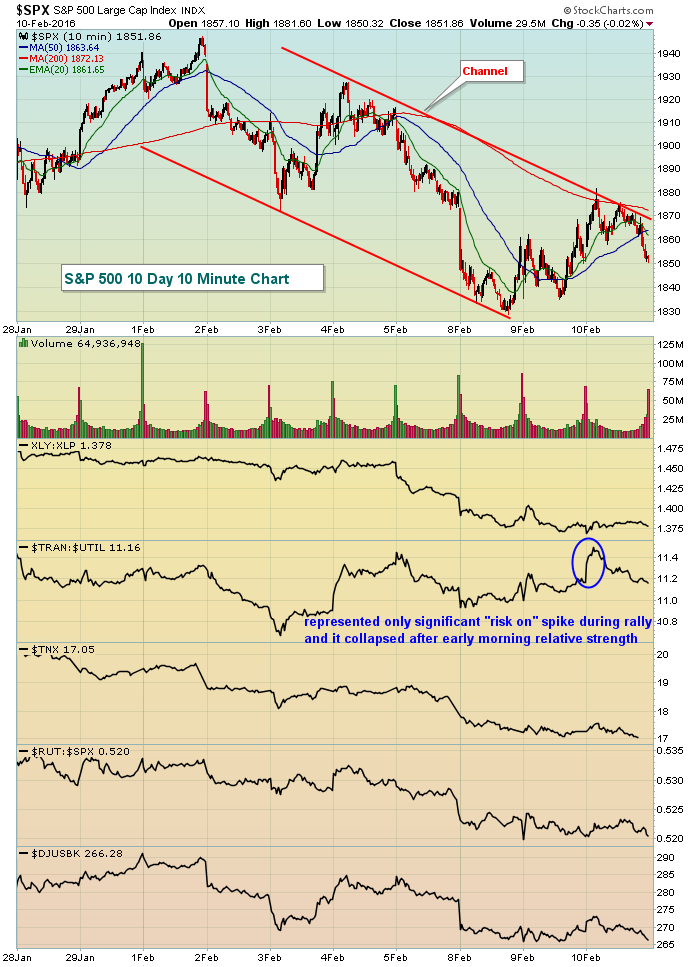
U.S. Futures Rally, Looking For Short-Term Clues
by Tom Bowley,
Chief Market Strategist, EarningsBeats.com
Market Recap for Tuesday, February 9, 2016
U.S. stocks were lower throughout much of the session on Tuesday before rallying in early afternoon action to move into positive territory with one hour left. Unfortunately, another round of quick selling emerged and all of our major indices finished lower once...
READ MORE
MEMBERS ONLY
Gaps and Wedge Breaks Remain for SPY, QQQ and IWM
by Arthur Hill,
Chief Technical Strategist, TrendInvestorPro.com
Before looking at the short-term situation for SPY, QQQ and IWM, let's review the bigger trends using the S&P 500 and Russell 2000. Some things are open for debate in the stock market, but I don't think there is much debate on the long-term...
READ MORE
MEMBERS ONLY
Candlestick Analysis

by Greg Morris,
Veteran Technical Analyst, Investor, and Author
In 1988 I attended a Market Technician’s Association (MTA) meeting in Phoenix at the Camelback Inn. There were two wonderful highlights that occurred at that meeting: one was an introduction to Japanese candle pattern analysis/charting, and the other was meeting Ian McAvity who published Deliberations newsletter for over...
READ MORE
MEMBERS ONLY
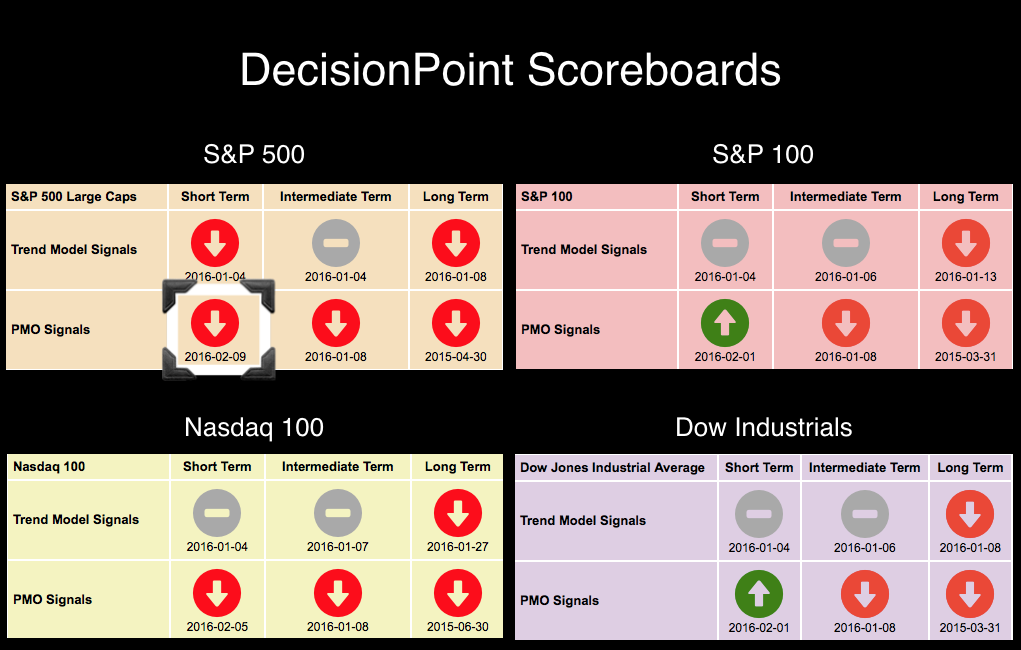
NDX Price Performance Comparisons - S&P 500 New PMO SELL Signal
by Erin Swenlin,
Vice President, DecisionPoint.com
The first hint that the bear market rally was exhausted was when the Nasdaq 100, which had been strongest during the bear market, switched before the other indexes to a PMO SELL signal. Today, the SPX lost its BUY signal and joined the NDX with a new Price Momentum Oscillator...
READ MORE
MEMBERS ONLY
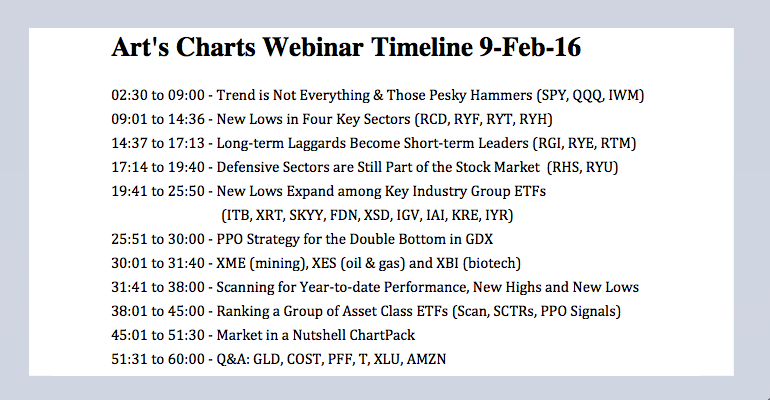
Risk-On Sectors Stumble - Those Pesky Hammers - Webinar Recording
by Arthur Hill,
Chief Technical Strategist, TrendInvestorPro.com
Trend is Not Everything, it's... // Those Pesky Hammers // New Lows in Key Sectors // Even Healthcare is not Healthy // Long-term Laggards Become Short-term Leaders // Staples Start Feeling the Heat ////
Trend is Not Everything, it's...
If Vince Lombardi were a trend follower, he would probably say: "trend...
READ MORE
MEMBERS ONLY
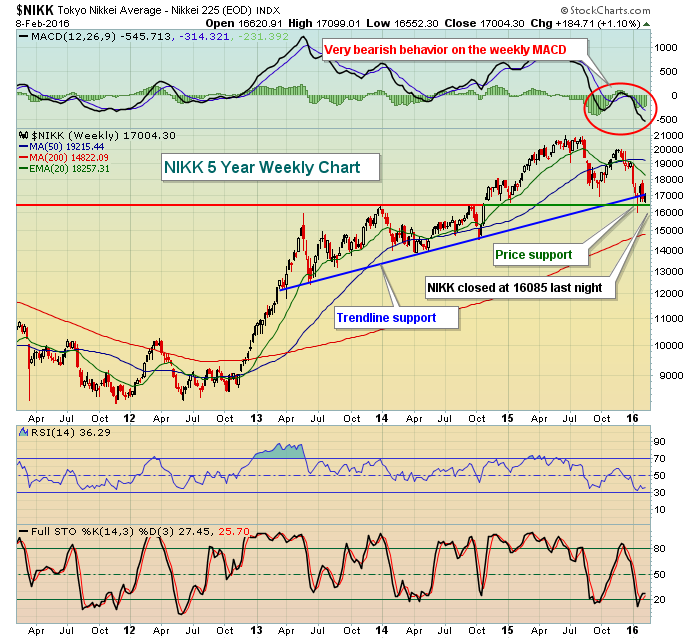
Tokyo Nikkei Average Drops 5%; U.S. Futures Weak
by Tom Bowley,
Chief Market Strategist, EarningsBeats.com
Market Recap for Monday, February 8, 2016
While the U.S. market continued its downward spiral, Tokyo's Nikkei Average ($NIKK) fell more than 5% overnight, losing critical price and trendline support. Check it out:
This chart was shown last week with the key price and trendline support reflected....
READ MORE
MEMBERS ONLY

Intermediate Indicators Still Signal A Rally But Remember, It's A Bear Market
by Martin Pring,
President, Pring Research
* Monday may have been a successful test of the January low
* Five inter-market relationships break out
* The 5-year yield breaks down
For the last two weeks I have been pointing out that several intermediate type indicators that have traditionally signaled rallies were in a bullish mode. The problem is that...
READ MORE
MEMBERS ONLY
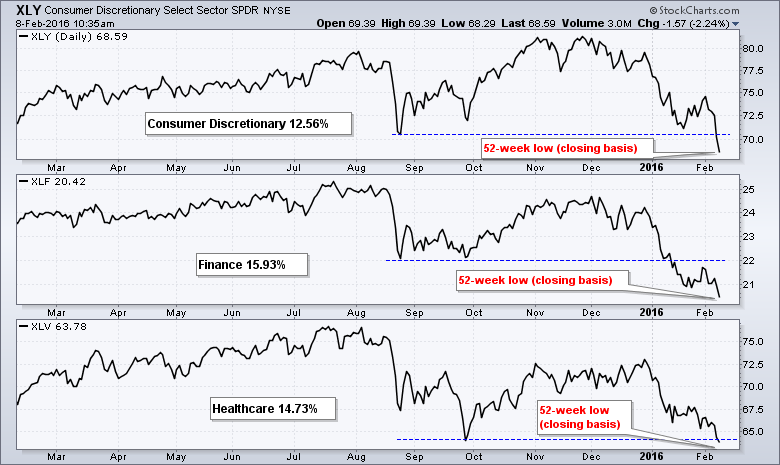
Three Big Sectors Hit New Lows for the Year
by Arthur Hill,
Chief Technical Strategist, TrendInvestorPro.com
There are nine sectors in the S&P 500 SPDR (SPY) and their weights range from 2.82% (materials) to 20.17% (technology). The technology sector is around seven times bigger than the materials sector and this means that not all sectors affect the S&P 500 the...
READ MORE
MEMBERS ONLY
U.S. Futures Looking To Extend Friday's Losses
by Tom Bowley,
Chief Market Strategist, EarningsBeats.com
Special Note: If you missed our joint webinar on Friday, Greg Schnell and I will be back at it and hosting another joint one hour webinar today. We had a huge crowd on Friday and the two of us providing our own distinct views generated much interest. The webinar is...
READ MORE
MEMBERS ONLY
Trouble in DIS(neyland) and renewed energy for XOM
by Julius de Kempenaer,
Senior Technical Analyst, StockCharts.com
Over the past few days I have been looking at the Relative Rotation Graph of the 30 Dow stocks and its individual charts, and quite frankly I don't even know where to begin. Big swings all over the place, from +6% in DD to -9% in MSFT and...
READ MORE
MEMBERS ONLY
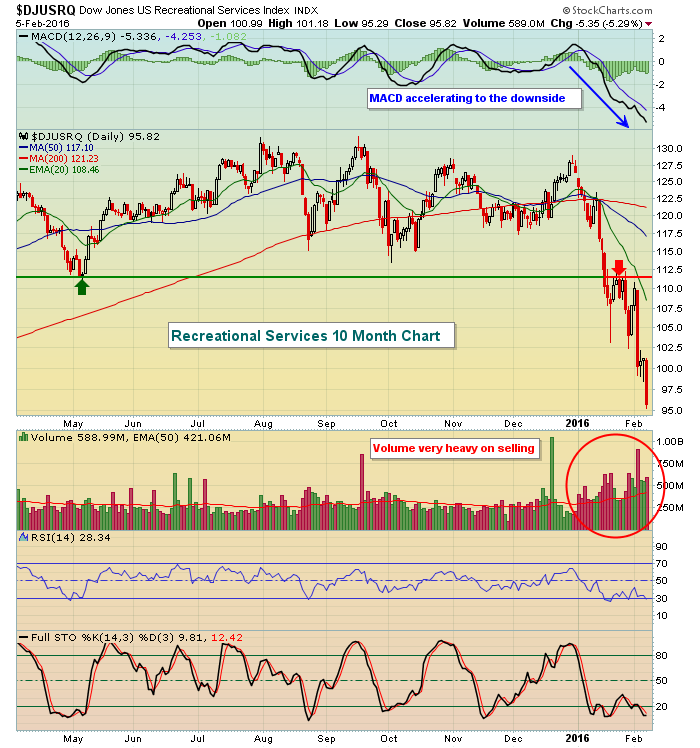
Recreational Services Index Has A Bad Year......Last Week
by Tom Bowley,
Chief Market Strategist, EarningsBeats.com
The Dow Jones U.S. Recreational Services Index ($DJUSRQ) fell more than 11% last week as traders completely ignored the consumer discretionary space (XLY). The only industry group within consumer discretionary that performed worse was Business Training & Employment Agencies ($DJUSBE), which fell a staggering 28% on Friday after LinkedIn...
READ MORE
MEMBERS ONLY
The Market is in a Classic Bull/Bear Battle Right Now
Hello Fellow ChartWatchers!
Wow, people are all over the place with their emotions right now. "Devastating Recession on the Way!" "Strong Tech Earnings Lead to Rally Mode!" "The Fed is Out to Kill the Economy!" and my personal favorite "Head and Shoulders Top...
READ MORE
MEMBERS ONLY
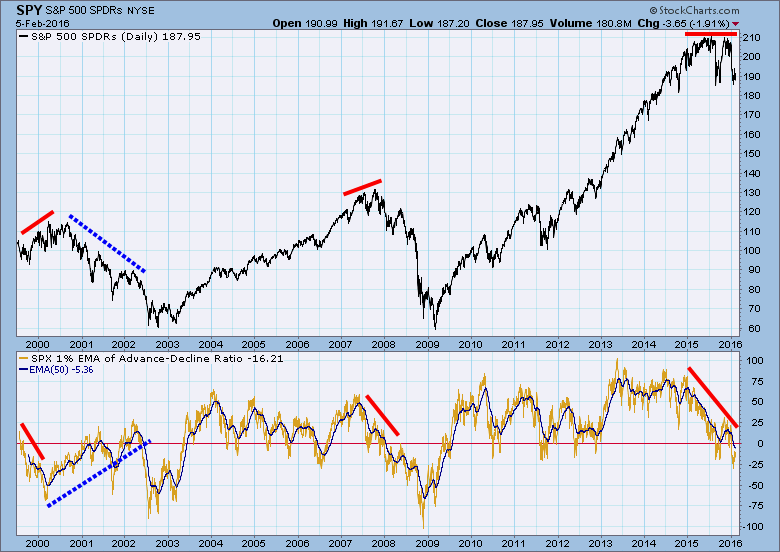
Breadth Anomalies

by Carl Swenlin,
President and Founder, DecisionPoint.com
Some time ago I wrote an article featuring the 1% EMA (200EMA) of the S&P 500 Advance-Decline Ratio. My purpose was to point out the negative divergences (red lines) that occurred at major market tops in 2000 and 2007, as well as to show the current developing negative...
READ MORE
MEMBERS ONLY
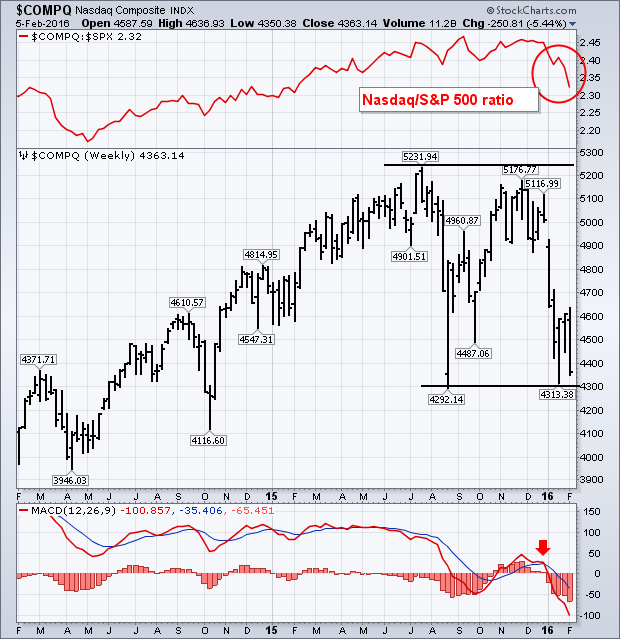
Nasdaq May Be On Verge Of Breakdown
by John Murphy,
Chief Technical Analyst, StockCharts.com
It's never a good sign to see the Nasdaq leading the rest of the market lower, which it did this week. A -3% plunge on Friday (and a -5% loss for the week) made it the weakest of the major market indexes. Heavy selling in software and internet...
READ MORE
MEMBERS ONLY
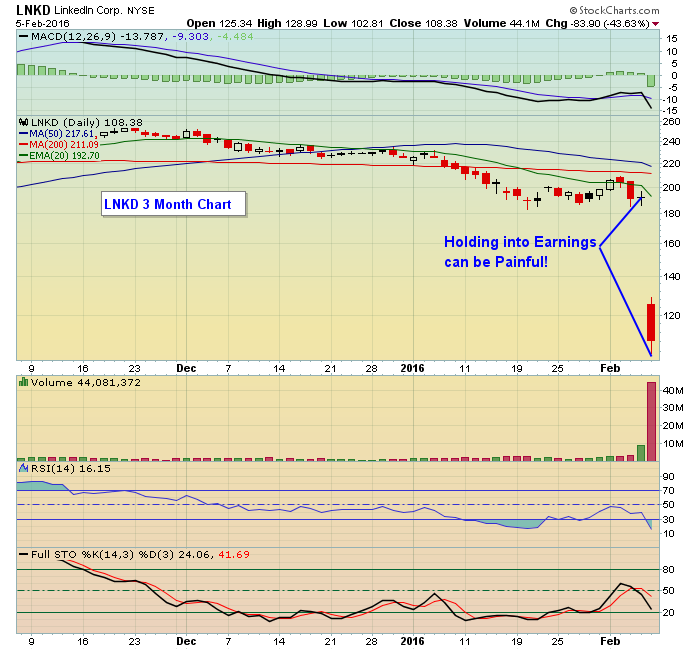
In Rocky Times Earnings REALLY Matter

by John Hopkins,
President and Co-founder, EarningsBeats.com
In the best of times companies see their stock prices rewarded or punished based on earnings results. Even when a company misses its earnings per share or revenue forecasts by just a small amount it can have a meaningful, negative impact on its stock price. But when the market is...
READ MORE
MEMBERS ONLY
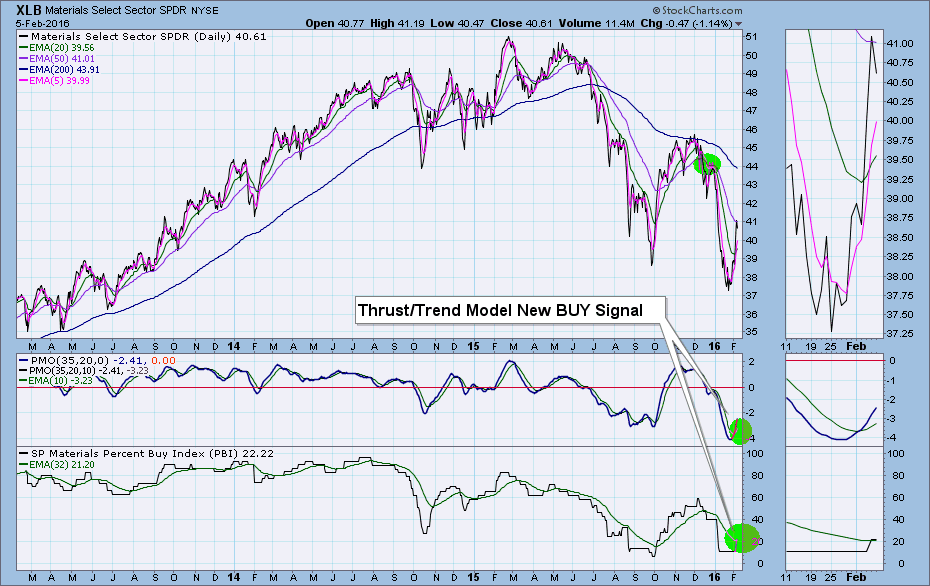
Materials SPDR (XLB) "Thrust" into BUY Signal
by Erin Swenlin,
Vice President, DecisionPoint.com
There has been renewed interest in the Percent Buy Index (PBI) ever since I spotlighted it during one of my webinars. The PBI is not related at all to the Bullish Percent Index (BPI). The PBI is Carl's creation, and it tracks the percentage of Price Momentum Model...
READ MORE
MEMBERS ONLY

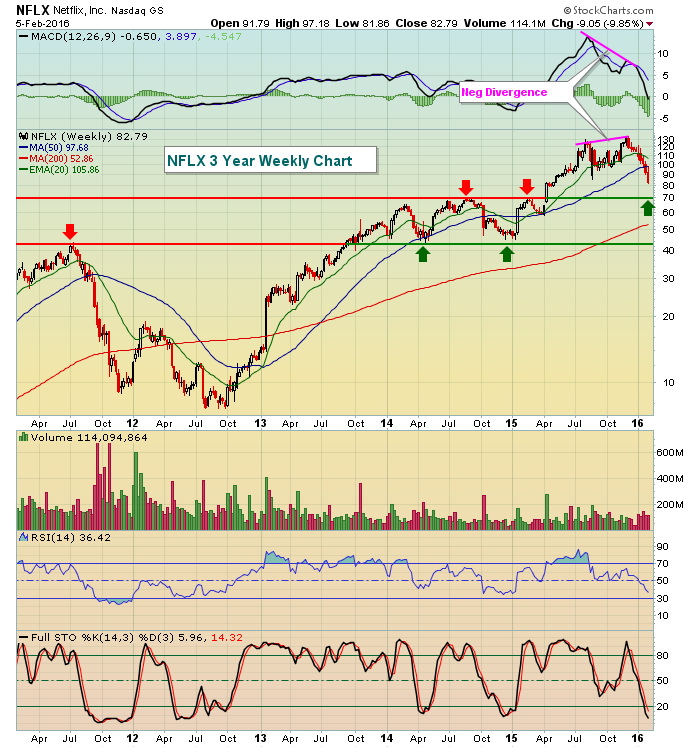
CONSUMER DISCRETIONARY AND TECHNOLOLGY STOCKS LEAD MARKET LOWER -- NASDAQ UNDERPERFORMANCE IS A BAD SIGN -- GOLD STOCKS HAVE A STRONG WEEK -- MONEY ALSO FLOWS TO UTILITIES, TELECOM, AND FOOD -- TYSON FOODS HITS RECORD HIGH -- NETFLIX TUMBLES BELOW SUPPORT
by John Murphy,
Chief Technical Analyst, StockCharts.com
CONSUMER DISCRETIONARY SPDR LEADS MARKET LOWER... It's never a good sign to see economically-sensitive stocks leading the market lower. That's because they're most closely tied to investor confidence (or lack therof) in the U.S. economy. But that's what happened this week....
READ MORE
MEMBERS ONLY
What You Need To Know About Trading A Bear Market?
by Tom Bowley,
Chief Market Strategist, EarningsBeats.com
There are no guarantees to this question, but we do have history and past technical indications to provide us a few guidelines. Trading strategies applied during a bull market simply won't work during a bear market. They may work on a few select industry groups and stocks, but...
READ MORE
MEMBERS ONLY
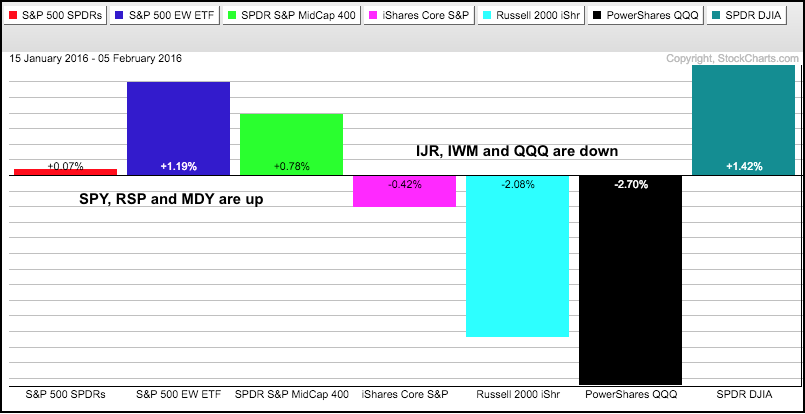
Small-caps, Finance and Tech Weigh on Market
by Arthur Hill,
Chief Technical Strategist, TrendInvestorPro.com
After sharp declines the first two weeks of the year, the stock market turned into one mixed up beast the last three weeks. The PerfChart below shows three-week performance for the seven major index ETFs. All seven were down 6+ percent the first two weeks of the year, but four...
READ MORE
MEMBERS ONLY

Point and Figure Pauses that Refresh
by Bruce Fraser,
Industry-leading "Wyckoffian"
Uptrends occasionally need a rest. We call these price congestion areas Reaccumulation trading ranges. Wyckoffians seek these areas out as an opportunity to get onboard the uptrend. Point and Figure analysis for Reaccumulations follow the conventions outlined in prior posts, with some minor variations. There is great value in becoming...
READ MORE
MEMBERS ONLY

NASDAQ LEADS MARKET INTO BAD END FOR THE WEEK -- INTERNET-RELATED STOCKS LEAD TECHNOLOGY SECTOR LOWER -- AMAZON.COM BREAKS 200-DAY AVERAGE -- THAT'S ALSO BAD FOR CONSUMER DISCRETIONARY STOCKS WHICH ARE BIG FRIDAY LOSERS
by John Murphy,
Chief Technical Analyst, StockCharts.com
NASDAQ LEADS MARKET LOWER ... A 3% loss in the Nasdaq market is pulling the rest of the market lower. Chart 1 shows the Nasdaq Composite Index bearing down on last week's low. The Nasdaq/S&P 500 ratio (below chart) has plunged to the lowest level in...
READ MORE
MEMBERS ONLY
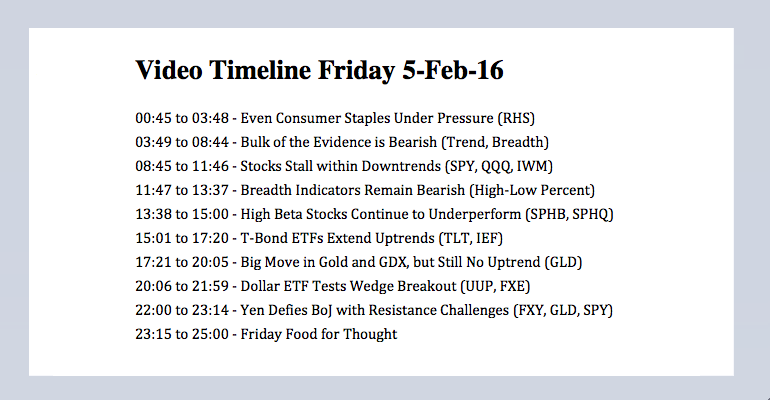
Staples Under Pressure - Weight of Evidence - Beta vs Quality - Gold-Dollar-Yen
by Arthur Hill,
Chief Technical Strategist, TrendInvestorPro.com
Even Consumer Staples are Under Pressure // Bulk of the Evidence is Bearish // Stocks Stall within Downtrends // Breadth Indicators Remain Bearish // High Beta Stocks Continue to Underperform // T-Bond ETFs Extend Uptrends // Big Move in Gold and GDX, but Still No Uptrend // Dollar Negates Wedge Breakout // Yen Defies BoJ with Resistance Challenges...
READ MORE
MEMBERS ONLY

My Pal Warren on the 10 Stages of Investing
by Gatis Roze,
Author, "Tensile Trading"
I’m a big fan of pithy quotes. When I teach my college class “Tensile Trading”, I use quotes extensively to help illustrate each of the essential 10 stages of stock market mastery. This week, I thought I’d have a guest blogger share his wisdom with respect to each...
READ MORE
MEMBERS ONLY
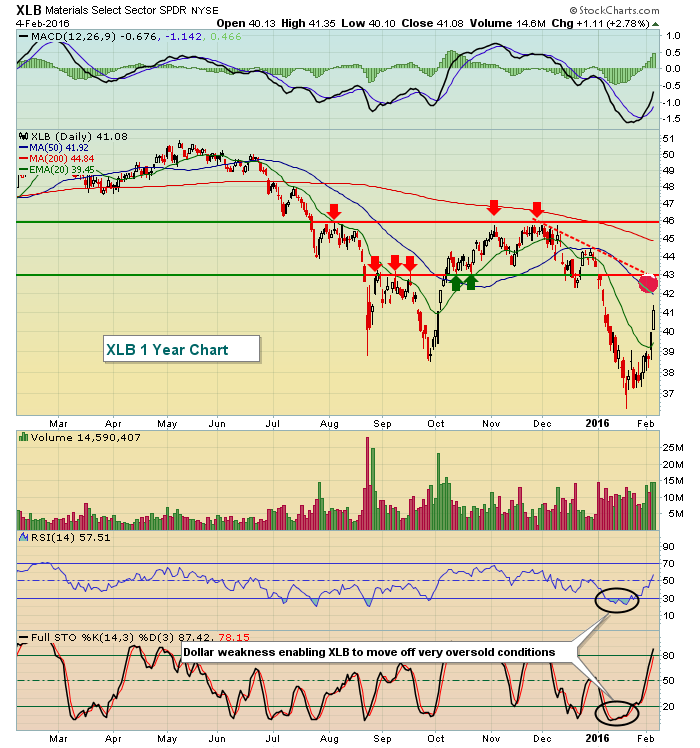
Tumbling Dollar Benefits Basic Materials
by Tom Bowley,
Chief Market Strategist, EarningsBeats.com
Special Note: I have joined Greg Schnell, "The Canadian Technician", in Phoenix, AZ for a few days and Greg will be hosting my Trading Places LIVE webinar both today and Monday. Greg will offer up his latest thoughts on commodities, which have been on fire, and we'...
READ MORE
MEMBERS ONLY
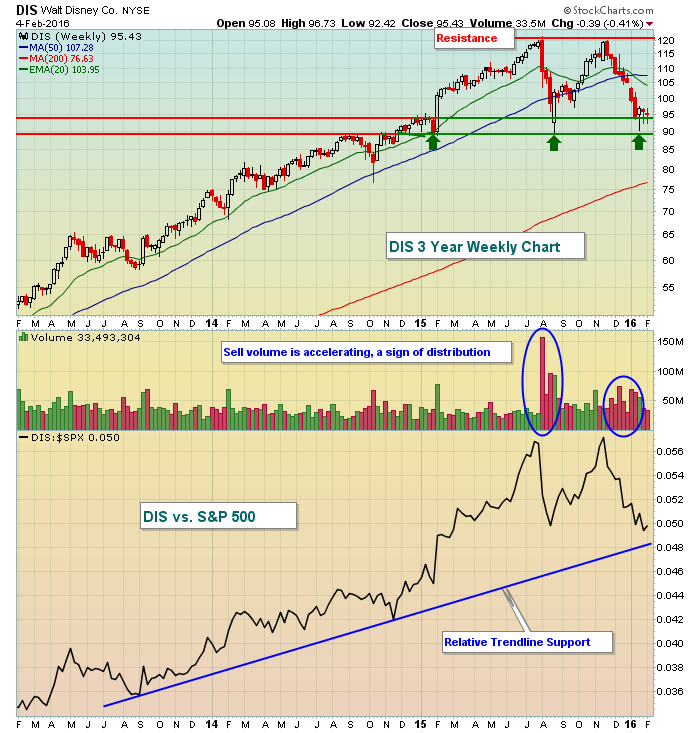
Disney Teetering At Critical Support
by Tom Bowley,
Chief Market Strategist, EarningsBeats.com
First, it's not helping that the consumer discretionary sector is down more than 10% over the past three months. This sector weakness has manifested itself in a very weak three month performance in Walt Disney (DIS) shares, which have fallen more than 15%. Currently, DIS trades near a...
READ MORE
