MEMBERS ONLY
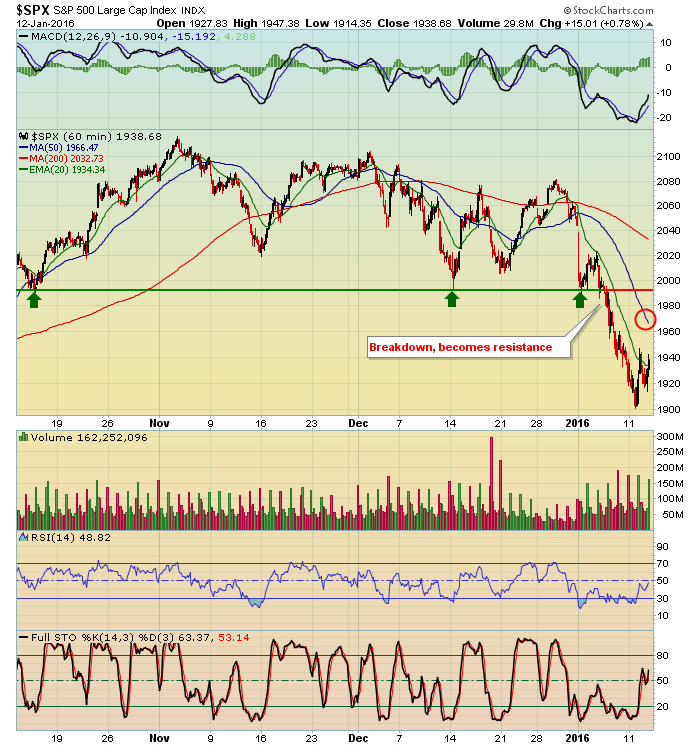
Stocks Rally Finally But....Huge Resistance Now Looms

by Tom Bowley,
Chief Market Strategist, EarningsBeats.com
Market Recap for Tuesday, January 13, 2016
There were a few positives regarding the rally on Tuesday. First, all of our major indices finished in the green for the first time in 2016. Whew! The better news is that aggressive areas of the market benefited most and that should provide...
READ MORE
MEMBERS ONLY
Oversold Indicators in a Bear Market

by Erin Swenlin,
Vice President, DecisionPoint.com
The S&P 500 entered a Long-Term Trend Model SELL signal last Friday. This occurred when the 50-EMA crossed below the 200-EMA. One issue that I noticed while preparing for one of my webinars is that not only are short-term indicators very oversold, but intermediate-term indicators are very oversold...
READ MORE
MEMBERS ONLY
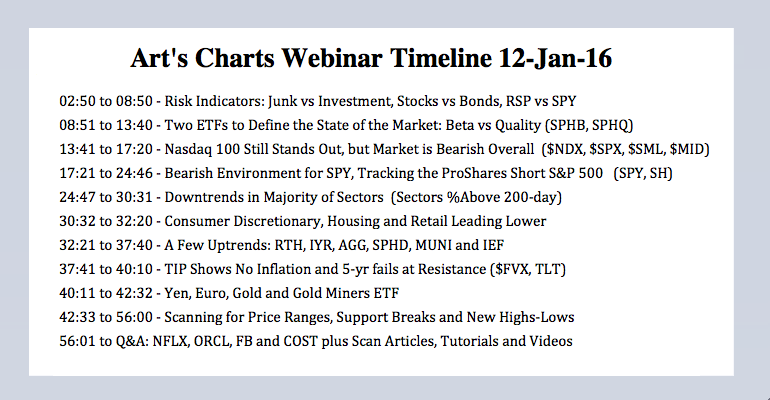
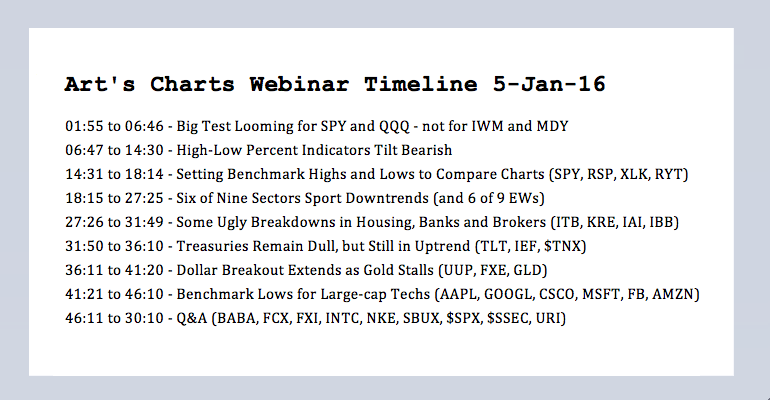
Bearish Trend Filter for SPY - Tracking the Short S&P 500 ETF - Webinar Recording

by Arthur Hill,
Chief Technical Strategist, TrendInvestorPro.com
Nasdaq 100 Still Stands Out // Bearish Environment for SPY // Tracking the ProShares Short S&P 500 // Webinar Highlights (Scans!) ////
Chartists can get an overview of the "market" by charting the S&P 1500, S&P 500, S&P MidCap 400, S&P Small-Cap...
READ MORE
MEMBERS ONLY
High VXN And Support Approaching
by Tom Bowley,
Chief Market Strategist, EarningsBeats.com
Market Recap for January 11, 2016
Monday was a bifurcated market in which we saw both the Dow Jones and S&P 500 rise for the session while the underperforming NASDAQ extended its losing streak to start the year. Both the NASDAQ and Russell 2000 have fallen more than...
READ MORE
MEMBERS ONLY
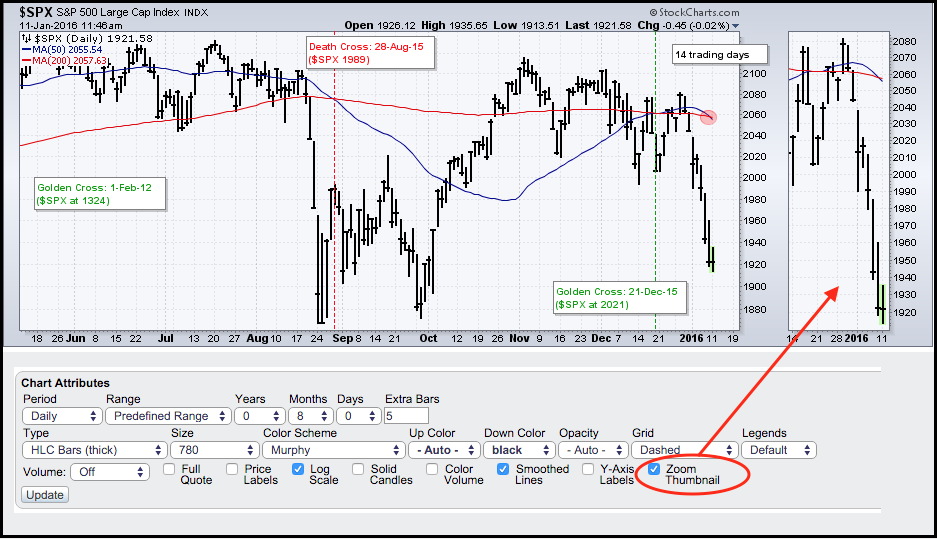
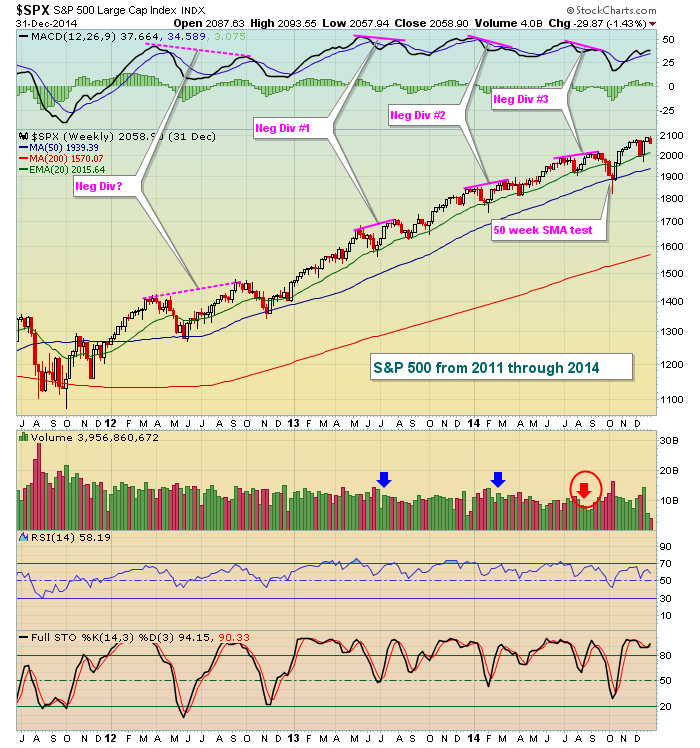
Another Death Cross Looms for the S&P 500
by Arthur Hill,
Chief Technical Strategist, TrendInvestorPro.com
Stocks took it on the chin over the last two weeks with the S&P 500 falling over 7% in just seven trading sessions (30-Dec to 8-Jan). The depth of this decline forced the 50-day moving average down and it is currently below the 200-day moving average. This death-cross,...
READ MORE
MEMBERS ONLY
Please Show Me A Bullish Long-Term Equity Chart

by Martin Pring,
President, Pring Research
* Europe, Asia and Latin America all look bearish
I am not kidding. Today I went through pretty well all of the country ETF charts looking back a few years with the long-term KST. I could find only one bullish chart as displayed here as Chart 1. As you can see...
READ MORE
MEMBERS ONLY
Market Is All About Defense
by Tom Bowley,
Chief Market Strategist, EarningsBeats.com
Market Recap for January 8, 2016
Honestly, most traders are probably just happy last week finally came to an end. While Monday through Wednesday consisted mostly of gaps with sideways trading intraday, we saw much more of a concerted selling effort the latter part of the week with bouts of...
READ MORE
MEMBERS ONLY
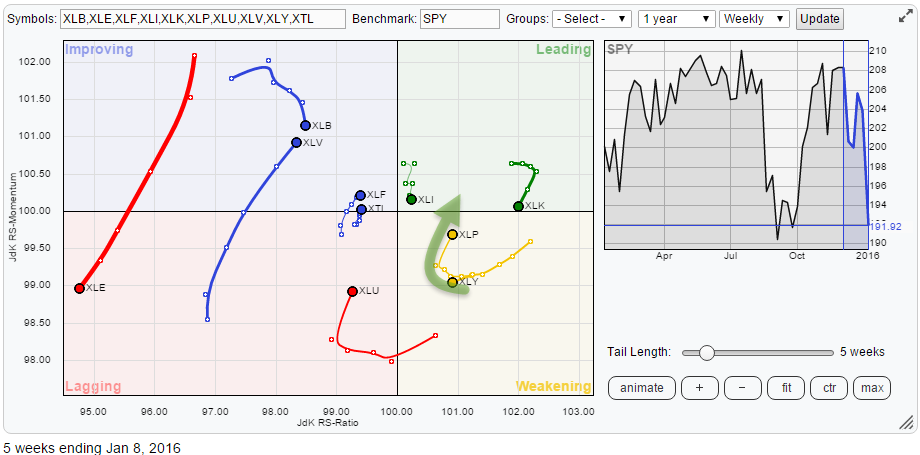
Price targets for SPY based on the relative strength of XLP.

by Julius de Kempenaer,
Senior Technical Analyst, StockCharts.com
Wow, what a start of the new year! Increased volatility sounds like an understatement.
In my previous blog on sector rotation in the US equity market, the Consumer Staples sector (XLP) popped up as potentially interesting, especially in relation to its counterpart consumer discretionary. Since the start of the new...
READ MORE
MEMBERS ONLY
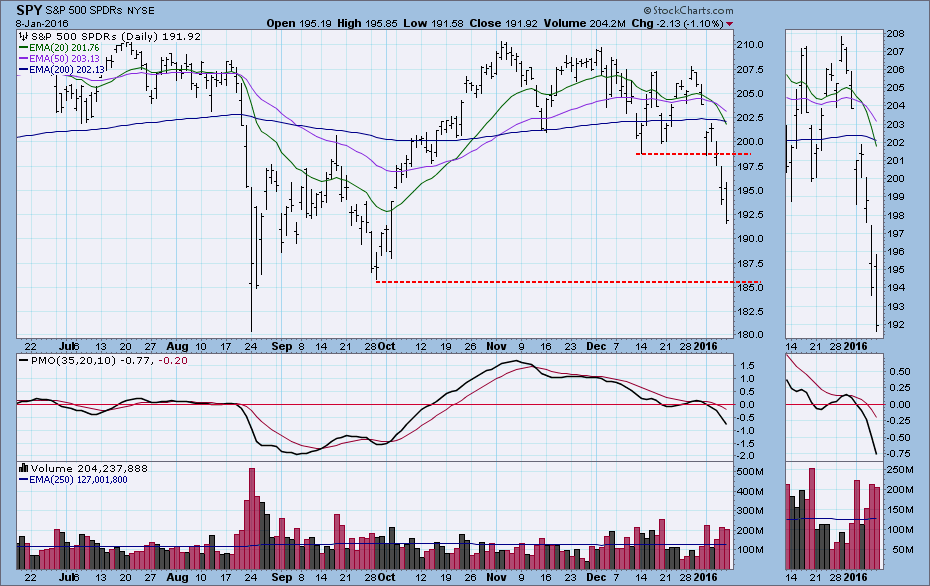
Are We There Yet?

by Carl Swenlin,
President and Founder, DecisionPoint.com
After a particularly brutal week, a lot of people are wondering if the correction is about over. The first place I look is the daily chart to see if there are any obvious support levels coming into play. We can see where price fell through support this week, and the...
READ MORE
MEMBERS ONLY

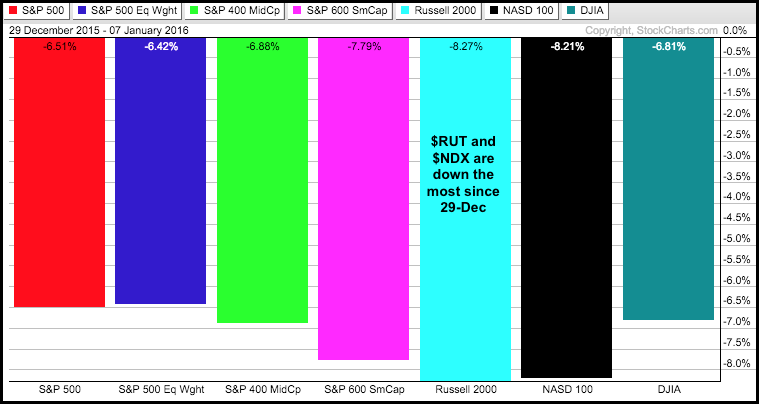
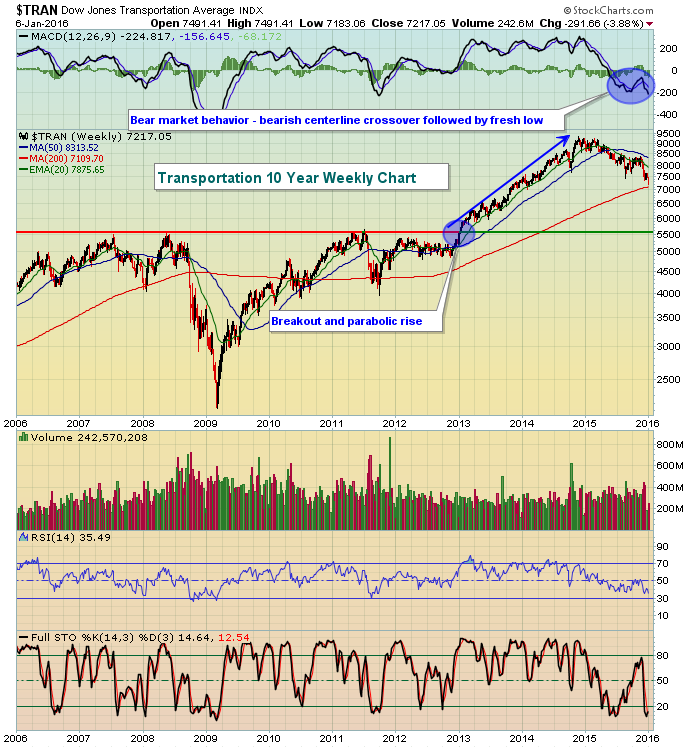
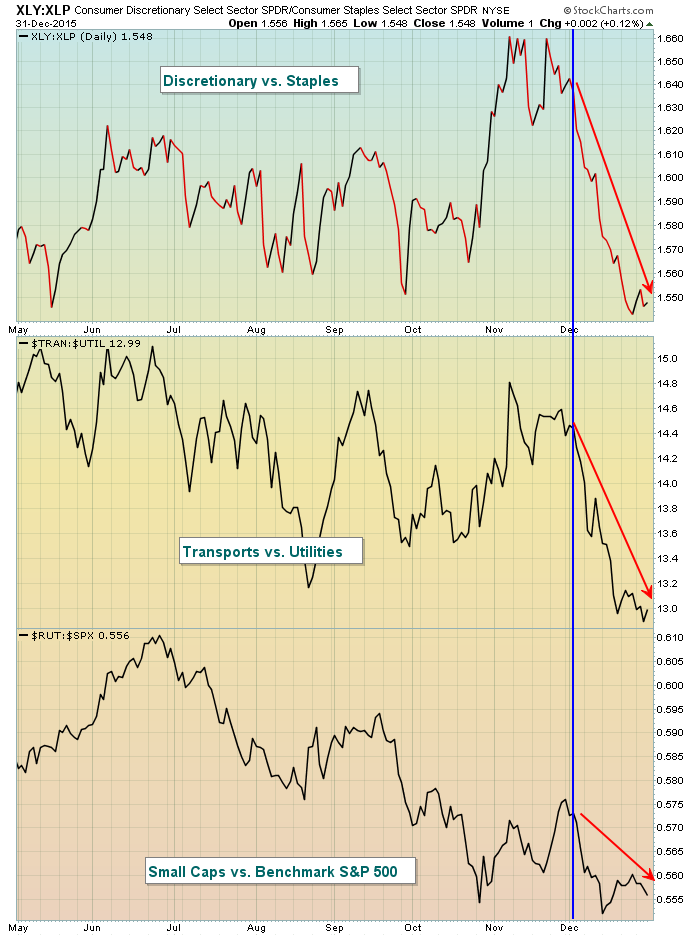
MAJOR U.S. STOCK INDEXES ENTER CORRECTION TERRITORY -- A RETEST OF 2015 LOWS APPEARS LIKELY -- SMALL AND MIDSIZE STOCKS HAVE ALREADY BROKEN THAT SUPPORT -- DOW TRANSPORTS ENTER BEAR MARKET TERRITORY -- DEFENSIVE UTILITES SHOW RELATIVE STRENGTH

by John Murphy,
Chief Technical Analyst, StockCharts.com
MAJOR STOCK INDEXES ENTER CORRECTION TERRITORY... After suffering the worst start to a new year in history, the U.S. stock market has entered correction territory which is defined by a drop of 10% from its old high. The charts pretty much speak for themselves. All three major stock indexes...
READ MORE
MEMBERS ONLY
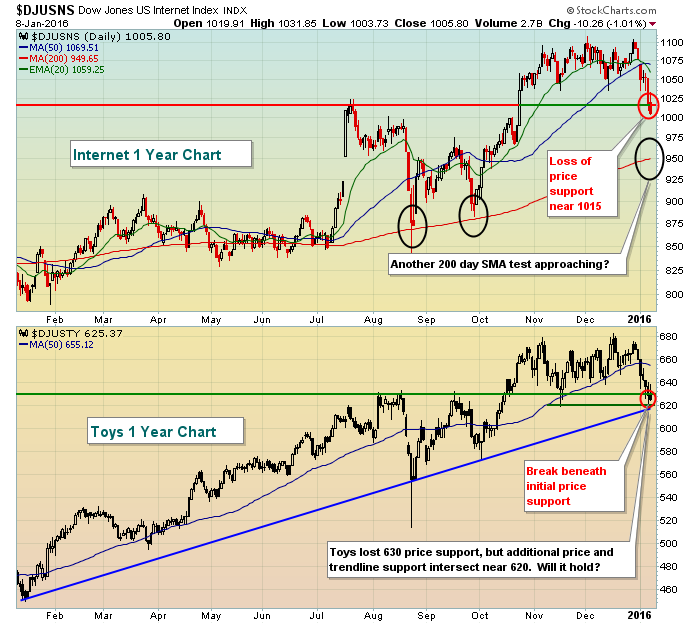
Last Two Key Industry Groups Break Support
by Tom Bowley,
Chief Market Strategist, EarningsBeats.com
Over the past year, the Dow Jones U.S. Internet Index ($DJUSNS) has risen 23% while the only industry group to outperform the DJUSNS has been the Dow Jones U.S. Toys Index ($DJUSTY), which has risen 31%. Last week's selling to open 2016 was strong enough to...
READ MORE
MEMBERS ONLY

Unlocking the Mysteries of Point and Figure Charts

by Bruce Fraser,
Industry-leading "Wyckoffian"
Point and Figure charts are familiar, but different. They have a relationship to classical bar charts while being unique. Their construction and interpretation requires skills that differ from traditional charting. And because of the mysteries of their construction, they yield information that other chart styles cannot. Namely, in our case,...
READ MORE
MEMBERS ONLY
IWM Hits New Low - High-Low Indicator Triggers for $SPX - Watch the Yen
by Arthur Hill,
Chief Technical Strategist, TrendInvestorPro.com
Large-caps Crack // S&P 500 Breaks 2K with Ease // IWM Hits 52-week Low // Using the Stochastic Oscillator to Gauge Price Levels // Small-caps and Mid-caps Lead New Low List // High-Low Percent Triggers for S&P 500 // IEF Holds Breakout as TLT Struggles // A Wild Ride for the Greenback // Watch...
READ MORE
MEMBERS ONLY

How I Deal with Trading Losses

by Gatis Roze,
Author, "Tensile Trading"
“I’m the only person I know that’s lost a quarter of a billion dollars in one year... It’s very character building.” -- Steve Jobs
I have to say this up front: I hate to lose. I work very hard not to lose. As Paul Newman said, “Show...
READ MORE
MEMBERS ONLY
The Bulls Need These Leading Industries To Hold Support
by Tom Bowley,
Chief Market Strategist, EarningsBeats.com
Market Recap for January 7, 2016
Once again the best performing sectors were the three defensive groups - utilities (XLU), consumer staples (XLP) and healthcare (XLV). All of our aggressive sectors tumbled anywhere from 2%-3% with technology leading the way. A number of industry groups within technology are either...
READ MORE
MEMBERS ONLY
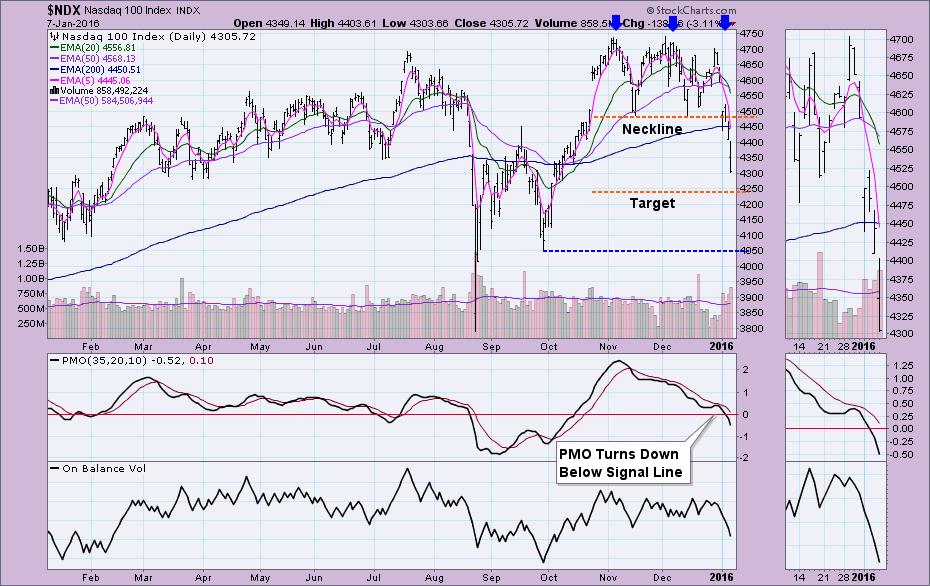
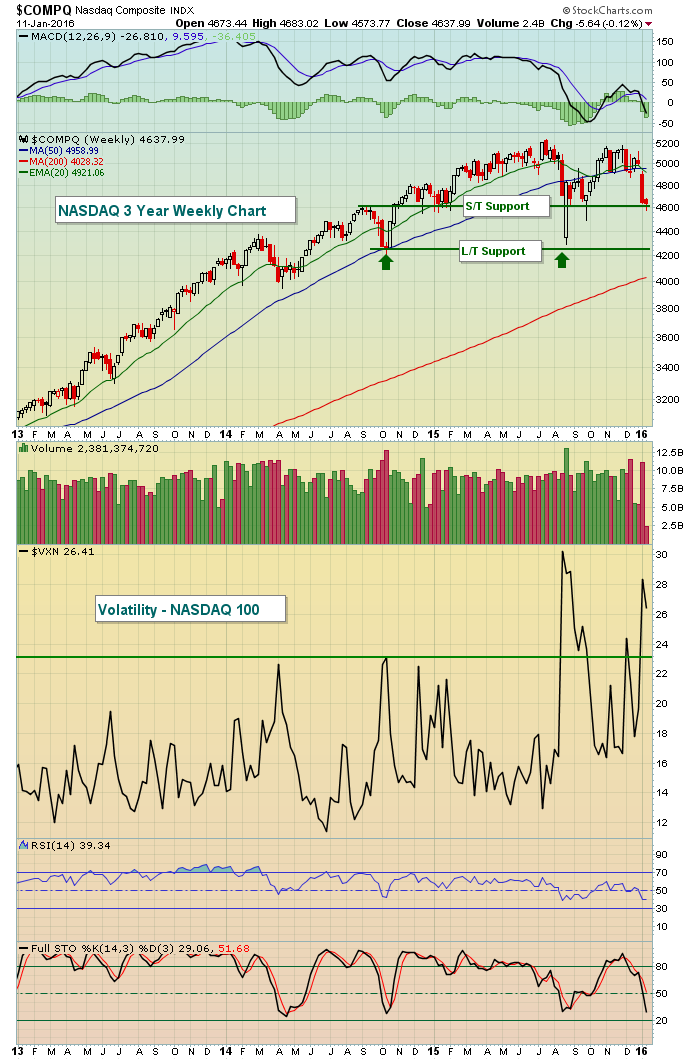
Nasdaq 100 and Techs Capitulate
by Erin Swenlin,
Vice President, DecisionPoint.com
The Nasdaq 100 (NDX) and technology stocks in general have avoided serious damage through the past year. The corrective move on the NDX in August never caused a 50/200-EMA negative crossover, meaning it avoided the DecisionPoint "bear market" label. This last corrective move, however, was very damaging....
READ MORE
MEMBERS ONLY

Long-Term Top Looking More And More Likely
by Martin Pring,
President, Pring Research
* Several historically reliable indicators are saying “bear”
* World stocks looking extremely toppy
* Shanghai may be forming a head and shoulders top
At my first webinar of the year on Tuesday, it seemed a good idea to load the presentation with some longer-term charts, as they are all pointing to trouble...
READ MORE
MEMBERS ONLY
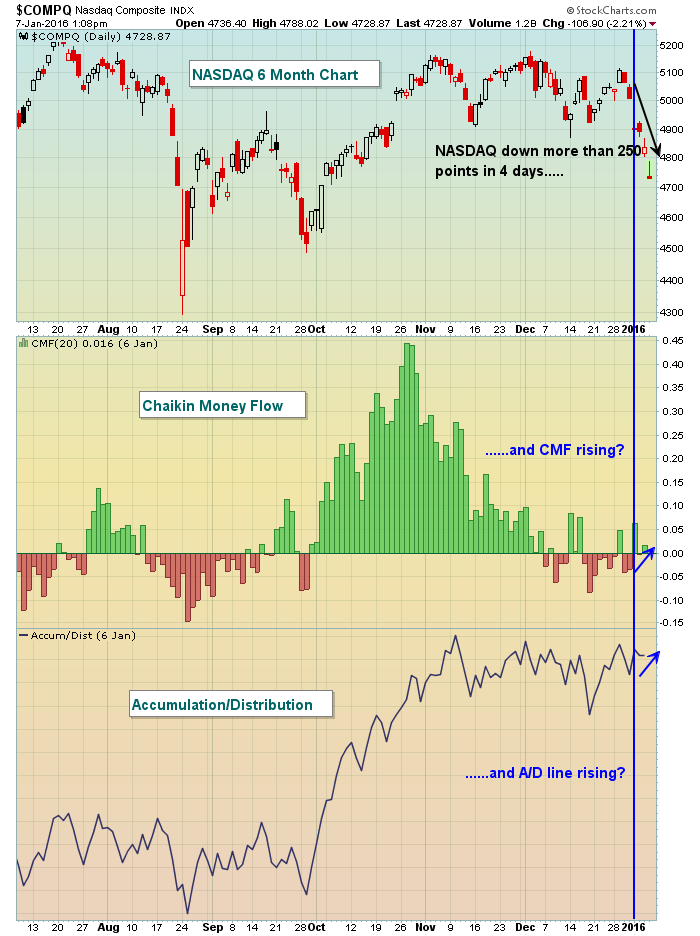
NASDAQ Tumbling; Chaikin Money Flow and Accum/Dist Line Rising - Huh?
by Tom Bowley,
Chief Market Strategist, EarningsBeats.com
If you've ever used the Chaikin Money Flow (CMF) or Accumulation/Distribution (AD) as indicators to help gauge buying and selling pressure, just make a note that gaps to both the upside and downside are ignored in their calculations. Let's take the NASDAQ Composite as an...
READ MORE
MEMBERS ONLY
Don't Blame China - Sector Shift Hurts Large-caps - Treasuries Outperform
by Arthur Hill,
Chief Technical Strategist, TrendInvestorPro.com
Don't Blame China for December // Sector Shift Defines Large-cap Breakdown // Industrials and Finance Leading Lower // XRT and ITB Break Down Further // Gold Miners ETF Bounces off Support // Treasuries Surge and Outperform ////
Don't Blame China for December
Stocks extended their 2016 plunge with further losses early Thursday....
READ MORE
MEMBERS ONLY
Futures Tumble; Dow Jones Down 400 Points
by Tom Bowley,
Chief Market Strategist, EarningsBeats.com
Market Recap for January 6, 2016
If the stock market could avoid the opening bell catastrophes, the action in 2016 wouldn't be bad at all. Thus far this year, the NASDAQ has had net gap downs of 173 points on a cumulative basis. Trading from 9:30am EST...
READ MORE
MEMBERS ONLY

GLOBAL STOCKS RESUME SELLING -- U.S. STOCK RALLY HAS BEEN TOO NARROW AND VULNERABLE TO A DOWNSIDE CORRECTION -- GAP BETWEEN SMALL AND LARGE CAPS IS A WARNING SIGN -- SO IS THE DROP TO 40% IN THE NYSE BULLISH PERCENT INDEX
by John Murphy,
Chief Technical Analyst, StockCharts.com
SMALL CAPS ARE LEADING LARGE CAPS LOWER... Global stocks have started the year on a bad note. Most of that is being blamed on China. A plunge in Chinese stocks and a drop in the Chinese yuan to a five-year low are certainly causing a lot of worries in global...
READ MORE
MEMBERS ONLY
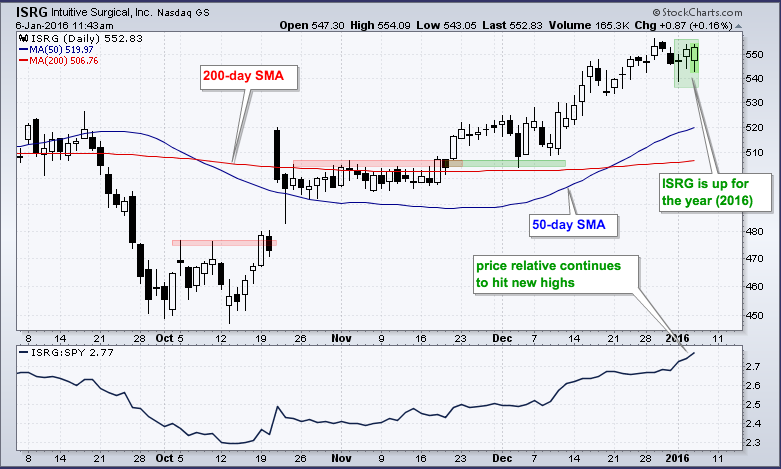
Intuitive Surgical Gets off to a Strong Start
by Arthur Hill,
Chief Technical Strategist, TrendInvestorPro.com
Not many stocks are currently up year to date and those that are show good relative strength in the face of broad selling pressure. Of the 1500 stocks that make up the S&P 500, S&P MidCap 400 and S&P Small-Cap 600, I count around...
READ MORE
MEMBERS ONLY
Plummeting Futures Confirm Poor Tuesday Leadership
by Tom Bowley,
Chief Market Strategist, EarningsBeats.com
Market Recap for Tuesday, January 5, 2016
Let's start with the good news. After a big selloff on Monday morning, the U.S. stock market rallied into the close to print reversing candles across most of our major indices, sectors and industry groups. That was followed up with...
READ MORE
MEMBERS ONLY
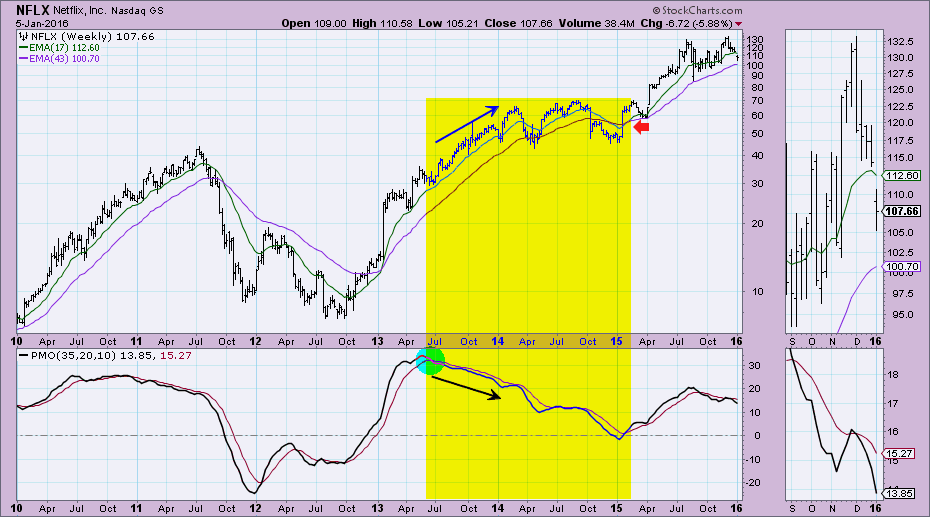
Weekly PMO Question on Netflix (NFLX)
by Erin Swenlin,
Vice President, DecisionPoint.com
My favorite part of my webinars is the "Question of the Day". I welcome emails and comments from my readers as you challenge me to think outside of the box or clarify my analysis. So here is today's question from Bryant regarding the weekly Price Momentum...
READ MORE
MEMBERS ONLY

DEFENSIVE STOCKS CONTINUE TO SHOW LEADERHIP -- KIMBERLY CLARK LEADS STAPLES HIGHER -- UTILITIES AND REITS CONTINUE TO GAIN GROUND -- KIMCO REALTY JUMPS 3% -- AUTOS HELP PULL CONSUMER DISCRETIONARY SPDR LOWER -- GENERAL MOTORS BREAKS 200-DAY LINE
by John Murphy,
Chief Technical Analyst, StockCharts.com
CONSUMER STAPLES ARE HOLDING UP ... Last Wednesday's message showed that money was flowing toward defensive stocks, which meant that investors were ending the old year in a more cautious mood. That mood is continuing into the new year. With the stock market on the defensive during the first...
READ MORE
MEMBERS ONLY
Webinar Video - Last 3 Sectors Standing - Dollar Gets Bull Signal
by Arthur Hill,
Chief Technical Strategist, TrendInvestorPro.com
A Tale of Two S&P 500 Indices // The Last Three Sectors Standing // Sector Breadth Tilts Bearish // Index High-Low Indicators Remain Split // Short-term Bullish Signal for Dollar // Treasury Trading Turns Dull // Webinar Video ////
The easiest way to visualize the current split in the market is by comparing the S&...
READ MORE
MEMBERS ONLY
CGMBI-Non-Internal Breadth Indicators-Chap 11

by Greg Morris,
Veteran Technical Analyst, Investor, and Author
This is the final article highlighting the chapters and indicators in my new second edition of The Complete Guide to Market Breadth Indicators. This is a completely new chapter as I did not include non-internal breadth in the first edition; I stuck with internal breadth only. Don’t ask me...
READ MORE
MEMBERS ONLY
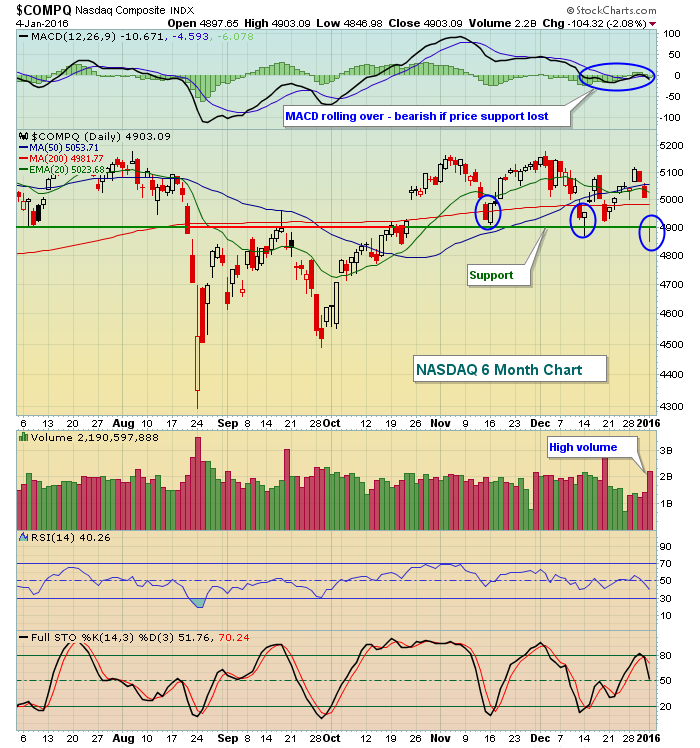
S&P 500 Tests Key Support For Third Time
by Tom Bowley,
Chief Market Strategist, EarningsBeats.com
Market Recap for Monday, January 4, 2016
China's Shanghai Composite ($SSEC) sent global markets lower on Monday after the SSEC shred nearly 7% of its value. Asian markets tumbled and those losses triggered sizable gaps lower in Europe and here in the U.S. A late rally in...
READ MORE
MEMBERS ONLY
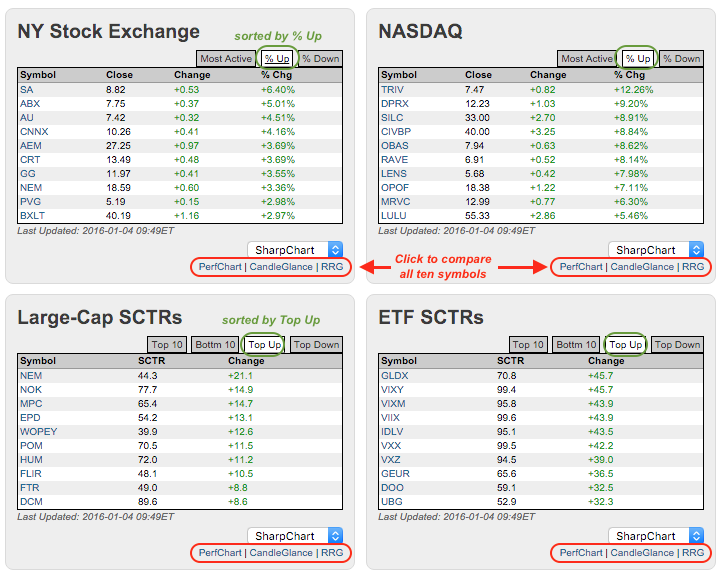
Gold Stocks and ETFs Buck the Selling Pressure
by Arthur Hill,
Chief Technical Strategist, TrendInvestorPro.com
Stocks were hit hard on the open of the first trading day of 2016 with the vast majority falling, and falling sharply. There were a few pockets of strength and chartists can find these using the tables on the home page (midway down). The screenshot, which was taken around 9:...
READ MORE
MEMBERS ONLY
Futures Point To Ugly Start To 2016
by Tom Bowley,
Chief Market Strategist, EarningsBeats.com
Market Recap for Thursday, December 31, 2015
Happy New Year! The action on Thursday to close out the year symbolized trading throughout all of 2015. We were down early, rallied to try to move into positive territory and then fell again in the second half of the session to finish...
READ MORE
MEMBERS ONLY
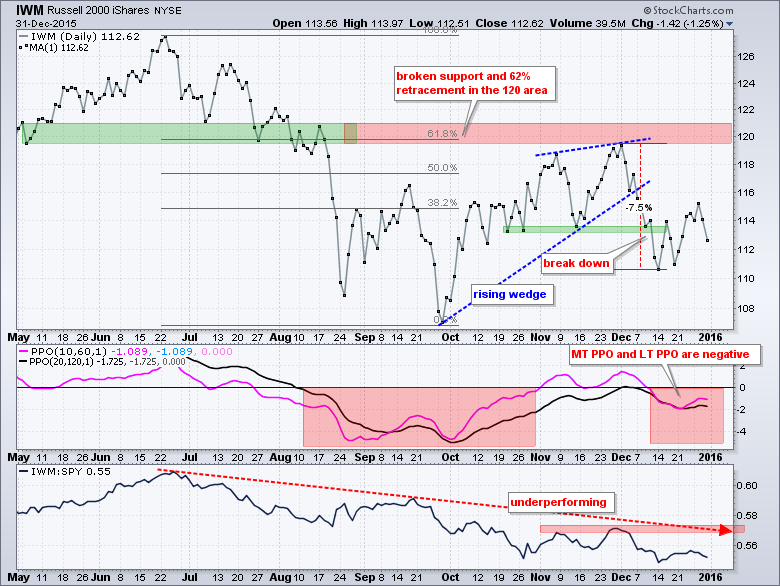
Small and Mid Caps Struggle - IWM Breaks Down - SPY Sets Up Important Test
by Arthur Hill,
Chief Technical Strategist, TrendInvestorPro.com
Once again, we have small-caps and mid-caps breaking down and weighing on the market. This is nothing new because the Russell 2000 iShares (IWM) and S&P MidCap SPDR (MDY) have been lagging the S&P 500 SPDR (SPY) and Nasdaq 100 ETF (QQQ) for the last six...
READ MORE
MEMBERS ONLY
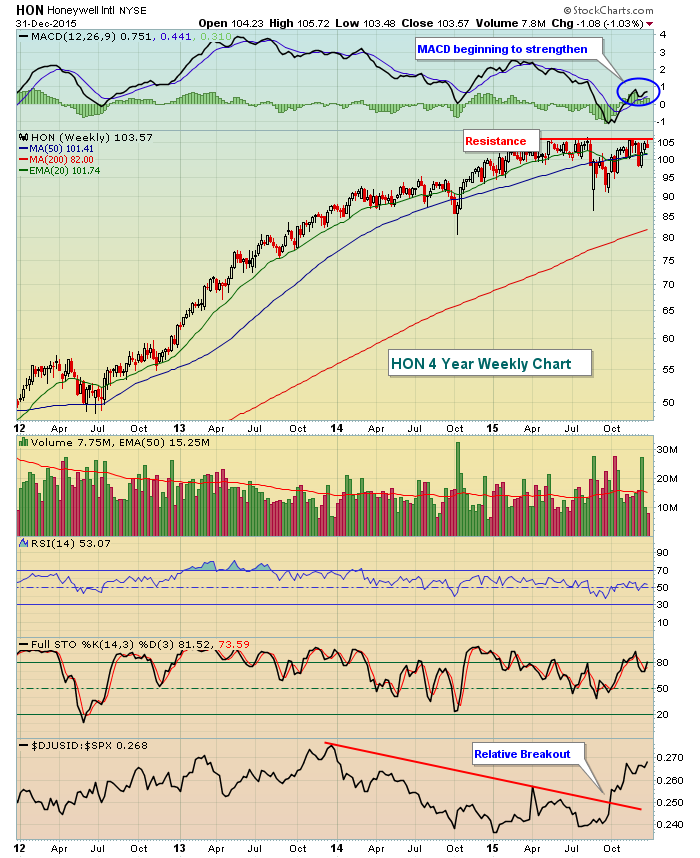
Honeywell Looking For A Happy New Year
by Tom Bowley,
Chief Market Strategist, EarningsBeats.com
Honeywell (HON) is part of the diversified industrials ($DJUSID) that saw excellent relative strength in the fourth quarter of 2015. General Electric (GE) reported excellent quarterly results in October and moved to its highest level in 15 years last week. HON appears to be on a path to do the...
READ MORE
MEMBERS ONLY
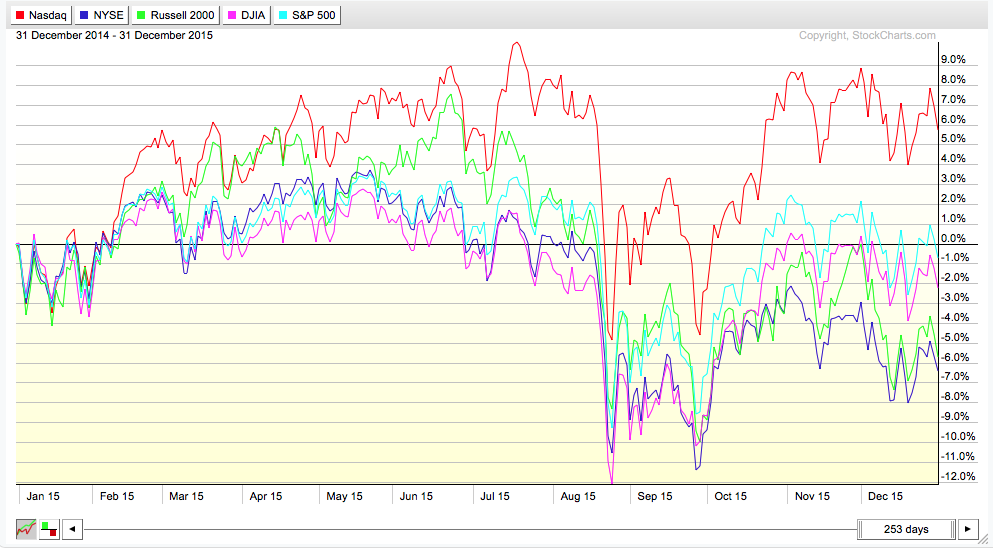
Looking Back and Looking Forwards into 2016!
Hello Fellow ChartWatchers!
Happy New Year to you and yours. Here are the results for last year in PerfChart form:
All-in-all, bleh. The Nasdaq outperformed everyone else - mainly because of a spurt back in February. In reality, everything has been negative since the start of March. When both the...
READ MORE
MEMBERS ONLY
Preparing for Potential Shifts

by John Hopkins,
President and Co-founder, EarningsBeats.com
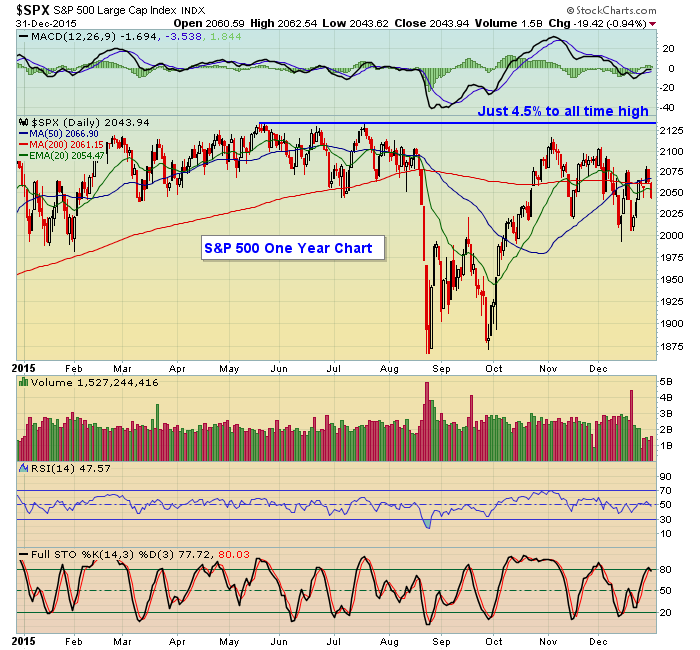
The S&P ended 2015 down slightly from the close in 2014. But to many traders, it sure felt like a downer of a year.
At EarningsBeats.com we combine strong fundamentals with strong technicals to try to find the best reward to risk trading candidates for our members,...
READ MORE
MEMBERS ONLY
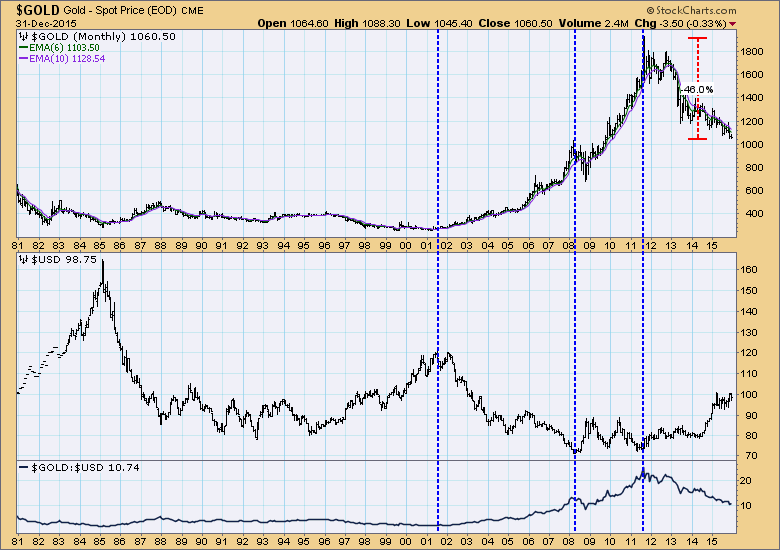
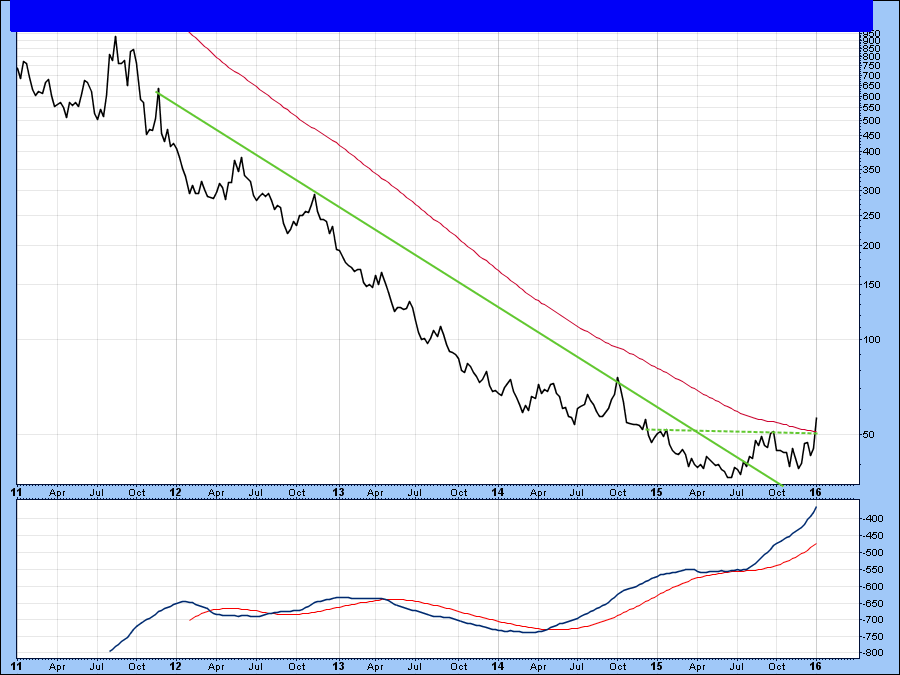
Gold Versus the Dollar Long Term
by Carl Swenlin,
President and Founder, DecisionPoint.com
There is an inverse relationship between gold and the dollar, but it is far from exact. A weak or strong dollar will influence the price of gold in the opposite direction, but gold can also have internal strength or weakness that is a reflection of the fluctuating demand for gold....
READ MORE
MEMBERS ONLY
2016 Leadership: Where Should We Look?
by Tom Bowley,
Chief Market Strategist, EarningsBeats.com
2015 was a very difficult year. We witnessed our first serious selling since 2011. It's unusual to trade in a bull market for four years with little interruption, yet that's exactly what we did. Despite not breaking down, the trading environment was quite challenging in 2015....
READ MORE
MEMBERS ONLY
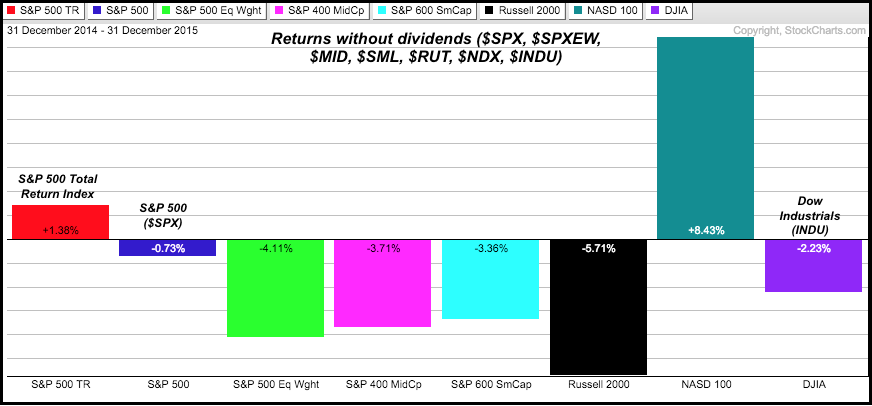
Do Dividends Matter?
by Arthur Hill,
Chief Technical Strategist, TrendInvestorPro.com
Depending on how you measure it, the stock market was up, down or flat in 2015. It also depends on what you call the stock market. Is it the S&P 500, S&P 500 Equal-Weight Index, the Dow, the Russell 2000, the Nasdaq? Truth be told, it...
READ MORE
MEMBERS ONLY
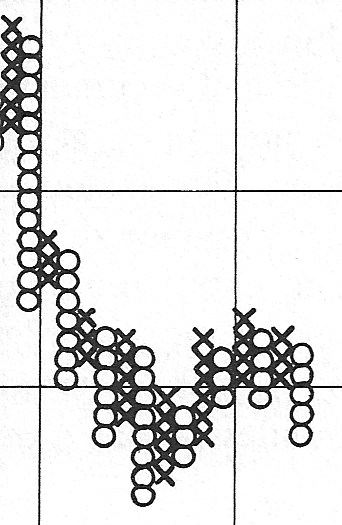
Intro to Point and Figure Construction
by Bruce Fraser,
Industry-leading "Wyckoffian"
As we enter 2016, it seems like a good opportunity to introduce Point and Figure chart construction. In future posts we will spend more and more time on the techniques of PnF counting using the Wyckoff Method. We will create a foundation for the process of creating PnF charts that...
READ MORE
MEMBERS ONLY

Powerful and Profitable Pairings: 1 + 1 = 3
by Gatis Roze,
Author, "Tensile Trading"
For myself, one of the most momentous insights into life and investing happened over 25 years ago when Sir John Templeton, who was exceptional as both an investor and a human being, talked about the profound importance of pairings in determining the quality of one’s life. There are infinite...
READ MORE
MEMBERS ONLY

Did The Market Go Up or Down In 2015?
by Martin Pring,
President, Pring Research
* This week’s bearish two-bar reversal threatens a bullish seasonal for equities
* Airlines may be set to join railroads and truckers on the downside
* Dollar Index keeps us guessing, which means the next move is likely to be worthwhile
* Pound completes a bearish long-term head and shoulders
The title of...
READ MORE
