MEMBERS ONLY

Here Are the Past Eight Market Corrections (I've Been Through Six of Them)

by Gatis Roze,
Author, "Tensile Trading"
Straight from the pages of my own trading journal. These are my charts from all the market corrections since 1981. Here’s why I want to share these with you.
The beauty of technical analysis is that it represents human emotions expressed by the buying and selling behavior of investors...
READ MORE
MEMBERS ONLY

3 STRIKES AND A TREND CHANGE, S&P 500 FORMS BIG HAMMER, JUNK BONDS UNDERPERFORM INVESTMENT BONDS, STOCKS UNDERPERFORM BONDS, AVERAGE STOCKS UNDERPERFORMS LARGE CAP STOCKS, THE DAMAGE IS NOT UNDONE, MID-CAP AND SMALL-CAP AD LINES HIT NEW LOWS

by John Murphy,
Chief Technical Analyst, StockCharts.com
3 STRIKES AND A TREND CHANGE... Link for today's video. There has certainly been a lot of noise the last two weeks and this makes it a good time to look at some weekly charts for a little perspective. We will start with the S&P 500...
READ MORE
MEMBERS ONLY

Bear Market Rules Refresher

by Erin Swenlin,
Vice President, DecisionPoint.com
I spent a good portion of my Wednesday webinar, DecisionPoint LIVE! discussing "Bear Market Rules". Given the Dow has now officially entered a bear market (50-EMA cross below the 200-EMA) and other indexes preparing to follow, I thought it would be an excellent time for a refresher for...
READ MORE
MEMBERS ONLY
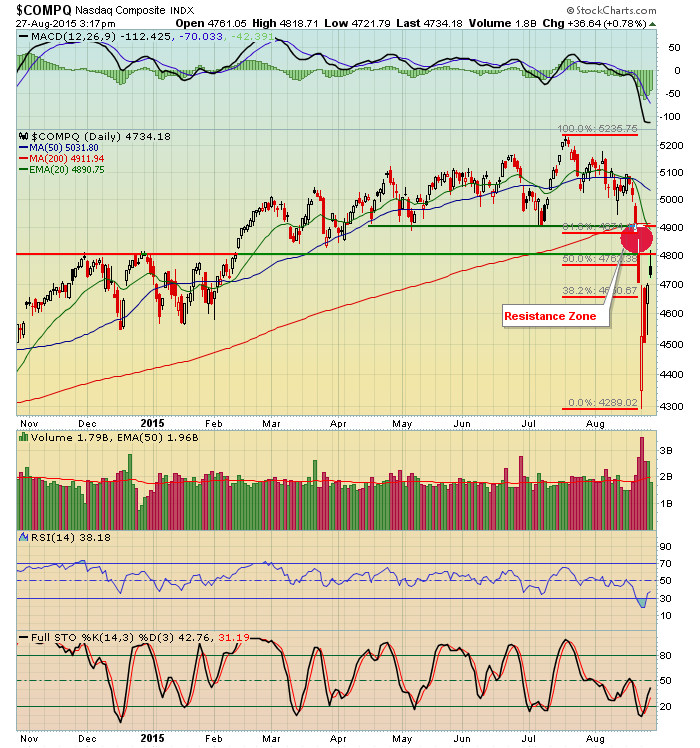
Bulls' First Test: FAIL

by Tom Bowley,
Chief Market Strategist, EarningsBeats.com
While we cannot rule out the possibility of a sustained advance to clear technical hurdles, the first attempt today was an epic fail at or just below a critical short-term resistance zone. Given the high volume selling over the past 7-10 days and loss of key price support levels and...
READ MORE
MEMBERS ONLY

GLOBAL STOCK BOUNCE CONTINUES -- OVERSOLD CHINESE STOCKS SHOW SOME BOUNCE -- EEM AND EAFE ISHARES BOUNCE OFF CHART SUPPORT -- SELLING IN TREASURIES, THE EURO, AND YEN SHOWS MORE CONFIDENCE
by John Murphy,
Chief Technical Analyst, StockCharts.com
CHINESE STOCKS REBOUND... Global stocks opened higher this morning from deeply oversold conditions. In many cases, those rebounds have also taken place from potential support levels. Chinese shares in Hong Kong and Shanghai jumped 3.6% and 5.3% respectively. That also relieved selling pressure around the globe. While it&...
READ MORE
MEMBERS ONLY
Setting Upside Targets, RSI Resistance, A Selling Climax in XLE?, Oil forms Two Inside Days, ITB Tests Support Zone, Four ETFs Showing Some Relative Chart Strength, Bond Update. Precious Metals Dim, Base Metals Extend Downtrend

by Arthur Hill,
Chief Technical Strategist, TrendInvestorPro.com
Setting Upside Targets for the Big 3
We are going to start with some candlestick charts so chartists can see the volatility of the last few days. There are few things to note overall. First, stocks became very oversold after sharp declines from August 18th to August 24th (five trading...
READ MORE
MEMBERS ONLY

STOCK INDEXES ARE TRYING TO HOLD LAST OCTOBER'S LOW -- MORE BACKING AND FILLING IS NEEDED TO REPAIR TECHNICAL DAMAGE -- SAMPLES OF PREVIOUS CORRECTION BOTTOMS -- LONG-TERM UPTREND IS STILL INTACT
by John Murphy,
Chief Technical Analyst, StockCharts.com
DOW TRIES TO HOLD LAST OCTOBER'S LOW... My Saturday message suggested that U.S. stock indexes could drop to last October lows; but that those lows should hold if this is just a market correction (and not a major top). Chart 1 shows the Dow Industrials trying to...
READ MORE
MEMBERS ONLY
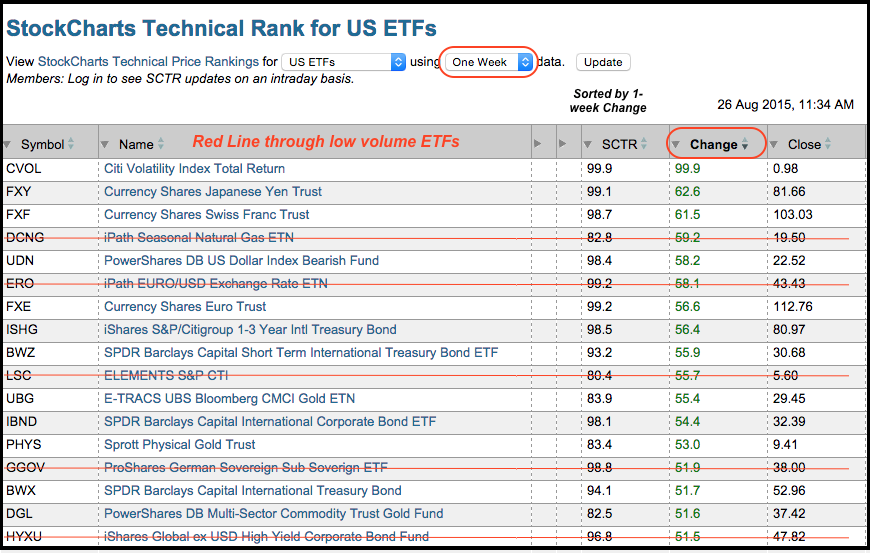
SCTRs Surge for Non-Stock ETFs (Yen, Euro, Volatility, Gold and Bonds)
by Arthur Hill,
Chief Technical Strategist, TrendInvestorPro.com
There has been a big changing of the guard over the last few weeks as stock alternatives gained in relative rankings. The table below shows the StockCharts Technical Rank (SCTR) for our ETF universe, which excludes inverse and leveraged ETFs. It is sorted by the one-week change for the SCTR....
READ MORE
MEMBERS ONLY
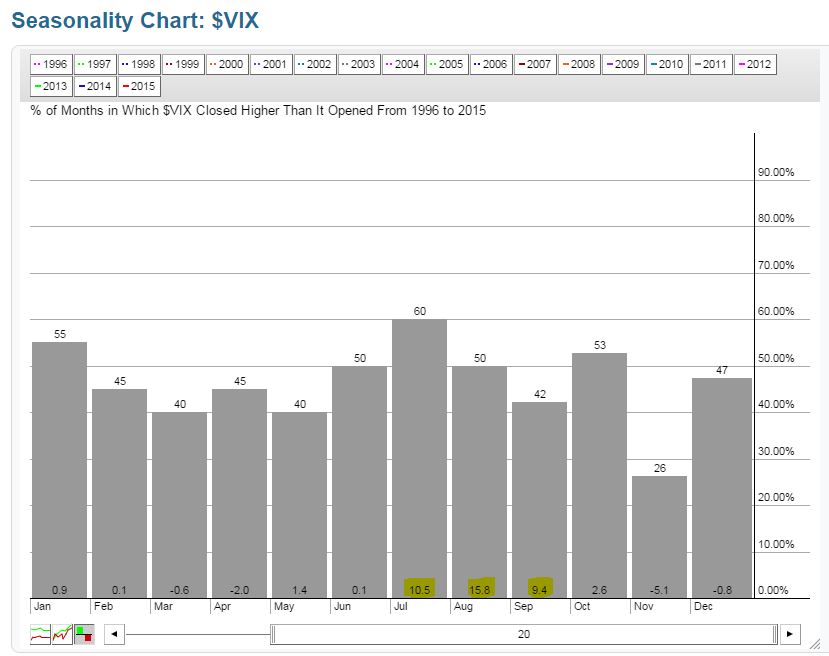
Volatility Explodes, Major Tests Ahead
by Tom Bowley,
Chief Market Strategist, EarningsBeats.com
Welcome to August. Don't look now, but September is right around the corner. Given the recent short-term price support breakdowns and explosion in the Volatility Index ($VIX), we have to be very careful as we make our way through the next month as historically the market has shown...
READ MORE
MEMBERS ONLY
Advance Decline Misc. Indicators (Chapter 6, CGMBI)

by Greg Morris,
Veteran Technical Analyst, Investor, and Author
CH 6 Advance Decline Miscellaneous
The breadth indicators in the section could not be categorized as using the difference or the ratio of the advances and declines, so they are in the miscellaneous section.
Advance Decline Miscellaneous Indicators
Advances / Issues Traded
Advance Decline Divergence Oscillator
Advance Decline Diffusion Index
Breadth...
READ MORE
MEMBERS ONLY
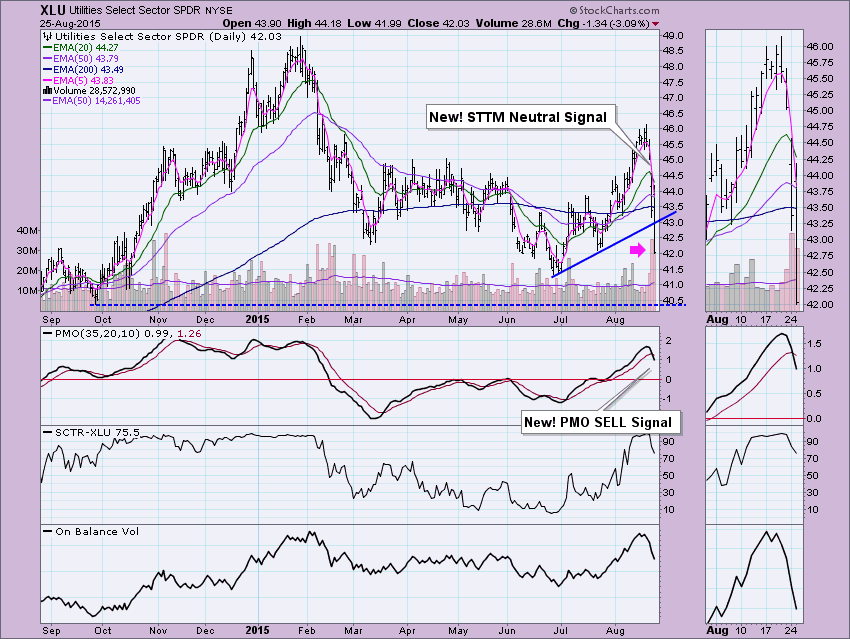
Utilities Washing Out
by Erin Swenlin,
Vice President, DecisionPoint.com
I receive technical alerts whenever there are DecisionPoint signal changes on the ETFs and Indexes that we cover in the DecisionPoint Market/Sector Summary. Today, while there were only a few, they were centered around the Utilities sector. The two utilities ETFs that we cover are the Utilities SPDR (XLU)...
READ MORE
MEMBERS ONLY
Index Table Turns Deep Red, Does a Day Make a Difference?, Sector Table Turns Majority Red, First Resistance for Tech, Discretionary and Finance SPDRs, Utilities Take the Lead (for now), REITs Break Down, Careful of Panic, Webinar Topics
by Arthur Hill,
Chief Technical Strategist, TrendInvestorPro.com
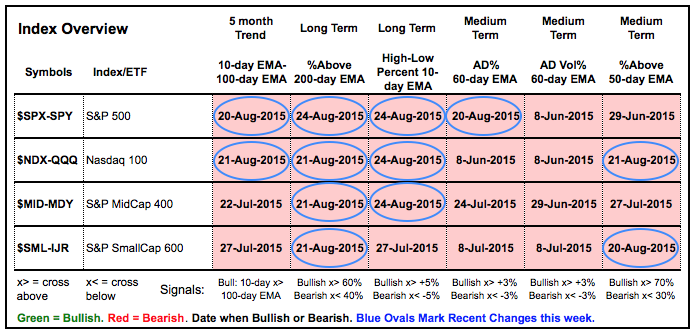
Index Table Turns Deep Red
The charts and commentary are part of Tuesday's webinar. Click here for the recording. Unsurprisingly, the breadth-trend table has turned decidedly bearish over the last few days. The blue ovals mark the breadth indicators that turned bearish this past week. Last Tuesday, this...
READ MORE
MEMBERS ONLY
Whipsaw Decline Or The Start Of The Right Shoulder?

by Martin Pring,
President, Pring Research
* Monday’s action suggests a short-term rally is in the cards.
* Action by the S&P 48-month ROC argues for a bear market.
Catching a falling knife with your bear hands is never fun. Sorry, Freudian slip. Should be bare hands! I am not going to try to call...
READ MORE
MEMBERS ONLY
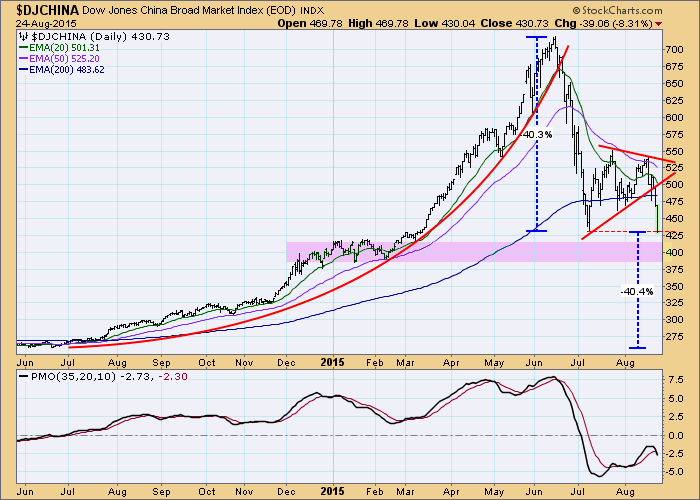
China Did It!

by Carl Swenlin,
President and Founder, DecisionPoint.com
In early August I wrote an article about China's stock market crash, wherein I stated, "It is incomprehensible to me that such action in China will have no effect elsewhere in the global financial markets." Actually, it has been having effect on global markets, and last...
READ MORE
MEMBERS ONLY
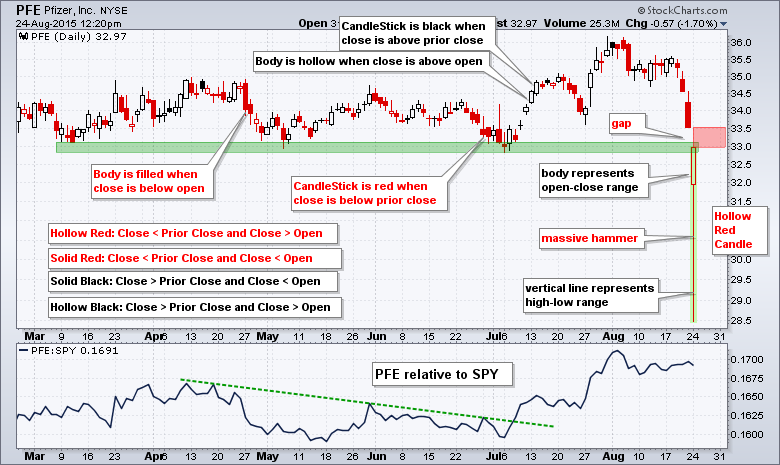
Massive Hollow Red Hammers Taking Shape
by Arthur Hill,
Chief Technical Strategist, TrendInvestorPro.com
Stocks opened weak, plunged after the open and then recovered around midday. The Dow dipped below 15500 in the morning and then moved back to the 16200 area by noon ET. The opening gap, deep dip and recovery mean that several stocks could form big hammers today. These are short-term...
READ MORE
MEMBERS ONLY

GRAY MONDAY, BULK OF THE EVIDENCE HAS TURNED, TREND IN FORCE UNTIL, MARKING FIRST RESISTANCE, NIKKEI BREAKS, FTSE HITS 30-MONTH LOW, DAX AND CAC TREND LOWER, EURO AND YEN SURGE
by John Murphy,
Chief Technical Analyst, StockCharts.com
GRAY MONDAY REARS ITS UGLY HEAD... Stocks are in the midst of a global rout that is turning into another Black Monday - of sorts. So far, there have been three Black Mondays in stock market history. The first was on October 28th, 1929, when the Dow fell 13%. This...
READ MORE
MEMBERS ONLY
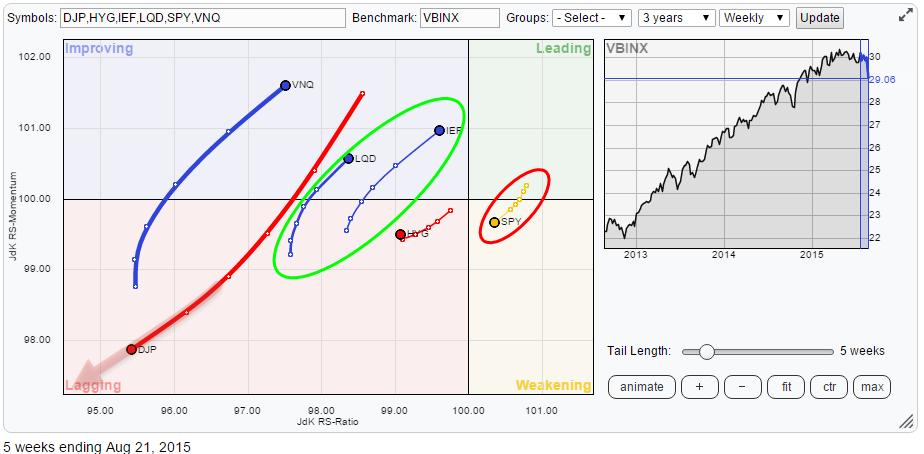
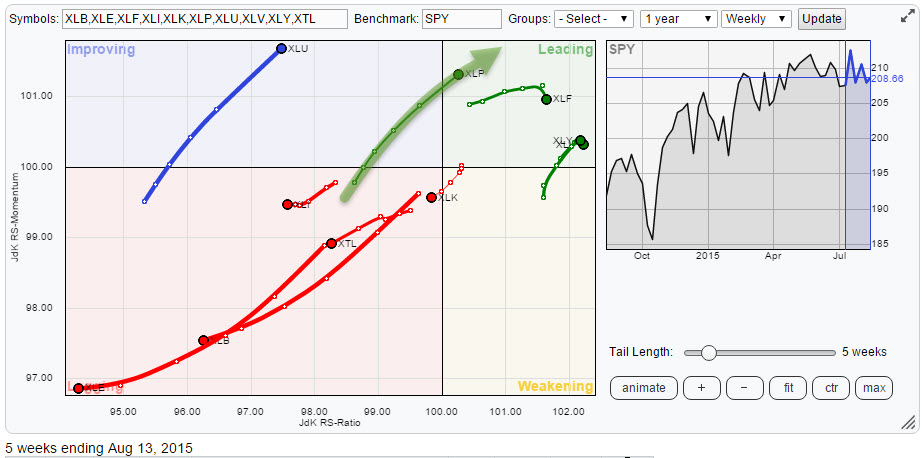
Ok, SPY is falling .... now what ?

by Julius de Kempenaer,
Senior Technical Analyst, StockCharts.com
Wow, there's a lot going on in the markets and some big shifts seem to be under way in asset class rotation as well as in (international) equity markets rotation. Relative Rotation Graphs may help you get a handle to put all this movement into (relative) perspective. Let&...
READ MORE
MEMBERS ONLY

STOCKS HAVE ENTERED WAVE 4 CORRECTION -- 2015 DOWNTURN CLOSELY MATCHES 2011 CORRECTION WHICH BOTTOMED IN OCTOBER -- TO KEEP THE LONG-TERM UPTREND INTACT, LAST OCTOBER'S LOWS HAVE TO HOLD -- VIX INDEX SURGES TO NEW 2015 HIGH
by John Murphy,
Chief Technical Analyst, StockCharts.com
AN ELLIOTT WAVE UPDATE ... My market message from July 9 offered my Elliott Wave analysis of the NYSE Composite Index. Chart 1 is an updated version of that view. The five red numerals show a five-wave advance from its 2011 bottom. My view was that the May peak in the...
READ MORE
MEMBERS ONLY

Take the Fork in the Road

by Bruce Fraser,
Industry-leading "Wyckoffian"
Modern American sage, Yogi Berra, advises that when we come to a fork in the road we should take it. When stopping action stalls the price of a stock (commodity, ETF, etc.) a fork in the road is dead ahead. As Wyckoffians we are confronted with either the conditions of...
READ MORE
MEMBERS ONLY

The Triple Crown of Investing: Motivation, Confidence, Action
by Gatis Roze,
Author, "Tensile Trading"
As many of you know who’ve taken my Tensile Trading seminar or watched the DVD, the tenth stage of stock market mastery pulls together all previous nine stages. As the title of this blog suggests, Stage 10 incorporates all three essential ingredients: motivation, confidence and action. Successful investors must...
READ MORE
MEMBERS ONLY

EW S&P 500 ETF CONFIRMS REVERSAL PATTERN, QUANTIFYING SELLING DISPERSION, SMALL-CAPS LEAD AD LINES LOWER, NASDAQ 100 LEADS NEW LOW EXPANSION, BANKS, BROKERS AND RETAILERS BREAK DOWN, SEVERAL ASIAN INDICES ARE IN BEAR MARKETS
by John Murphy,
Chief Technical Analyst, StockCharts.com
EW S&P 500 ETF CONFIRMS REVERSAL PATTERN... Programming Note: We are having technical difficulties with the screen recording software and there is no video today. I apologize and will get it fixed this weekend. The Equal-Weight S&P 500 ETF (RSP) is a good ETF to use...
READ MORE
MEMBERS ONLY

Major Equity Market Breakdowns Warn of Lower Prices to Come
by Martin Pring,
President, Pring Research
* McClellan Volume Model for NASDAQ goes bearish.
* EEM breaks down from a major top.
* Chinese equities are right on the brink.
The last time I wrote about equities, two weeks ago, I pointed out the dearth of breadth. I also mentioned that following the end of the 'bullish end-of-the-month&...
READ MORE
MEMBERS ONLY
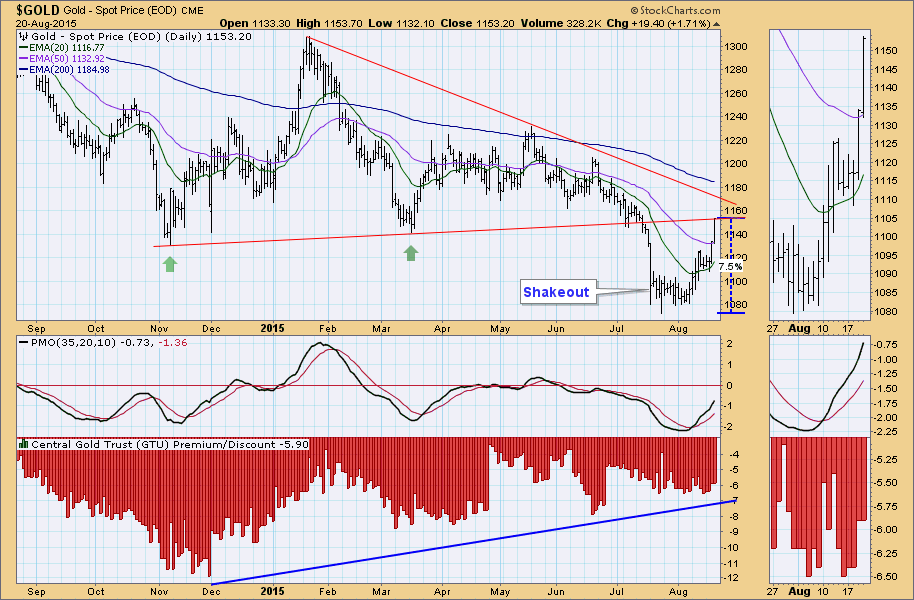
Gold Seeing Enthusiastic Rally
by Carl Swenlin,
President and Founder, DecisionPoint.com
After months of sagging prices, gold ($GOLD) is finally coming back to life. From the July low it has rallied +7.5%. After a promising November/March double bottom, the subsequent rally failed, support was broken, and new lows were made in July. In view of the current rally, that...
READ MORE
MEMBERS ONLY

FTSE ALL WORLD INDEX FALLS BELOW SUPPORT TO DEEPEN CORRECTION -- U.S. SUFFERS MORE TECHNICAL DAMAGE AS SEVERAL STOCK INDEXES FALL TO SIX-MONTH LOWS -- THE S&P 500 FALLS BELOW 200-DAY AVERAGE
by John Murphy,
Chief Technical Analyst, StockCharts.com
FTSE ALL WORLD INDEX FALLS TO SEVEN-MONTH LOW... Global stock selling is intensifying. Big losses are seen in developed and emerging markets in Asia, Europe, and the Americas. And more technical damage is being done. Chart 1 shows the FTSE All World Index (which includes the U.S.) falling below...
READ MORE
MEMBERS ONLY
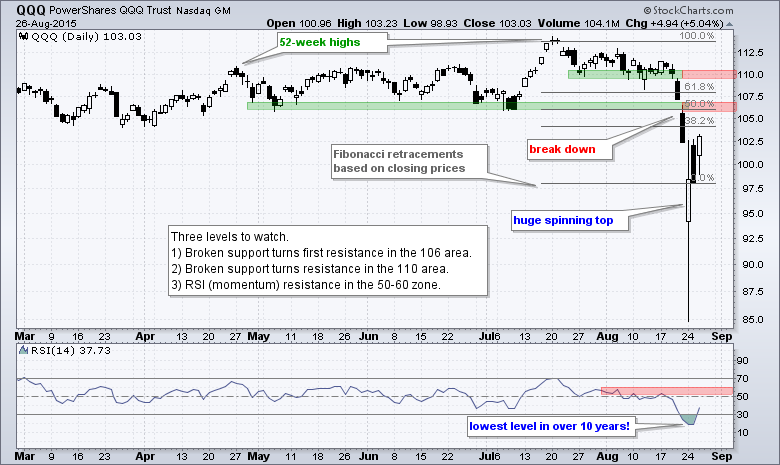
SPY-QQQ Head for Support Test, A Head-and-Shoulders Reversal for RSP?, Technology Sector Weakens Further, Second Shoes Drop for Media and Semis, Gold Target, Treasury Yield Hits a Wall, BroadCom Hits Retracement Zone as Facebook Corrects
by Arthur Hill,
Chief Technical Strategist, TrendInvestorPro.com
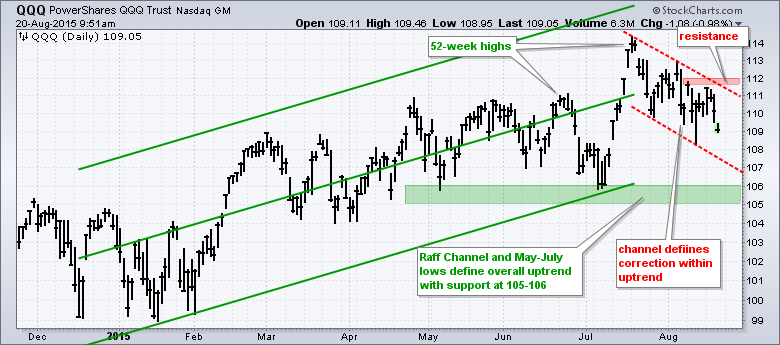
The major index ETFs remain in corrective mode, but two of the four are close to breaking long-term support levels. The challenge with corrections is we never know which corrections will evolve into bigger downtrends. As the charts now stand, QQQ and SPY hit new highs in mid July and...
READ MORE
MEMBERS ONLY
Can Apple (AAPL) Save Computer Hardware?
by Tom Bowley,
Chief Market Strategist, EarningsBeats.com
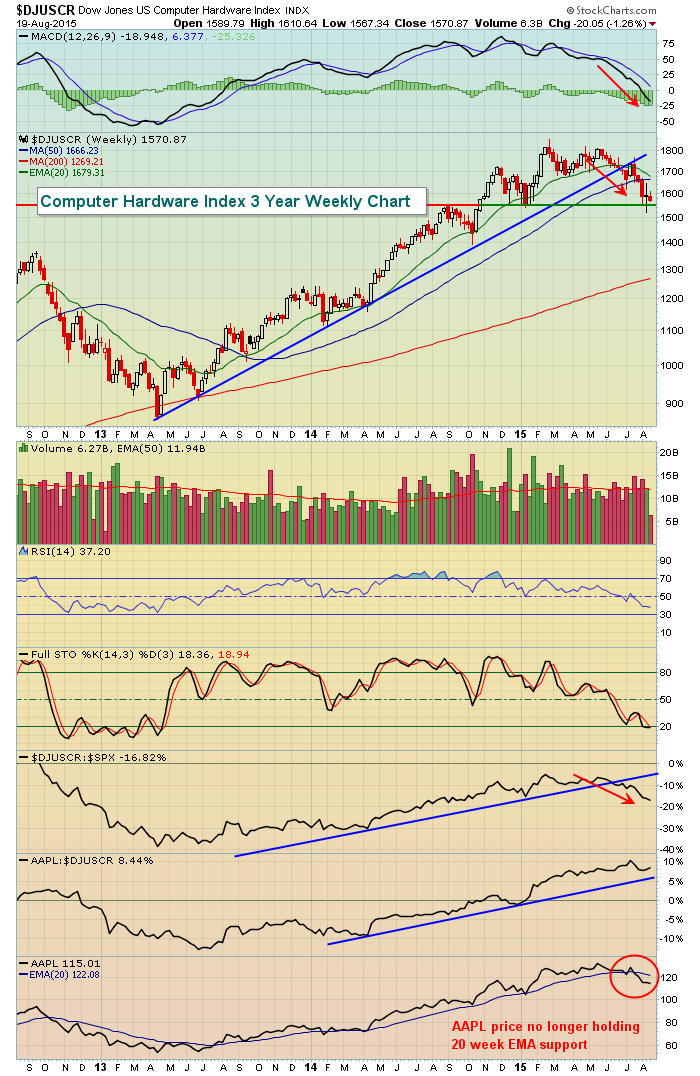
The Dow Jones U.S. Computer Hardware Index ($DJUSCR) is testing significant price support created by the breakout in the fourth quarter of 2014 and the subsequent retracement back to that level just three months later. Recent weakness in Apple (AAPL) shares, along with other computer hardware stocks, has this...
READ MORE
MEMBERS ONLY

GLOBAL STOCKS REMAIN UNDER PRESSURE -- EAFE ISHARES DROP BELOW 200-DAY AVERAGE -- EMERGING MARKET ISHARES FALL TO TWO YEAR LOWS -- NYSE COMPOSITE INDEX STILL LOOKS BEARISH -- SO DO MARKET BREADTH FIGURES
by John Murphy,
Chief Technical Analyst, StockCharts.com
EAFE ISHARES FALL BELOW 200-DAY AVERAGE... The trend in global stocks continues to weaken. As usually happens sooner or later, weakness in foreign markets is starting to weigh more heavily on the U.S. Chart 1 shows EAFE iShares (EFA) falling below its 200-day today for the first time since...
READ MORE
MEMBERS ONLY
Yes, Virginia, there Really Is Information in Stock Prices
by Arthur Hill,
Chief Technical Strategist, TrendInvestorPro.com
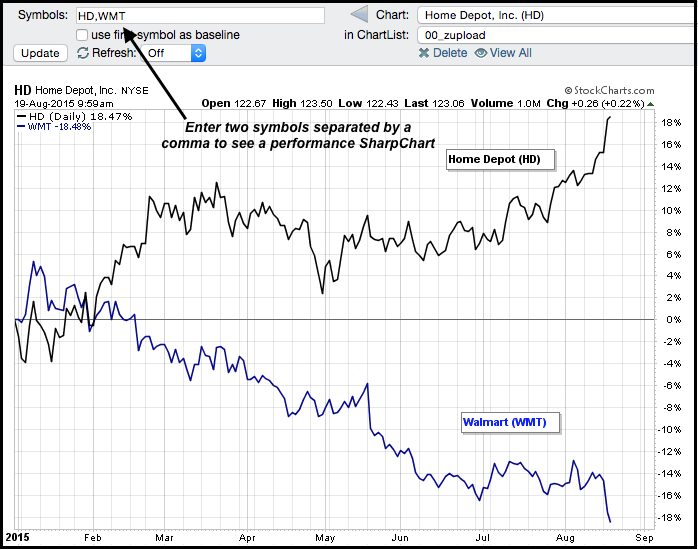
Just ask HD and WMT. These two big retail stocks are part of the Dow Industrials and the S&P 500. Despite a common industry group, the performance for these two stocks could not be any more different. The chart below shows year-to-date performance for Home Depot (HD) and...
READ MORE
MEMBERS ONLY
Big Commodities Rally Coming?
by Carl Swenlin,
President and Founder, DecisionPoint.com
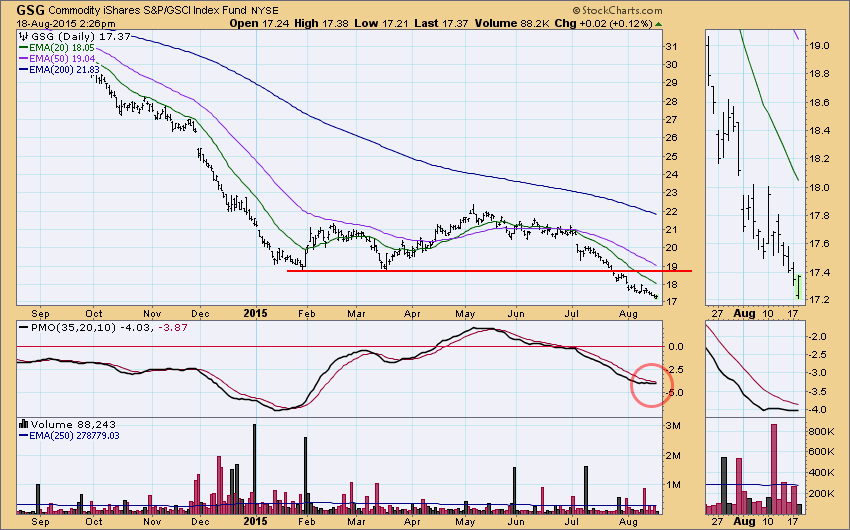
I have seen a couple of comments around the Internet speculating that a big commodities rally is coming. Let's look at a few charts to see if there is anything to back that up. We'll use the Commodities iShares (GSG) as a surrogate for commodities. On...
READ MORE
MEMBERS ONLY

Webinar Recording, Sector Weightings Still Bullish, MidCaps Perk Up, Consumer Discretionary Hangs Tough, A Breakout in HealthCare, 3 Correcting ETFs, 7 Strong ETFs, Stocks to Watch
by Arthur Hill,
Chief Technical Strategist, TrendInvestorPro.com
Today's webinar and commentary will take a top down look at the stock market. First, the index table with the breadth indicators shows a split market with half bullish and half bearish. The sector table, however, still tilts towards the bulls with five of the nine sectors in...
READ MORE
MEMBERS ONLY
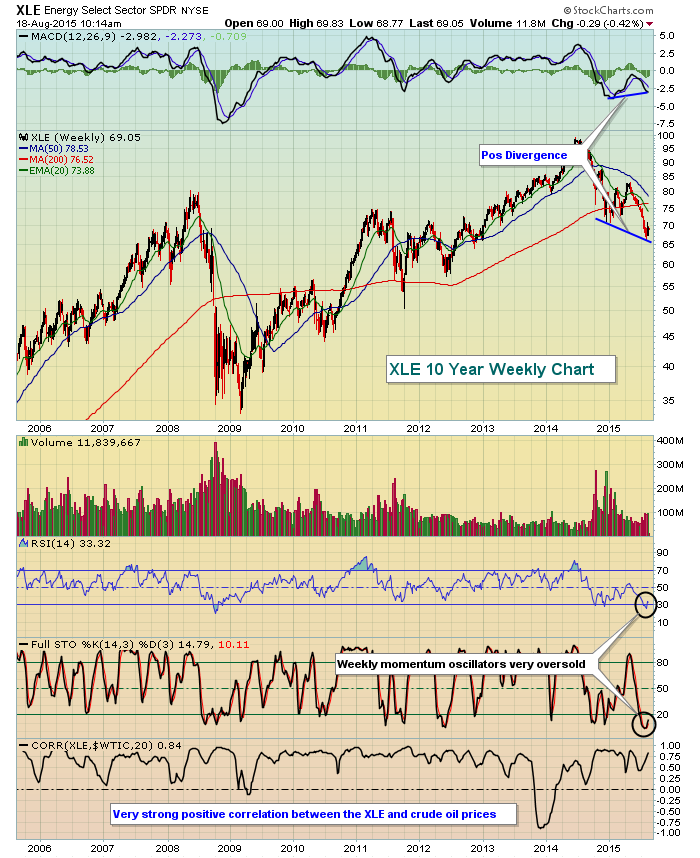
Are Energy Stocks Re-fueling?
by Tom Bowley,
Chief Market Strategist, EarningsBeats.com
I have been ignoring much of the energy sector for months as their technical indications suggested weakness would continue. The energy ETF (XLE) is down over 13% in just the past six months and with crude oil unable to gain a bid, it's difficult to spend too much...
READ MORE
MEMBERS ONLY
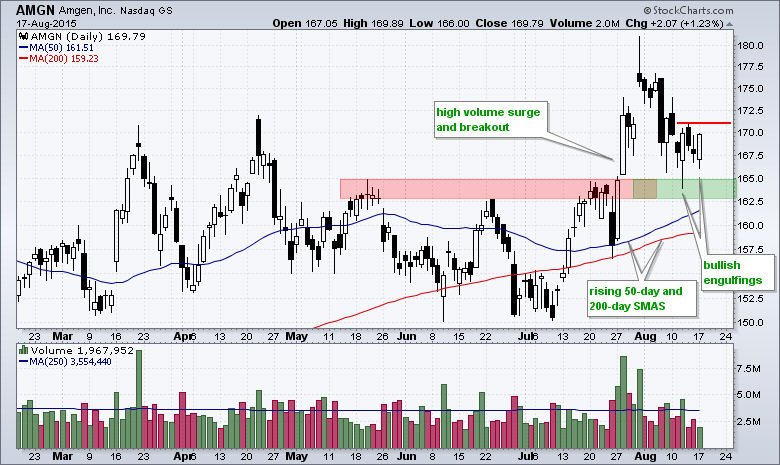
Amgen Returns to the Scene of the Crime
by Arthur Hill,
Chief Technical Strategist, TrendInvestorPro.com
Amgen (AMGN), a big biopharma stock, broke out with expanding volume in July and hit a new 52-week high. After becoming short-term overbought, the stock fell back to the breakout zone. There are two things to note here. First, broken resistance turns into the first support zone. Second, a pullback...
READ MORE
MEMBERS ONLY

SMALL AND MID CAP ETFS BOUNCE WITHIN CORRECTIONS, UPTREND TRUMPS FLAG BREAK IN XLF, INSURANCE HITS NEW HIGH AS REGIONAL BANKS RECOVER, FINANCE BREADTH IMPRESSES, FINDING BREADTH SYMBOLS, COMMODITY ETF BECOMES VERY OVERSOLD, OIL REMAINS IN STEEP DOWNTREND
by John Murphy,
Chief Technical Analyst, StockCharts.com
SMALL AND MID CAP ETFS BOUNCE WITHIN CORRECTIONS... Link for today's video. Small-caps have been the Achilles heel of the stock market by showing both relative and absolute weakness the last two months. Even with this poor performance, the decline in the Russell 2000 iShares (IWM) over the...
READ MORE
MEMBERS ONLY
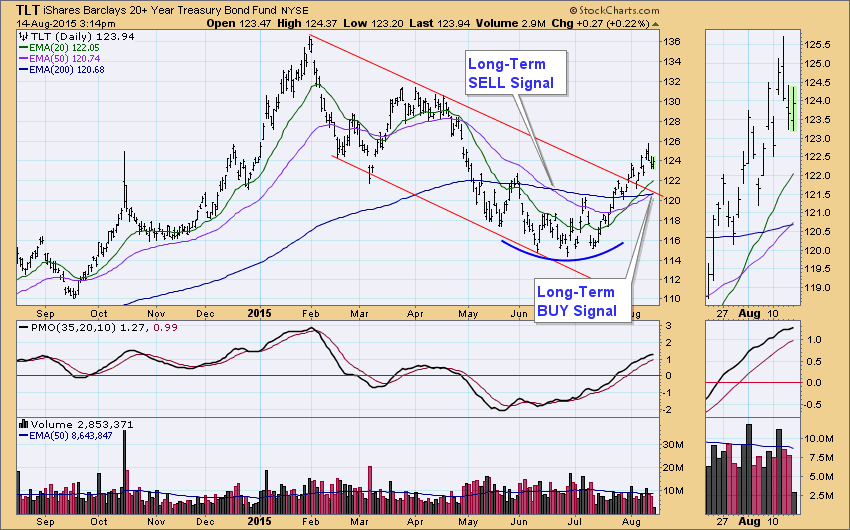
BONDS: Two Months is Long Term??
by Carl Swenlin,
President and Founder, DecisionPoint.com
At the end of June I published an article showing where bonds (TLT) had generated a Trend Model long-term SELL signal when the 50EMA crossed down through the 200EMA; however, as of Friday's close the 50EMA crossed back up through the 200EMA, generating a long-term BUY signal. Two...
READ MORE
MEMBERS ONLY
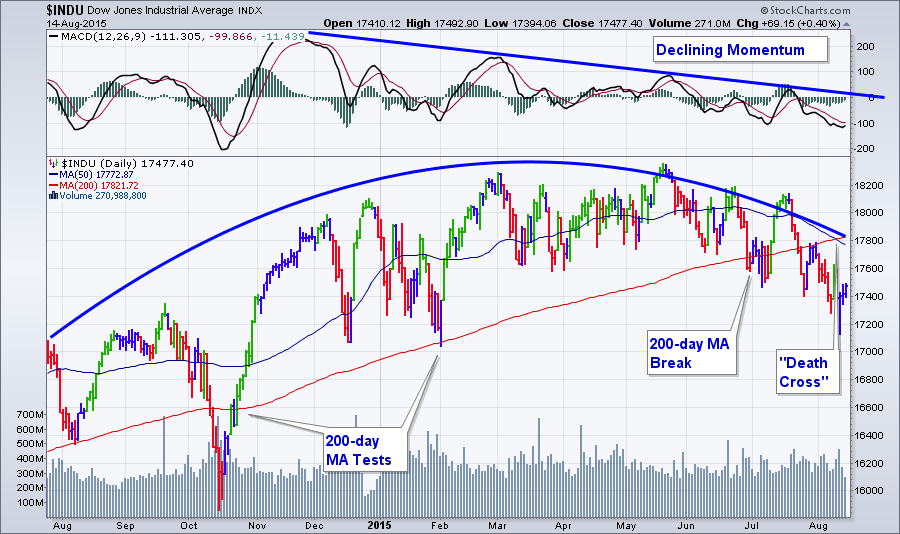
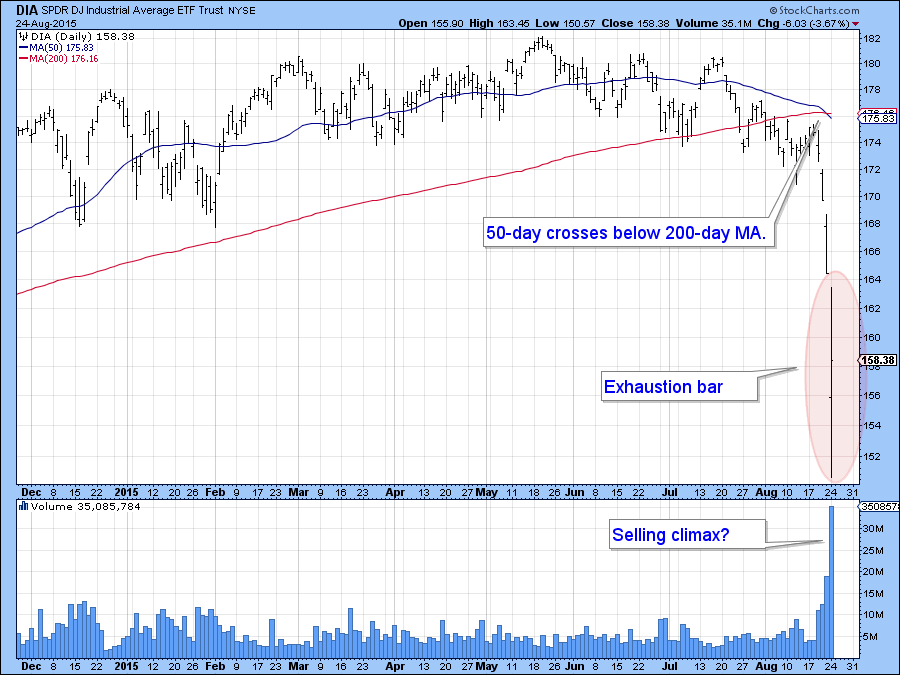
Text Book Rollover Continues in US Markets with Dow Industrials Leading the Way
Hello Fellow ChartWatchers!
The US markets continue to s-l-o-w-l-y roll over with the Dow Industrials leading the way. Despite the fact that $INDU moved 100 points higher this week, the intermediate to long-term trend is clearly down. Lots of people talked about the "Death Cross" that occurred on...
READ MORE
MEMBERS ONLY
How to Avoid Getting Slaughtered

by John Hopkins,
President and Co-founder, EarningsBeats.com
There are differing opinions on whether or not it makes sense to hold stocks into earnings reports. One camp argues that you stand to make a big score if a company beats its numbers. Another camp - the one I'm in - says it's way too...
READ MORE
MEMBERS ONLY
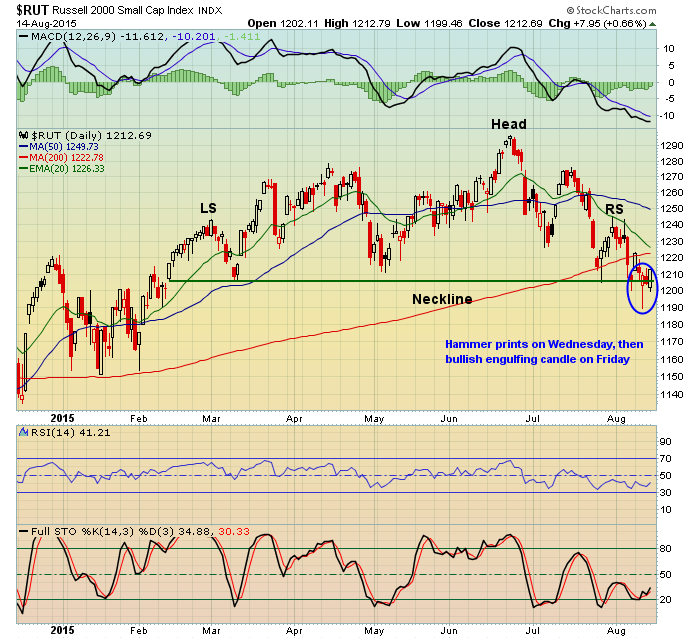
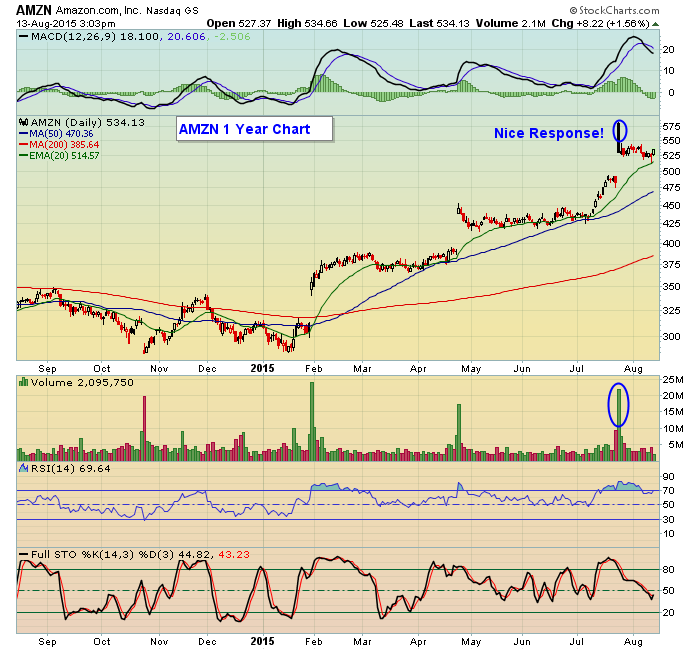
Small Caps Bounce At Two Key Support Levels
by Tom Bowley,
Chief Market Strategist, EarningsBeats.com
Bears are awaiting price breakdowns in key areas of the market, but thus far they remain highly disappointed. Last week they had their chance to take down the small cap universe on two fronts and both failed. This isn't meant to say that the bulls are out of...
READ MORE
MEMBERS ONLY
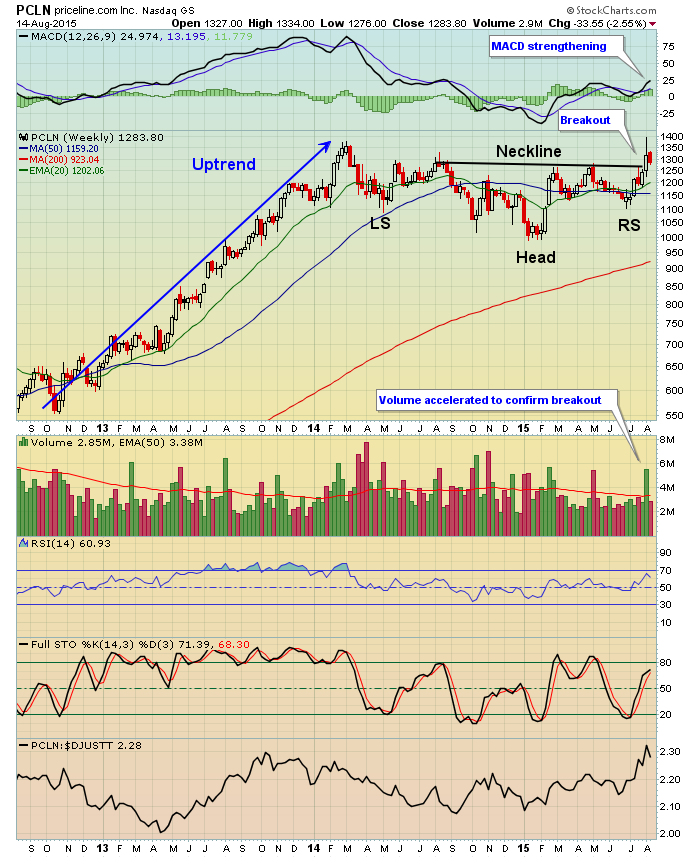
Priceline.com (PCLN) Fills Gap, Confirms Bullish Pattern
by Tom Bowley,
Chief Market Strategist, EarningsBeats.com
After its latest quarterly earnings report, traders rushed into priceline.com (PCLN) as it surged nearly 100 dollars from 1283.99 to 1382.61 on a post-earnings gap. Patient traders, however, have seen PCLN return to its pre-earnings level as it closed on Friday at 1283.80 just seven trading...
READ MORE
MEMBERS ONLY
Dissecting the Consumer Staples sector via XLP
by Julius de Kempenaer,
Senior Technical Analyst, StockCharts.com
The top-level Relative Rotation Graph holding the nine S&P sectors clearly shows you which sector rotation is in play at the moment.
If I look at the rotation of the various sectors on this RRG chart, XLP, the Consumer Staples Sector, is catching my eye. The sector is...
READ MORE
MEMBERS ONLY
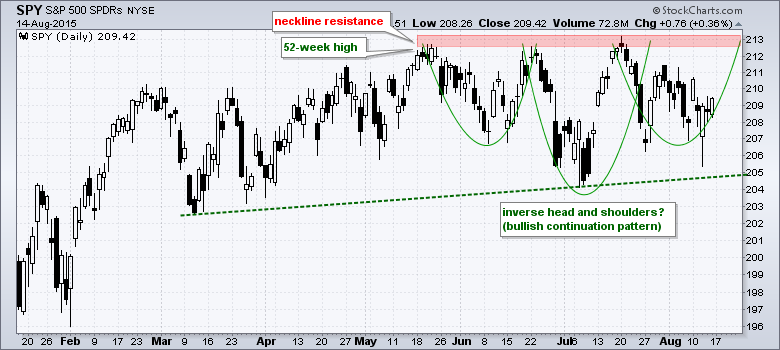
Are Signs of Accumulation Emerging in SPY?
by Arthur Hill,
Chief Technical Strategist, TrendInvestorPro.com
The S&P 500 SPDR remains largely range-bound since March, but a pair of potentially bullish patterns emerged and signs of accumulation are appearing. First, note that SPY hit new 52-week highs in May and July, and the overall trend is still up. The ETF is trading within 2%...
READ MORE
