MEMBERS ONLY
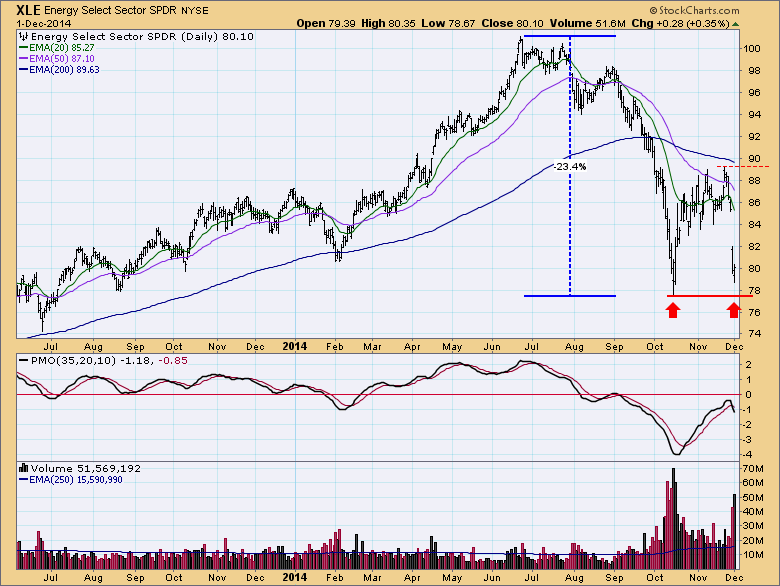
Buying Opportunity for Energy?

by Carl Swenlin,
President and Founder, DecisionPoint.com
The energy sector has gotten pretty beaten up, and we were wondering if a buying opportunity might present in the near future. After looking at the chart we see that there is the possibility of a double bottom. The Energy SPDR (XLE) has declined over -23% since the June top,...
READ MORE
MEMBERS ONLY
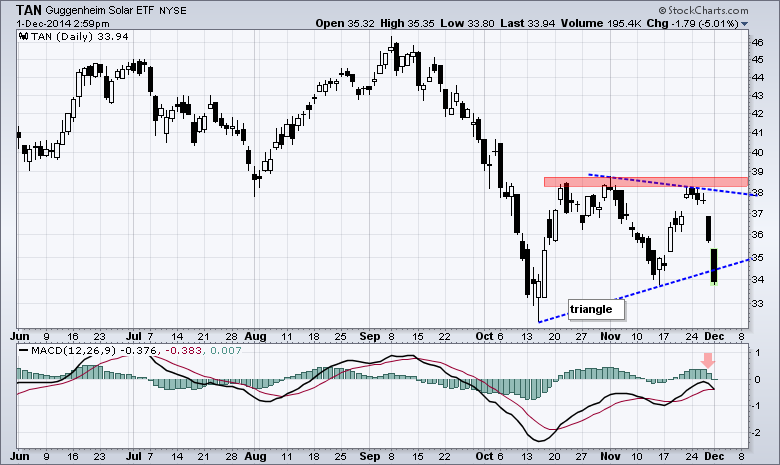
Solar ETF Triggers Bearish Continuation Signal

by Arthur Hill,
Chief Technical Strategist, TrendInvestorPro.com
Lower energy prices may be making solar less competitive and putting pressure on solar-related stocks. The chart shows the Solar Energy ETF (TAN) breaking down in Sep-Oct, consolidating with a triangle and breaking triangle support with a sharp two-day decline. This break signals a continuation of the prior decline and...
READ MORE
MEMBERS ONLY

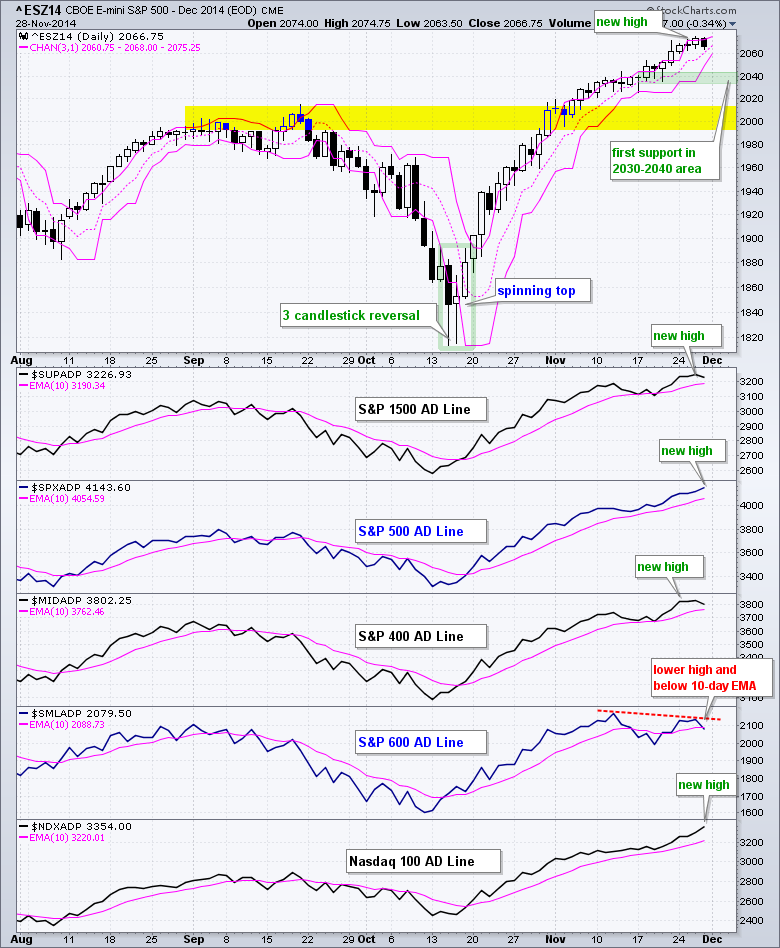
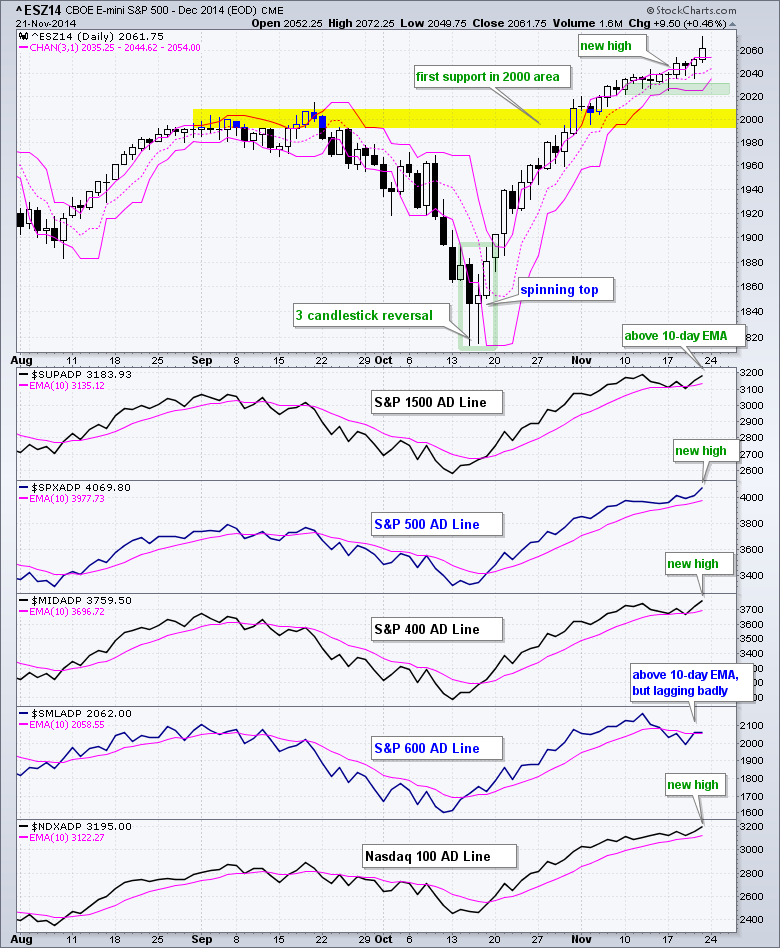
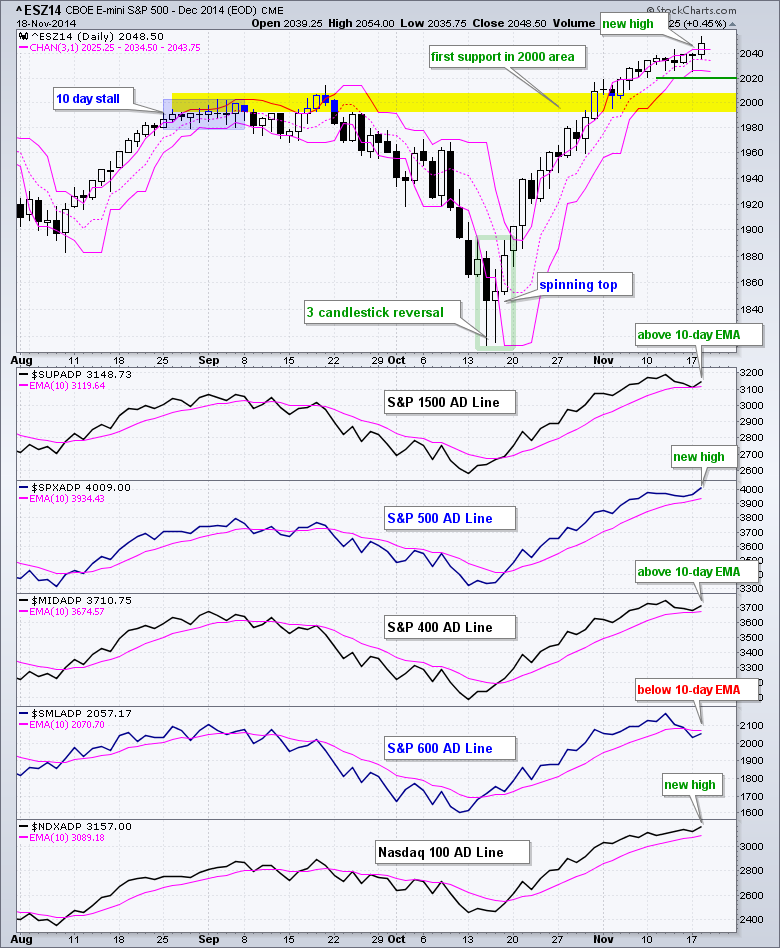
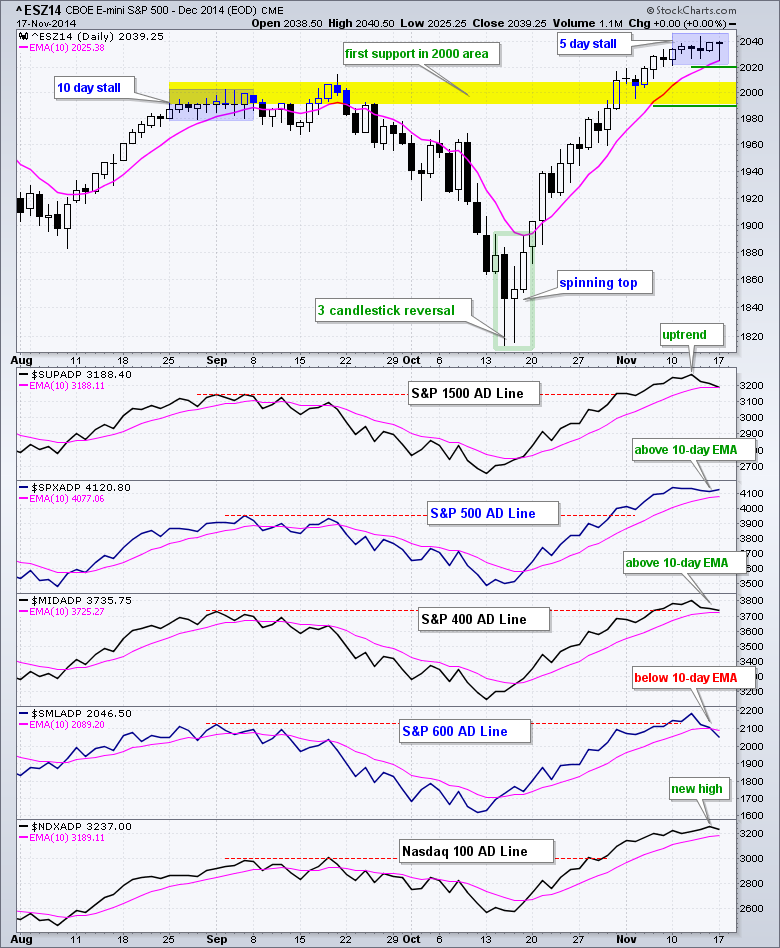
LARGE-CAP ETF'S LEAD UPSWING WITH NEW HIGHS -- SMALL-CAPS LAG, BUT TREND IS STILL UP -- TWO RISK INDICATORS REMAIN BULLISH FOR STOCKS -- ONE AD LINE DIVERGES FROM THE PACK -- BANK ETFS BREAK DOWN -- A BIG WEEK FOR ECONOMIC AND LABOR INDICATORS

by John Murphy,
Chief Technical Analyst, StockCharts.com
LARGE-CAP ETF'S LEAD UPSWING WITH NEW HIGHS... Link for today's video. The S&P 500 SPDR (SPY) and the Nasdaq 100 ETF (QQQ) remain the strongest of the major index ETFs. SPY represents a broad basket of large-cap stocks, while QQQ represents a basket of...
READ MORE
MEMBERS ONLY
An AD Line Diverges and Three Risk Indicators Turn Negative
by Arthur Hill,
Chief Technical Strategist, TrendInvestorPro.com
Stocks were hit with some selling pressure on Friday, but SPY ended the week with a small gain and QQQ ended the week at a new high. The gains continue to be incremental and the advance is slowing, but it is still an advance and selling pressure remains subdued in...
READ MORE
MEMBERS ONLY
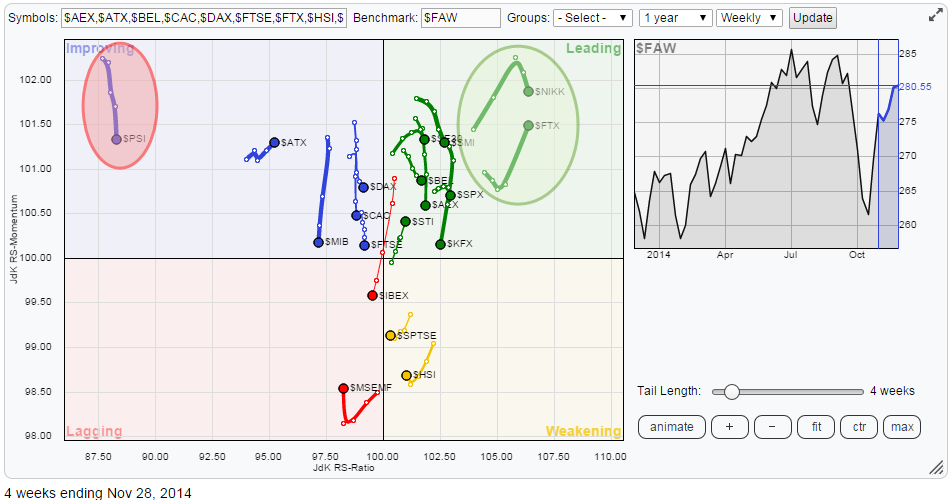
China (and Japan) Paying off

by Julius de Kempenaer,
Senior Technical Analyst, StockCharts.com
The Relative Rotation Graph™ below shows the relative position and movement of international equity markets against the FTSE All World index.
At one glance we can immediately see which markets deserve our attention. THAT is the big advantage of RRG™ Charts.
In this case it is $PSI, the Portuguese equity...
READ MORE
MEMBERS ONLY
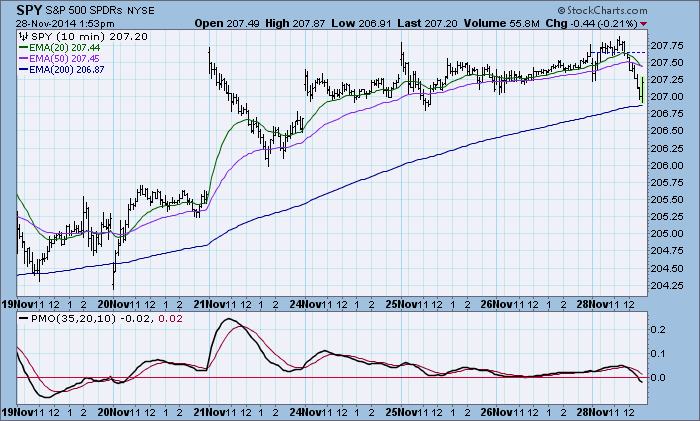
DP Weekly Update: Stocks Flat; Big Drop for Crude - November 28, 2014

by Erin Swenlin,
Vice President, DecisionPoint.com
The market closed slightly lower but it remained within the narrow range of the previous four trading days.
The purpose of the DecisionPoint Daily Update is to quickly review the day's action, internal condition, and Trend Model status of the broad market (S&P 500), the nine...
READ MORE
MEMBERS ONLY

PLUNGING OIL HURTS COMMODITY-RELATED ASSETS AND COUNTRIES -- AND BOOSTS US BONDS AND STOCKS -- DAY'S WINNERS INCLUDE RETAILERS AND AIRLINES -- FALLING BOND YIELDS BOOST STAPLES AND UTILITIES
by John Murphy,
Chief Technical Analyst, StockCharts.com
OPEC FAILURE TO CUT CAUSES OIL TO PLUNGE... Thursday's decision by OPEC not to cut oil output has caused that commodity to plunge in value, and has brought other commodities down with it. The weekly bars in Chart 1 show the United States Oil Fund (USO) plunging to...
READ MORE
MEMBERS ONLY
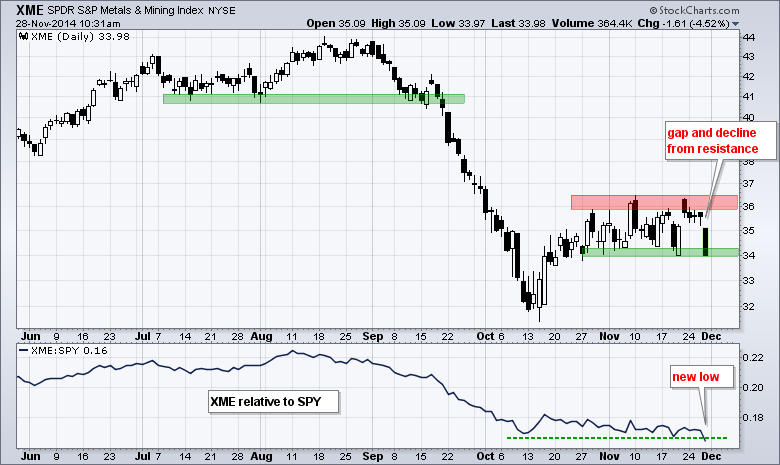
XME Fails at Resistance and Lags Market
by Arthur Hill,
Chief Technical Strategist, TrendInvestorPro.com
The Metals & Mining SPDR (XME) got a bounce with the stock market in the second half of October, but struggled in November with a trading range between 34 and 36.5. This struggle turned to weakness as the ETF gapped down on Friday and fell sharply. A follow through...
READ MORE
MEMBERS ONLY

A couple of Chinese Equity Sector ETF's break to the Upside

by Martin Pring,
President, Pring Research
* Stock/bond ratio challenges overhead resistance.
* Watch $120 on the GLD.
* Commodities may be set for short-term rally.
US Equities
For some time I have been pointing to several discrepancies in the market that have been troubling. My conclusion was that as long as the uptrend since mid-October was intact...
READ MORE
MEMBERS ONLY

WITH CHINA AND JAPANESE STOCKS DOING SO WELL, DON'T FORGET ABOUT EUROPE -- GERMAN STOCKS HIT FIVE-MONTH HIGHS -- BUT BE SURE TO HEDGE OUT CURRENCY RISK -- RECORD LOW GERMAN YIELD PULLS TREASURY YIELD LOWER
by John Murphy,
Chief Technical Analyst, StockCharts.com
CHINESE AND JAPAN STOCKS HAVE BECOME WORLD LEADERS... The two largest Asian stock markets have become two of the world's best gainers this year. The red bars in Chart 1 show the Shanghai Stock Exchange Composite Index ($SSEC) rising to the highest level in more than three years....
READ MORE
MEMBERS ONLY
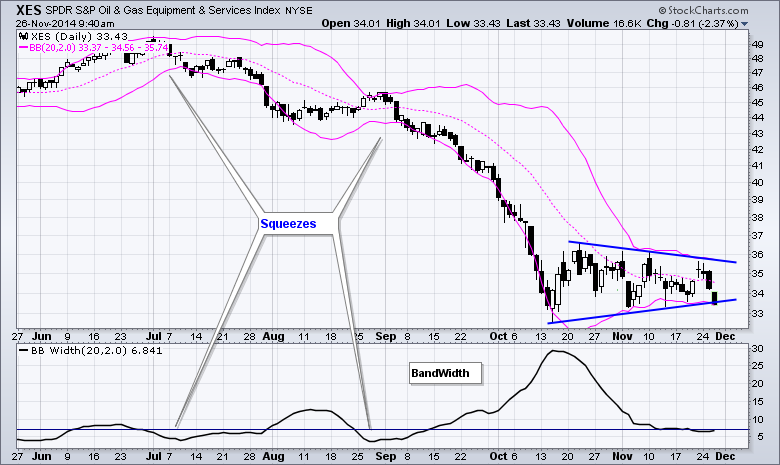
The Noose Narrows on the Oil & Gas Equip & Services SPDR
by Arthur Hill,
Chief Technical Strategist, TrendInvestorPro.com
Oil remains weak overall and so do the energy related ETFs (XLE, XOP, XES). The chart below shows the Oil & Gas Equip & Services SPDR (XES) hitting a new low in October and then consolidating with a triangle. The pink lines show the Bollinger Bands narrowing like a noose...
READ MORE
MEMBERS ONLY

You Only Get 2,000 Profitable Trades Per Lifetime: Use Them Wisely!

by Gatis Roze,
Author, "Tensile Trading"
The National Football League can prove statistically that top running backs, such as Marshawn Lynch of the Seatte Seahawks, have a football lifespan of approximately 2,000 ball carries in their careers before their productivity falls off a cliff. Major League Baseball has similar statistics for the number of throws...
READ MORE
MEMBERS ONLY
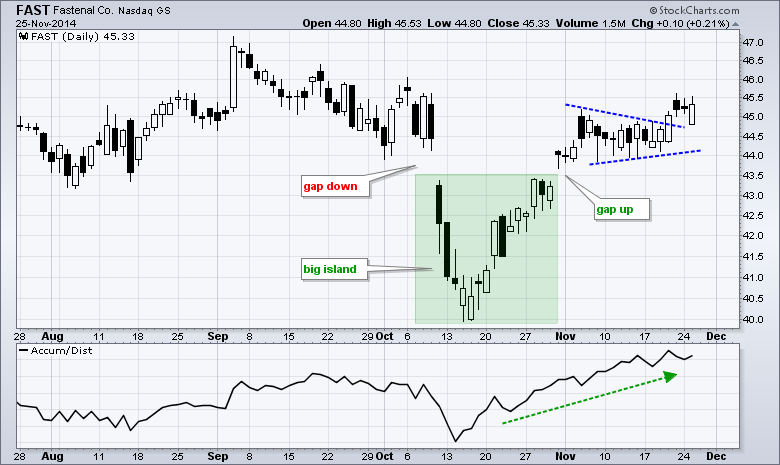
Fastenal Follows Through on Big Island Reversal
by Arthur Hill,
Chief Technical Strategist, TrendInvestorPro.com
Fastenal continues to improve on the chart with two bullish patterns and signs of accumulation. First, a big island reversal formed at the stock gapped below 43.5 in early October and gapped back above this level in late October. Second, the stock broke pennant resistance with a move above...
READ MORE
MEMBERS ONLY

"Model Behavior" - Focus on the DecisionPoint Price Momentum Model (PMM)
by Carl Swenlin,
President and Founder, DecisionPoint.com
The purpose of a trading model is to define certain conditions that, when met, alert us to consider making a decision to buy or sell. We assume that a large majority of technical analysts use trading models of some kind to assist in their trading decisions. DecisionPoint uses the DP...
READ MORE
MEMBERS ONLY

SMALL-CAPS REFUSE TO BUCKLE -- REGIONAL BANK SPDR STALLS -- BIOTECH ETFS BREAK TO NEW HIGHS -- SEMICONDUCTOR SPDR HOLDS SHORT-TERM BREAK -- 20+ YR T-BOND ETF EDGES TOWARDS BREAKOUT -- SHANGHAI COMPOSITE HITS ANOTHER MILESTONE
by John Murphy,
Chief Technical Analyst, StockCharts.com
SMALL-CAPS REFUSE TO BUCKLE... Programming Note: There is no video today because I am working on the road. Also note that I will be taking the rest of the week off to be with family and friends. I will post a Market Message and video next Monday, December 1st. In...
READ MORE
MEMBERS ONLY

On Trendlines

by Greg Morris,
Veteran Technical Analyst, Investor, and Author
The goal of this article is to make you stop and think, nothing more. I cannot recall seeing someone’s chart purporting to divine the market that did not have at least one trendline drawn on it. The ubiquitous trendline is prevalent in almost everyone’s work, so much so,...
READ MORE
MEMBERS ONLY
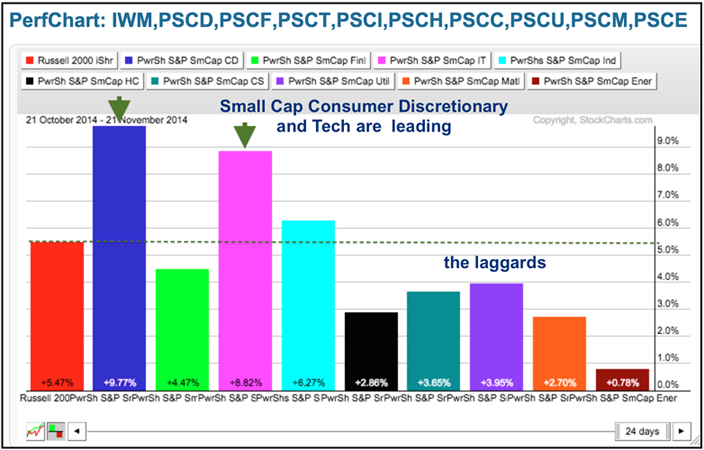
Three of Five Offensive Sectors Lead within Small Caps
by Arthur Hill,
Chief Technical Strategist, TrendInvestorPro.com
The PerfChart below shows the nine small-cap sector ETFs and the Russell 2000 iShares (IWM). Notice that the SmallCap Consumer Discretionary ETF (PSCD) and the SmallCap Technology ETF (PSCT) led over the last five days with bigger gains. Throw in the SmallCap Industrials ETF (PSCI) and three of the four...
READ MORE
MEMBERS ONLY
Large-caps Rule, TLT Makes Breakout Bid and UUP Exits the Flag
by Arthur Hill,
Chief Technical Strategist, TrendInvestorPro.com
Stocks surged out of the gate on Friday, but fell back in the afternoon and closed off their highs. The action was mostly positive, but small-caps again underperformed as the S&P SmallCap iShares (IJR) closed fractionally lower. Large-caps still rule the rally. All sectors were up with industrials,...
READ MORE
MEMBERS ONLY
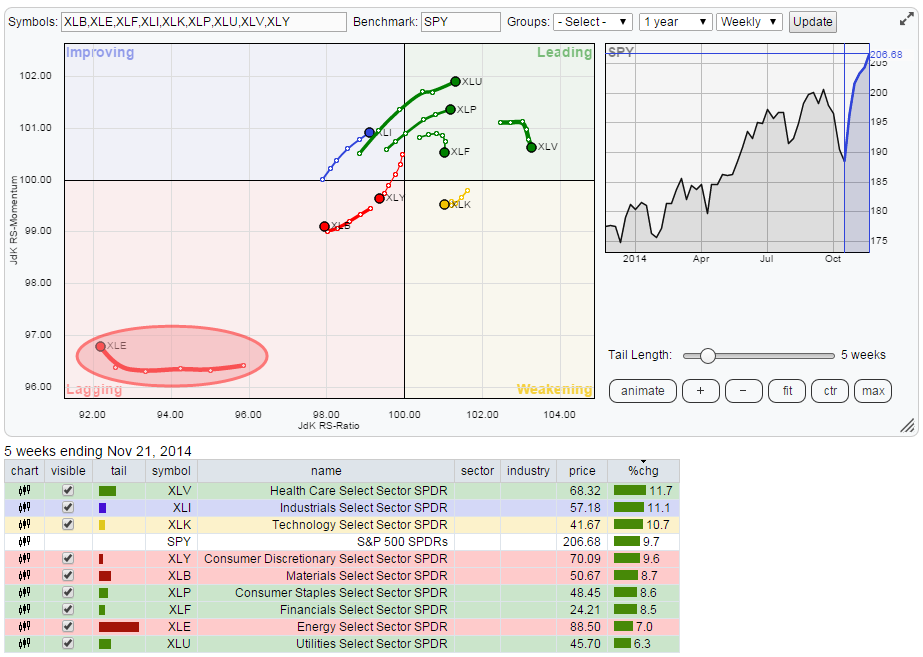
Strong Rotation for Utilities and Staples
by Julius de Kempenaer,
Senior Technical Analyst, StockCharts.com
The Relative Rotation Graph below shows the weekly rotation pattern for the nine S&P sector ETFs.
The single one sector that immediately catches attention is Energy (XLE) in the bottom left-hand corner (lagging). This is by far the weakest sector on the chart. Further to the energy sector...
READ MORE
MEMBERS ONLY

S&P MIDCAP 400 IS KNOCKING ON THE DOOR -- MICRO-CAP ETF HITS MOMENT-OF-TRUTH -- S&P 500 AND NASDAQ 100 AD LINES SCORE NEW HIGHS -- HIGH-LOW INDICATORS SURGE -- MATERIALS SECTOR GETS A BREADTH SURGE
by John Murphy,
Chief Technical Analyst, StockCharts.com
S&P MIDCAP 400 IS KNOCKING ON THE DOOR... Programming note: I am on the road today and there is no video. Getting the trend right is more than half the battle when it comes to trading and investing. Moreover, once we define the trend, it is important to...
READ MORE
MEMBERS ONLY
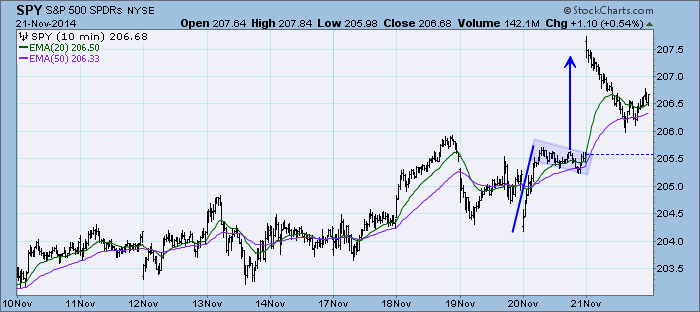
DP Weekly Update: Rally Cools Quickly - November 21, 2014
by Erin Swenlin,
Vice President, DecisionPoint.com
Note: The DP Weekly Update will now be published every Friday so we can analyze the final weekly charts.
Price surged on the open likely helped by China lowering its interest rates for the first time in two years. After that it was all downhill. The bull flag executed first...
READ MORE
MEMBERS ONLY

Stock Market Mastery: Blending Fundamental & Technical Analysis Part I
by Gatis Roze,
Author, "Tensile Trading"
The Harvard Business Review (November, 2014) just published its list of the Best Performing CEOs. This list should interest investors since these top 50 CEOs have been undeniably effective in delivering total shareholder returns which averaged 1,350% while on the job. That translates into a 26.2% annual return!...
READ MORE
MEMBERS ONLY
Baby Steps, New Highs and Bullish Evidence
by Arthur Hill,
Chief Technical Strategist, TrendInvestorPro.com
Stocks continued to take baby steps higher with the S&P 500 and Dow Industrials closing at all time (closing) highs. Even though the Russell 2000 and S&P Small-Cap 600 remain below their prior highs, they are less than 4% from these highs and both formed bullish...
READ MORE
MEMBERS ONLY

What Does a DecisionPoint Trend Model "Neutral" Signal Mean?
by Erin Swenlin,
Vice President, DecisionPoint.com
It was rightly brought to my attention that I haven't really explained what DecisionPoint Trend Model signals imply, especially the "Neutral" signal. First, remember that these "signals" are really "attention flags" to give you a heads up on a possible price reversal...
READ MORE
MEMBERS ONLY

S&P RETAIL SPDR HITS NEW RECORD -- LEADERS INCLUDE BEST BUY, DOLLAR TREE, AND WILLIAMS SONOMA -- MACY'S BREAKS OUT -- HOMEBUILDING ETF HITS EIGHT-MONTH HIGH -- LED BY LENNAR, DR HORTON, AND PULTEGROUP -- CONSUMER DISCRETIONARY SPDR SHOWS NEW LEADERSHIP
by John Murphy,
Chief Technical Analyst, StockCharts.com
S&P RETAIL SPDR HITS NEW HIGH ... Strong buying of retail stocks continues. I've been showing record highs in the Market Vectors Retail ETF (RTH). Chart 1, however, shows the S&P Retail SPDR (XRT) hitting a record high as well. Its relative strength line (above...
READ MORE
MEMBERS ONLY
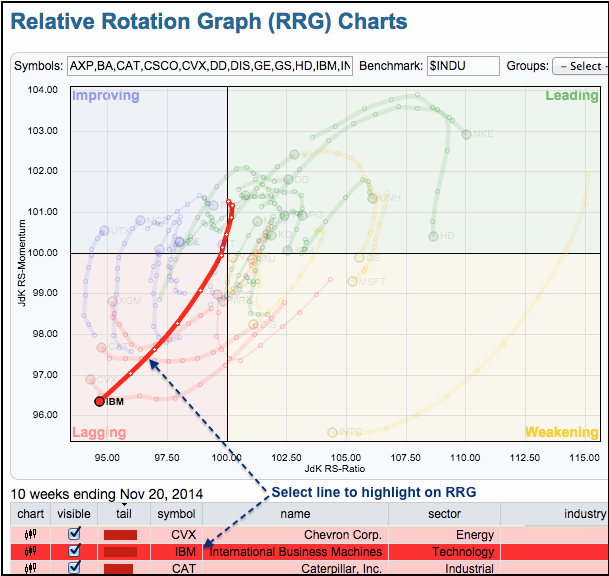
Big Blue Stays Red on the Relative Rotation Graph
by Arthur Hill,
Chief Technical Strategist, TrendInvestorPro.com
The S&P 500 is up over 7% the last five weeks, but IBM is down and flirting with new lows. The chart below shows the Relative Rotation Graph (RRG) with all thirty Dow stocks. With the Dow Industrials as the benchmark, we are seeing the relative performance rotations...
READ MORE
MEMBERS ONLY
Small-caps Continue to Underperform - Plus C, CAT, FAST, FB, IBM, X
by Arthur Hill,
Chief Technical Strategist, TrendInvestorPro.com
Small-caps weighed on the stock market again as IWM fell over 1%. Techs were also a bit weak with QQQ falling a half percent and SPY held up the best with a fractional loss. Despite a mixed and overbought stock market, there were some positive takeaways on Wednesday. The Retail...
READ MORE
MEMBERS ONLY
Tuesday's NASDAQ High Was Accompanied By A Paltry 50 Net New Highs
by Martin Pring,
President, Pring Research
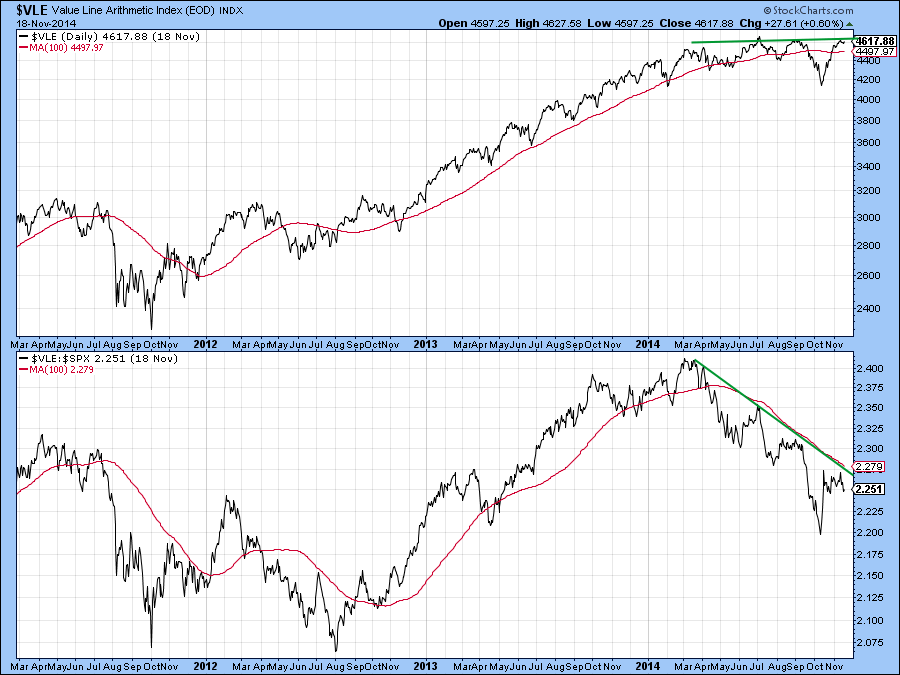
* Value Line Arithmetic is just below important resistance.
* 10-year bond price reacts to its recent breakout point.
* The GLD fails at resistance.
US Equities
The Value Line Arithmetic($VLE) monitors the price of the average stock. It has been one of the weakest areas of the market as demonstrated by...
READ MORE
MEMBERS ONLY
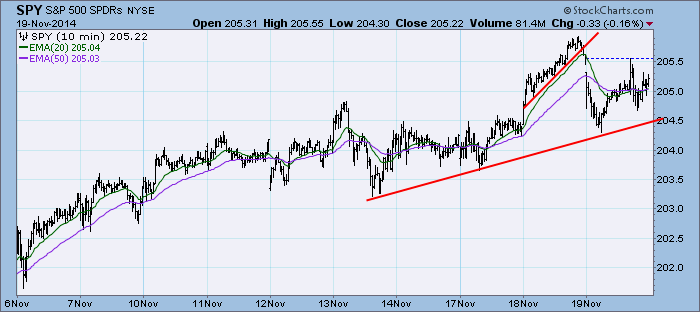
DP Weekly Update: Indicators Turn Back Down - November 19, 2014
by Erin Swenlin,
Vice President, DecisionPoint.com
NOTE: The DP Weekly Update will be moving to Fridays. That way you'll get a review of the weekly charts as well as the regular commentary.
After breaking out yesterday, price broke down. The breakdown actually began at the end of yesterday where we noted that it could...
READ MORE
MEMBERS ONLY

CONSUMER STAPLES AND RETAIL ETFS HIT RECORD HIGHS -- RETAILERS ARE BENEFTING FROM FALLING OIL -- DIVIDEND PAYING STAPLES MAY BE BENEFITING FROM LOWER BONDS YIELDS -- A STRONGER DOLLAR IS ALSO KEEPING INFLATION AND GLOBAL BOND YIELDS DOWN
by John Murphy,
Chief Technical Analyst, StockCharts.com
WHY ARE STAPLES AND RETAILERS LEADING ... We generally look at the relative performance of market sectors to get clues about stock market direction. It's normally a good sign, for example, when retailers are doing better than the general market. It's normally a bad sign when consumer...
READ MORE
MEMBERS ONLY
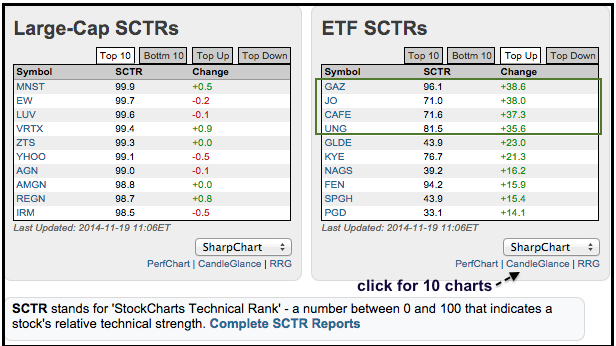
Natural Gas and Coffee Lead ETF SCTRs with Big Moves
by Arthur Hill,
Chief Technical Strategist, TrendInvestorPro.com
There is a little gem in the middle of the home page that shows the biggest moves for the StockCharts Technical Rank (SCTR). Clicking "Top Up" will show the biggest relative performance gainers, while clicking "Top Down" will show the biggest relative performance losers. Today we...
READ MORE
MEMBERS ONLY
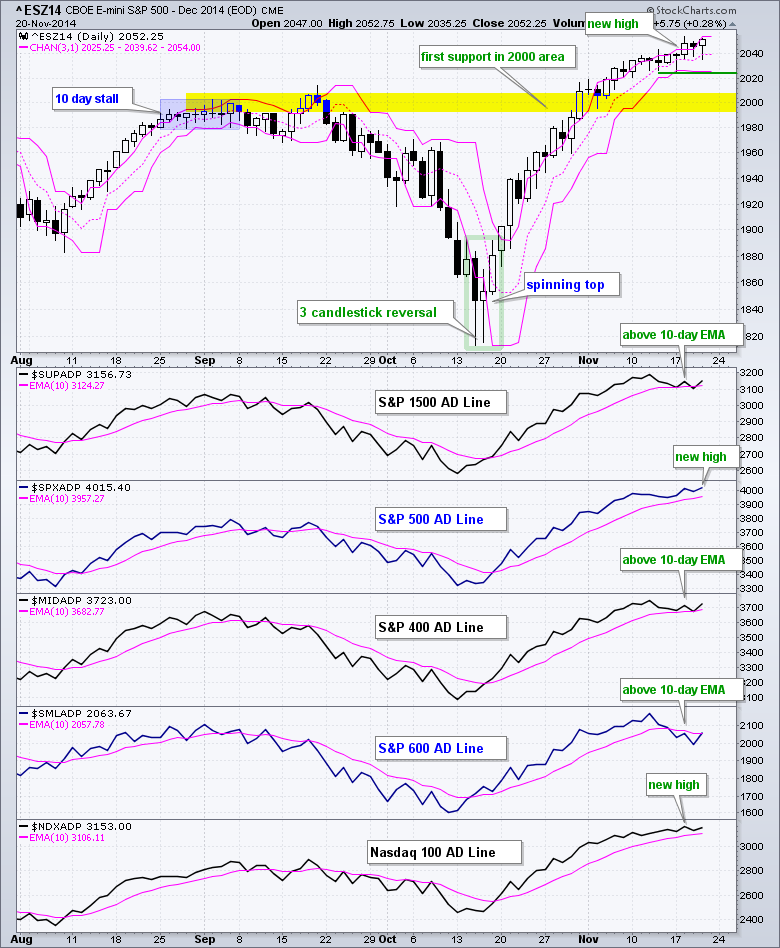
Incremental Gains Continue - Bulk of Evidence Remains Bullish
by Arthur Hill,
Chief Technical Strategist, TrendInvestorPro.com
Stocks moved higher on Tuesday with the major index ETFs posting modest gains. Incremental gains are the hallmark of this advance since late October. SPY is up ten of the last twelve days and the total advance is around 2%. Sure, upside momentum is slowing and buying pressure is waning,...
READ MORE
MEMBERS ONLY

Bond Timer of the Year?
by Erin Swenlin,
Vice President, DecisionPoint.com
I don't like to toot my own horn, but Chip suggested I do today! Most of you are not aware that the DecisionPoint Trend Model signals have been tracked for many years by Timer Digest, a professional publication for market timers. In this monthly issue, I was listed...
READ MORE
MEMBERS ONLY

MARKET TURNS MIXED AS SMALL-CAPS LAG -- IS RELATIVE WEAKNESS IN THE RUSSELL 2000 REALLY A PROBLEM? -- MARKING SUPPORT FOR THREE MAJOR INDEX ETFS -- AIR PRODUCTS LEADS MATERIALS SECTOR -- XLV HITS NEW HIGH AS PFIZER CHALLENGES RESISTANCE
by John Murphy,
Chief Technical Analyst, StockCharts.com
MARKET TURNS MIXED AS SMALL-CAPS LAG... Link for today's video. As of Mondays close, November has been a mixed month for the stock market. The S&P 500 SPDR, the Dow Diamonds and the Nasdaq 100 ETF are up, while the S&P SmallCap iShares, Russell...
READ MORE
MEMBERS ONLY
SPY Stalls, IWM Corrects and TLT Consolidates - Plus FAST, EXPR, UHS
by Arthur Hill,
Chief Technical Strategist, TrendInvestorPro.com
Stocks meandered again in mixed trading. Small-caps were weak as IWM fell .83%, but large-caps held firm as SPY and DIA closed with fractional gains. If you are looking for that small correction, look no further than small-caps because IWM is down around 2% in the last three days. If...
READ MORE
MEMBERS ONLY
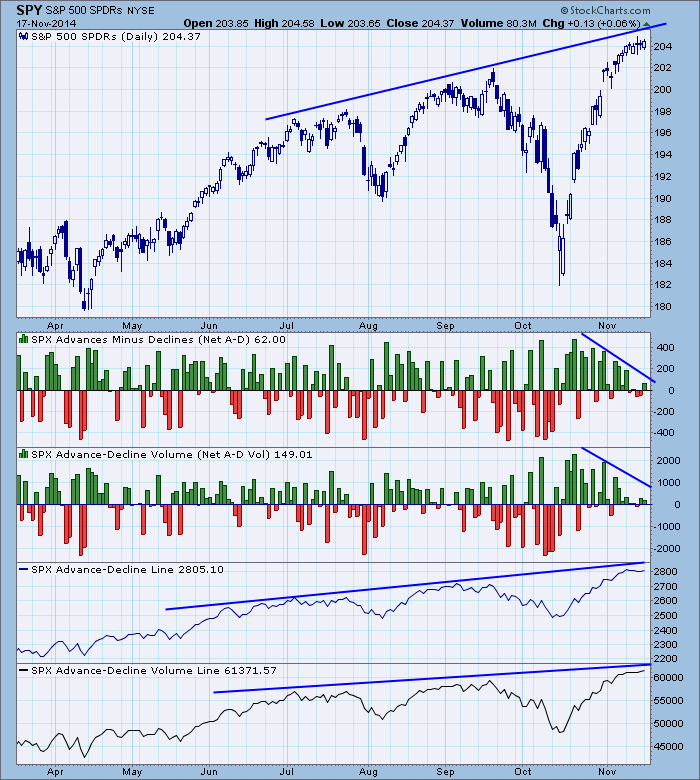
Advance-Decline Lines Still Confirming Market Highs
by Carl Swenlin,
President and Founder, DecisionPoint.com
We see plenty of indicators that tell us that there is a possibility for a correction, but not all indicators are sending that message. One in particular is the Advance-Decline Line (A-D Line). It is one of the first technical indicators ever developed, and it is simply a cumulative total...
READ MORE
MEMBERS ONLY
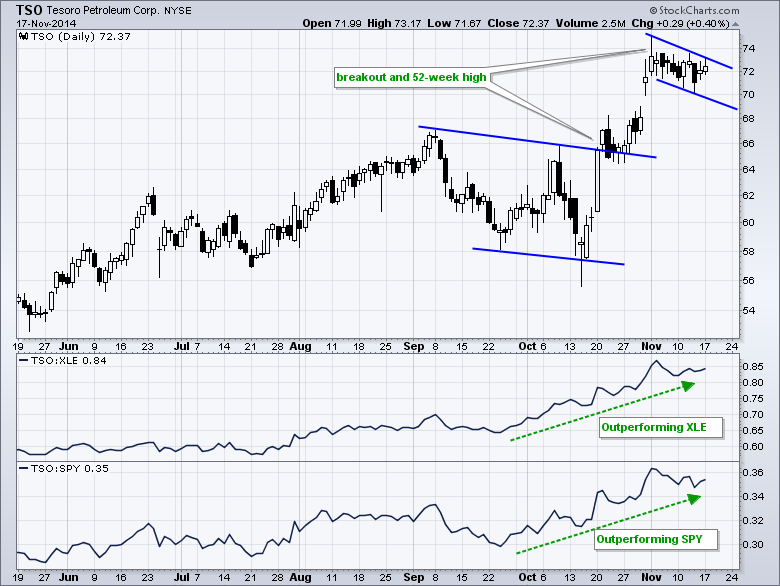
One Stock in the Energy Sector Hit a New High This Month
by Arthur Hill,
Chief Technical Strategist, TrendInvestorPro.com
The Energy SPDR (XLE) is by far the weakest sector in the market right now. Most of its 43 components are in downtrends and well below the summer-autumn highs. One stock, however, stands out from this crowd. The chart below shows Tesoro (TSO) breaking out to new highs in mid...
READ MORE
MEMBERS ONLY

ENERGY ETFS CONTINUE TO STRUGGLE -- GOOGLE FAILS AT BROKEN SUPPORT AND LAGS -- FACEBOOK FIRMS AFTER GAP -- INTERNET ETF MAINTAINS UPTREND -- GLOBAL SOCIAL MEDIA ETF REVERSES AT KEY RETRACEMENT -- SEMICONDUCTORS COULD HOLD THE NEXT KEY
by John Murphy,
Chief Technical Analyst, StockCharts.com
ENERGY ETFS CONTINUE TO STRUGGLE... Link for today's video. Energy stocks are in the news today because Baker Hughes is attempting to takeover Halliburton. This seemingly positive news did not, however, boost the sector or other energy related ETFs. Perhaps the sector is more focused on oil, which...
READ MORE
MEMBERS ONLY
Signs of Weakness Creep into the Stock Market
by Arthur Hill,
Chief Technical Strategist, TrendInvestorPro.com
Stocks were mostly higher last week, but there were some pockets of weakness. QQQ led the broader market with a 1.59% gain and IWM lagged as the ETF fell a fraction (-.02%). The consumer discretionary and technology sectors gained and showed relative strength last week. The finance, energy...
READ MORE
MEMBERS ONLY
Stalking the Elusive Holiday Consumer with Technical Analysis
Hello Fellow ChartWatchers!
I'm going to start with four important announcements and then we'll get into some sector-oriented market analysis:
* We now have the video of our ChartCon conference from back in August available in our bookstore. It contains all of the main presentations from the...
READ MORE
