MEMBERS ONLY
Global Equities and Some US Averages are Just Above Critical Support

by Martin Pring,
President, Pring Research
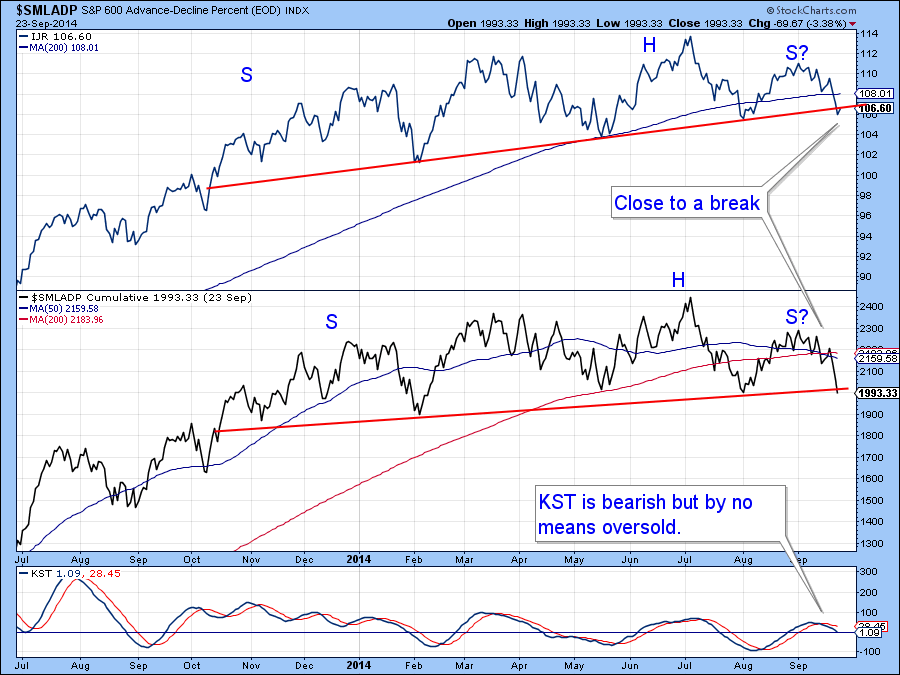
* Small cap stocks on the verge of a major breakdown.
* Gold shares violate important up trend line.
* Dollar Index due for a correction within a primary bull market.
Click here for the video version.
For the last few weeks I have been pointing out the gradually deteriorating technical position but...
READ MORE
MEMBERS ONLY
Global Equities and Some US Averages are Just Above Critical Support - Video Version
by Martin Pring,
President, Pring Research
This is the video version of the Market Roundup.
* Small cap stocks on the verge of a major breakdown.
* Gold shares violate important up trend line.
* Dollar Index due for a correction within a primary bull market.
Click here for the print version.
Good Luck and good charting,
Martin Pring...
READ MORE
MEMBERS ONLY

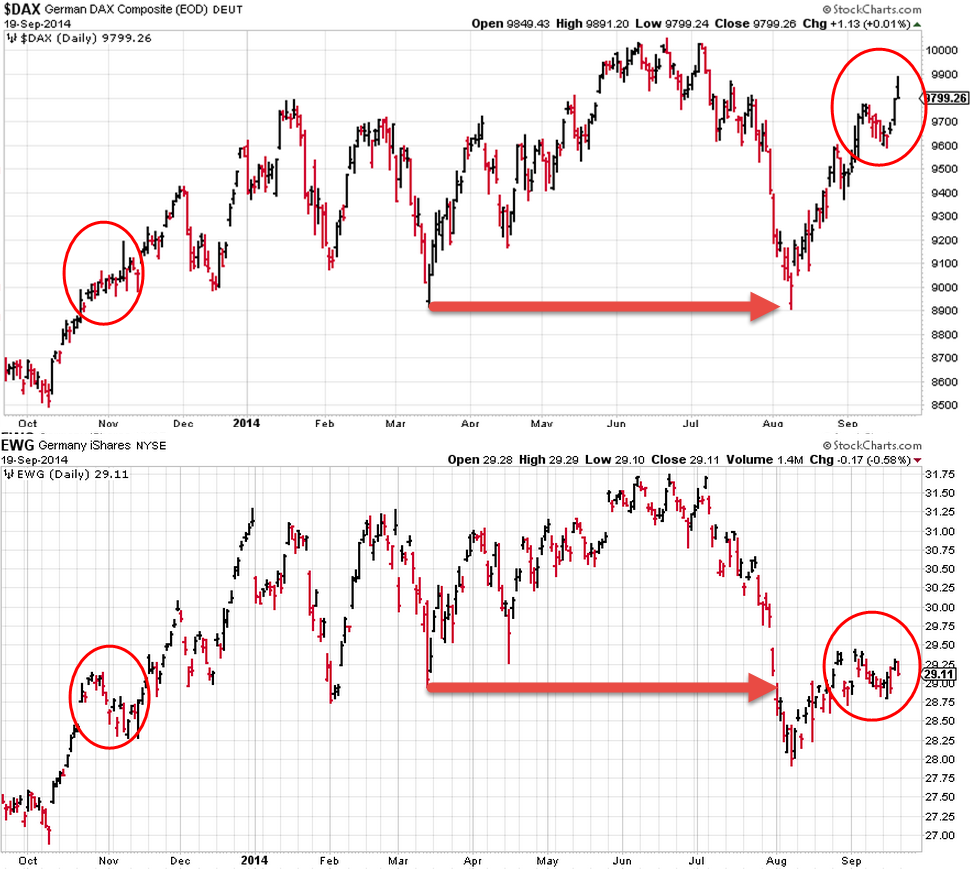
FOREIGN STOCK ETFS ARE TESTING MAJOR OVERHEAD RESISTANCE BARRIERS WHICH COULD THREATEN GLOBAL RALLY -- THE % NYSE STOCKS ABOVE 200-DAY AVERAGE HAS FALLEN TO 2014 LOW -- SMALL CAP RELATIVE WEAKNESS IS WORST IN THREE YEARS

by John Murphy,
Chief Technical Analyst, StockCharts.com
THE STOCK RALLY IS GETTING NARROWER... Arthur Hill wrote about the negative divergence between small and micap stocks relative to large cap stocks. Let's put that in some perspective. Chart 1 shows that the three stock categories have been rising together since the 2009 bottom (as they usually...
READ MORE
MEMBERS ONLY
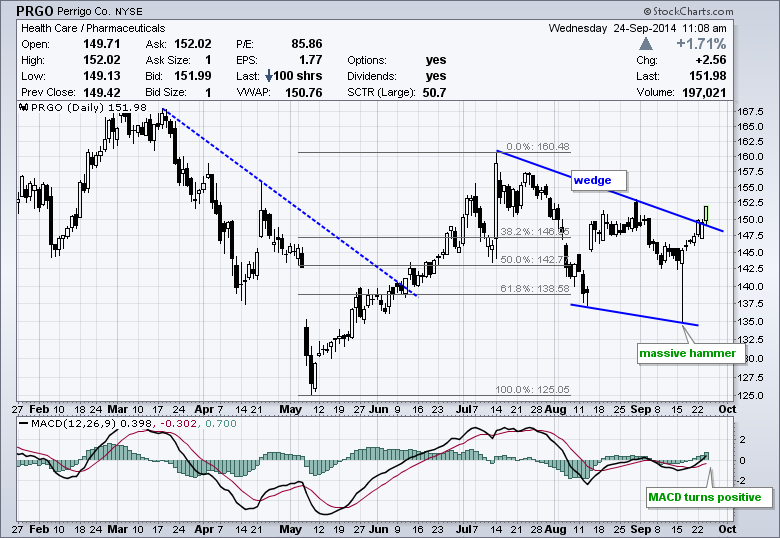
Perrigo Follows Up on Massive Hammer

by Arthur Hill,
Chief Technical Strategist, TrendInvestorPro.com
Perrigo (PRGO), which is part of the healthcare sector, formed a massive hammer in mid September and followed up on this candlestick reversal with a break above the wedge trend line. Also notice that MACD moved above its signal line and turned positive.
Click this image for a live chart...
READ MORE
MEMBERS ONLY
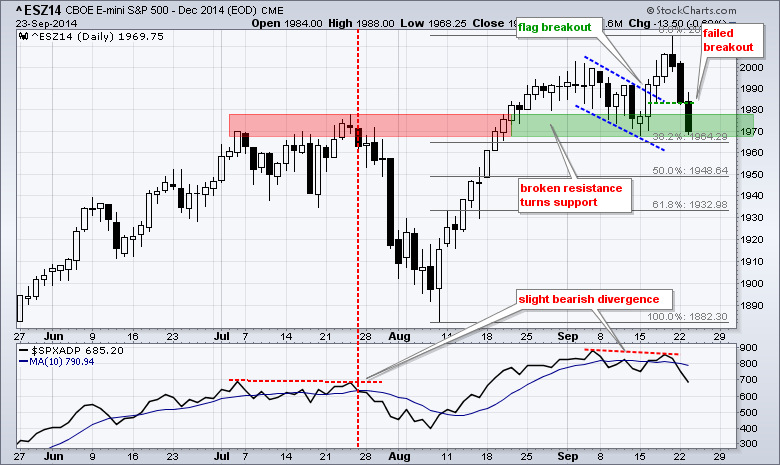
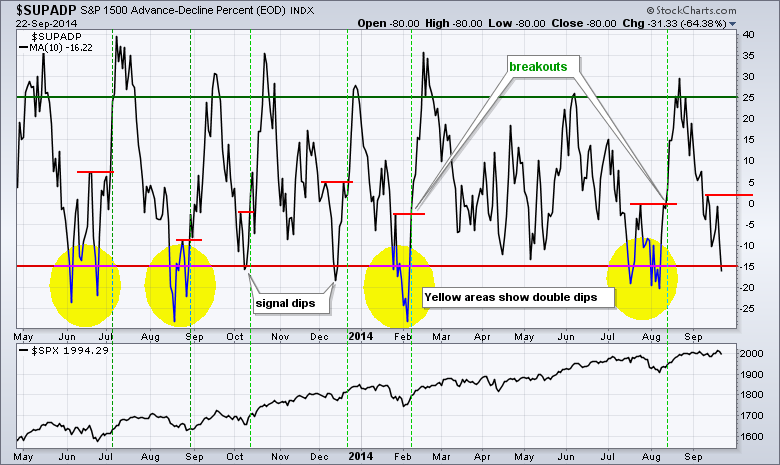
Small Divergence forms in Key Breadth Indicator
by Arthur Hill,
Chief Technical Strategist, TrendInvestorPro.com
Stocks remained under selling pressure on Tuesday with the major index ETFs recording modest losses. All sectors were down with the consumer staples, consumer discretionary and industrials sectors leading lower. Retailers weighed on the consumer discretionary as the Retail SPDR fell 1%. Gold got an oversold bounce and this lifted...
READ MORE
MEMBERS ONLY
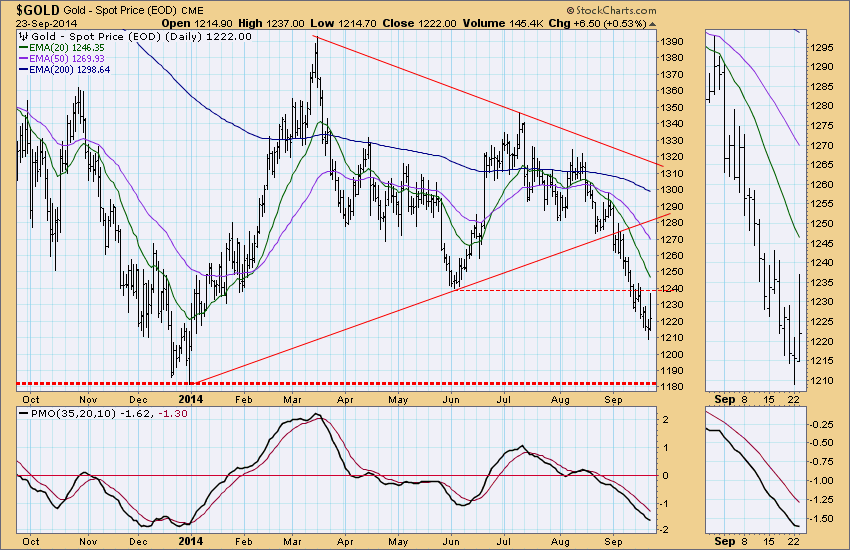
GOLD: Possible Triple Bottom

by Carl Swenlin,
President and Founder, DecisionPoint.com
Gold has been performing badly for some time, but especially since August 21st when our Trend Model changed from a BUY to a SELL. The chart is completely negative with price below the 20EMA, which is below the 50EMA, which is below the 200EMA. Recent support at 1240 failed quickly,...
READ MORE
MEMBERS ONLY

SCANNING FOR PULLBACKS WITHIN AN UPTREND (LIVE DEMO) -- BIOGEN IDEC BOUNCES OFF SUPPORT -- CVR REFINING FIRMS IN FIBONACCI CLUSTER ZONE -- QLYS AND MON ALSO MAKE THE SCAN CUT -- FRENCH, GERMAN AND UK STOCKS MOVE SHARPLY LOWER
by John Murphy,
Chief Technical Analyst, StockCharts.com
SCANNING FOR PULLBACKS WITHIN AN UPTREND... Link for today's video. As noted on Monday, stocks have weakened this month with small-caps leading the way lower. However, with most of the major indices hitting new highs recently, I still classify these declines as corrections within a bigger uptrend. I...
READ MORE
MEMBERS ONLY
Breadth Indicator Hits Oversold - Plus BZH, COH, HD, QLYS and TRIP
by Arthur Hill,
Chief Technical Strategist, TrendInvestorPro.com
Stocks were hit with selling pressure on Monday with small-caps leading the way lower. Small-caps have been weak all month and simply continued this trend on Monday. All sector SPDRs were down with the consumer staples holding up the best. The consumer discretionary and energy sectors were hit hard. Weakness...
READ MORE
MEMBERS ONLY
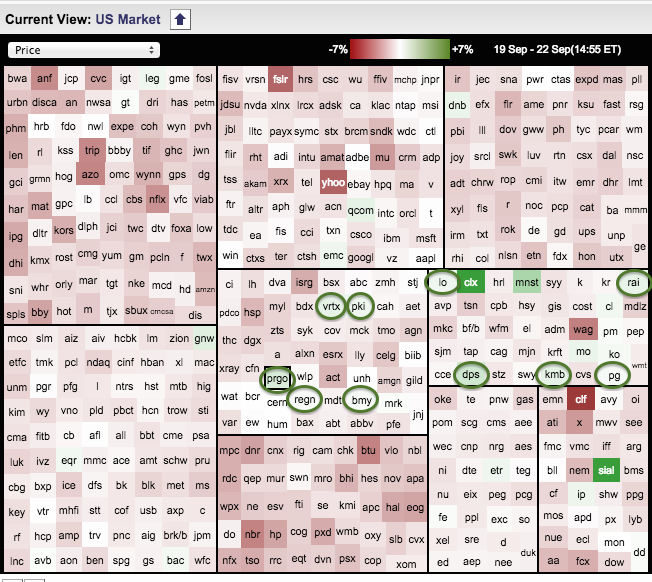
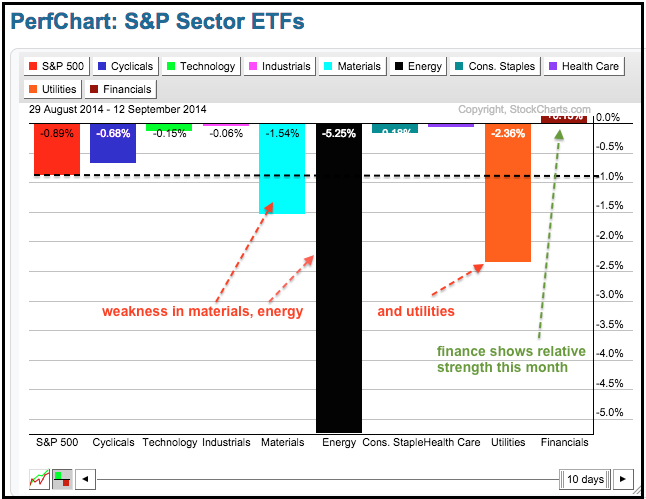
Finding Some Green in a Sea of Red
by Arthur Hill,
Chief Technical Strategist, TrendInvestorPro.com
Stocks are down pretty much across the board on Monday, but there are some pockets of green and chartists can find these stocks using the Sector Market Carpet. The image below highlights ten stocks that are bucking the selling pressure and showing relative strength in a down market. Notice the...
READ MORE
MEMBERS ONLY

SMALL-CAPS CONTINUE TO UNDERPERFORM -- MID-CAPS AND MICRO-CAPS ALSO LAG LARGE-CAPS -- THREE MOMENTUM ETFS BREAK LOWER BOLLINGER BANDS -- WATCHING THE BREAKOUTS IN FINANCE AND INDUSTRIALS -- STEEL STOCKS LEAD METALS AND MINING ETF LOWER
by John Murphy,
Chief Technical Analyst, StockCharts.com
SMALL-CAPS CONTINUE TO UNDERPERFORM... Link for today's video. September continues to be a rough month for mid-caps, small-caps, micro-caps and some of the high-beta groups. Overall, we have a bifurcated market with relative strength in large-caps and relative weakness in the other caps. Don't forget that...
READ MORE
MEMBERS ONLY

Know Your Browser
Hello Fellow ChartWatchers!
Several indexes including the Dow and the S&P 500 hit new all-time highs on Friday before pulling back slightly before the close. People who have been waiting for the market to correct are still waiting. This is a great time to be a technical analyst...
READ MORE
MEMBERS ONLY
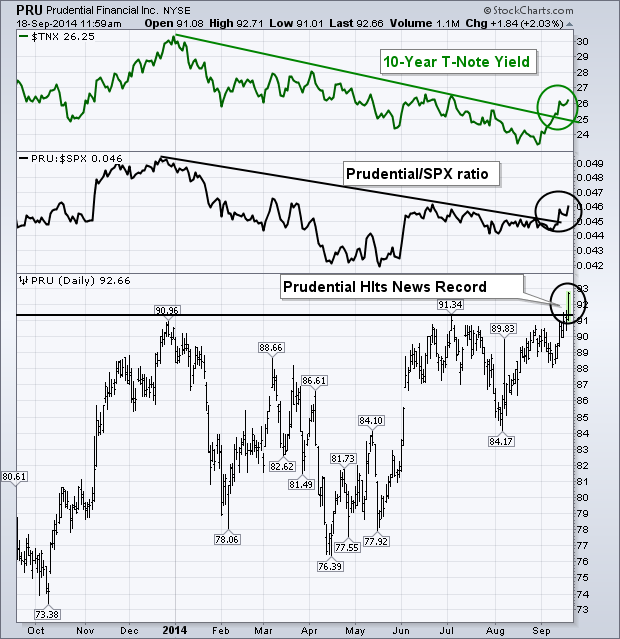
Rising Rates Help Insurance Portfolios
by John Murphy,
Chief Technical Analyst, StockCharts.com
Financial stocks are starting to show upside leadership at the same time that bond yields are starting to rise. Banks usually benefit from rising bond yields because they can charge higher rates for their loans. Two other financial groups have actually done better than banks this week. They include investment...
READ MORE
MEMBERS ONLY
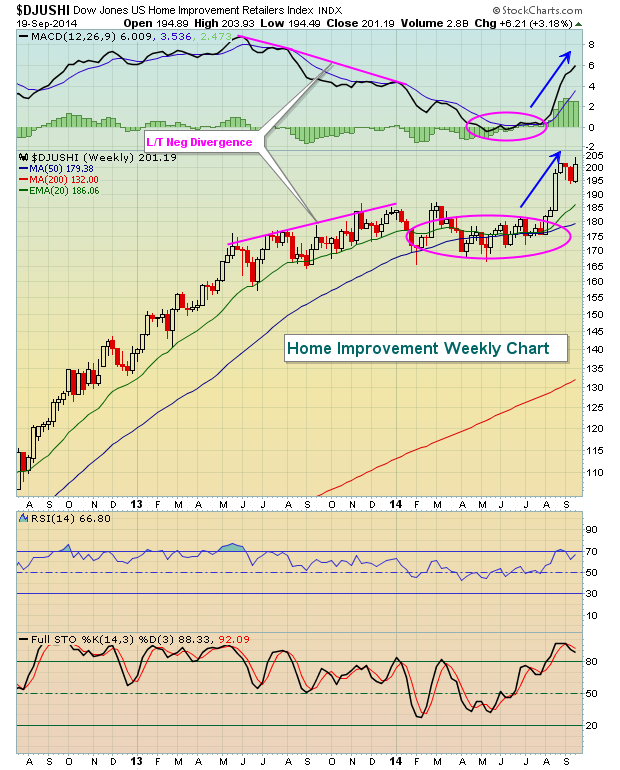
Remodeling Your Portfolio With Home Improvement Stocks

by Tom Bowley,
Chief Market Strategist, EarningsBeats.com
You should know by now that I'm a HUGE fan of the Moving Average Convergence Divergence (MACD) indicator. Other than the combination of price/volume and the use of candlesticks, it's probably my "go-to" indicator. As a case study for this weekend, let'...
READ MORE
MEMBERS ONLY
International equity market rotation on Relative Rotation Graphs(tm)

by Julius de Kempenaer,
Senior Technical Analyst, StockCharts.com
In a previous article we looked at using Relative Rotation Graphs for analyzing asset class rotation. One of the main caveats that was pointed out in that blog was to be very careful on what ticker symbols to use to construct the RRG with. Especially the mixture of yield series...
READ MORE
MEMBERS ONLY
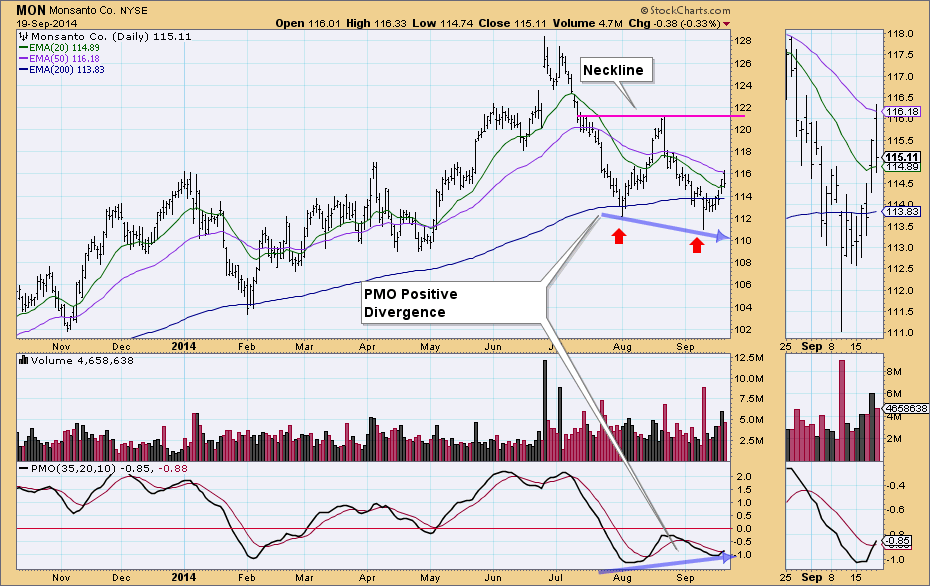
Possible Double-Bottom On Monsanto

by Erin Swenlin,
Vice President, DecisionPoint.com
This afternoon while going over the DP Tracker Report for the S&P 500, I checked the new Price Momentum Oscillator (PMO) BUY signals on the SPX-Plus Tracker to see if there were any signals that looked promising. There was one--Monsanto (MON).
First glance at the thumbnail, we see...
READ MORE
MEMBERS ONLY

Indicators - Bearish To Bullish Overnight?
by Erin Swenlin,
Vice President, DecisionPoint.com
I recently received an email from a DP Daily Update subscriber:
" On 9/16 [in the] DecisionPoint [blog] you wrote, "Indicators in all time frames are quite bearish." (First sentence of second to last paragraph.)
On 9/18 [in the] Decision Point Reports [blog] you wrote, "...
READ MORE
MEMBERS ONLY
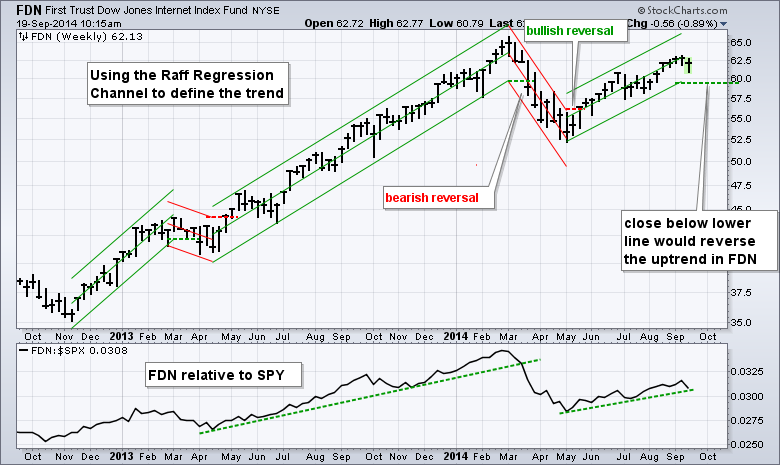
Using the Raff Regression Channel to Identify Trend Reversals in FDN
by Arthur Hill,
Chief Technical Strategist, TrendInvestorPro.com
Today's article will show how the use the Raff Regression Channel to define the trend and identify reversals using the Internet ETF (FDN). I am particularly interested in FDN because internet stocks represent the appetite for risk. An uptrend in FDN signals a strong appetite for risk and...
READ MORE
MEMBERS ONLY

SETTING A YEAREND TARGET FOR THE S&P 500 -- SMALL AND MID-CAP INDICES HOLD THEIR CHANNELS -- SEASONAL EVIDENCE FOR THE JANUARY EFFECT -- NAT GAS CONSOLIDATES WITHIN DOWNTREND -- FIRSTTRUST NATURAL GAS ETF HITS SUPPORT ZONE
by John Murphy,
Chief Technical Analyst, StockCharts.com
SETTING A YEAREND TARGET FOR THE S&P 500... Link for today's video. The S&P 500, S&P MidCap 400 and S&P Small-Cap 600 are all in uptrends, and the S&P 500 remains the clear leader. Even though one can...
READ MORE
MEMBERS ONLY

Gerald Loeb's Battle Plan for Investment Survival

by Gatis Roze,
Author, "Tensile Trading"
Sometimes the things that need to be said can’t be said any better than they were said in the past. I’m a big fan of Gerald Loeb (1899-1974), the man Forbes called the most quoted man on Wall Street. I’ve written about this extraordinary investor before.
https:...
READ MORE
MEMBERS ONLY
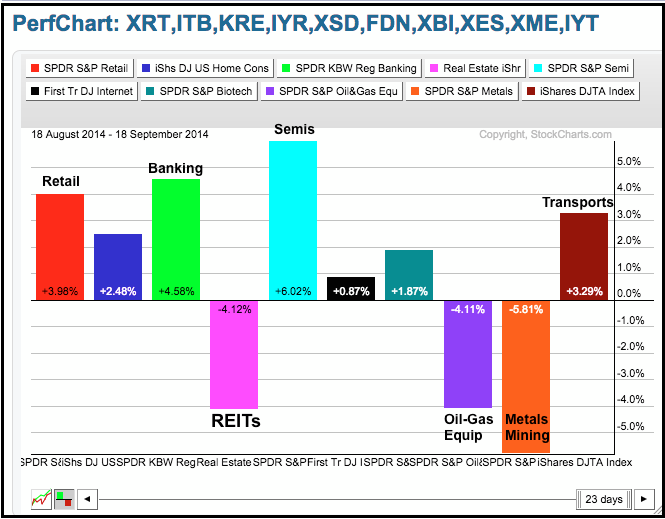
Retail, Banks, Semis and Transports Power Rally
by Arthur Hill,
Chief Technical Strategist, TrendInvestorPro.com
Stocks keep chugging higher as the major index ETFs closed with modest gains. The Nasdaq 100 ETF (QQQ) led the way with a .75% gain. Among the sectors, the Finance SPDR (XLF) surged 1% and the HealthCare SPDR (XLV) advanced .74%. Both recorded new highs. The Broker-Dealer iShares (IAI) and...
READ MORE
MEMBERS ONLY

LIFE INSURERS AND INVESTMENT SERVICE STOCKS BENEFIT FROM RISING BOND YIELDS -- PRUDENTIAL AND GOLDMAN SACHS ACHIEVE UPSIDE BREAKOUTS -- THE WISDOM TREE JAPAN HEDGED ETF ACHIEVES NEW RECOVERY HIGH ON PLUNGING YEN
by John Murphy,
Chief Technical Analyst, StockCharts.com
RISING RATES HELP INSURANCE PORTFOLIOS... Financial stocks are starting to show upside leadership at the same time that bond yields are starting to rise. Banks usually benefit from rising bond yields because they can charge higher rates for their loans. Two other financial groups have actually done better than banks...
READ MORE
MEMBERS ONLY
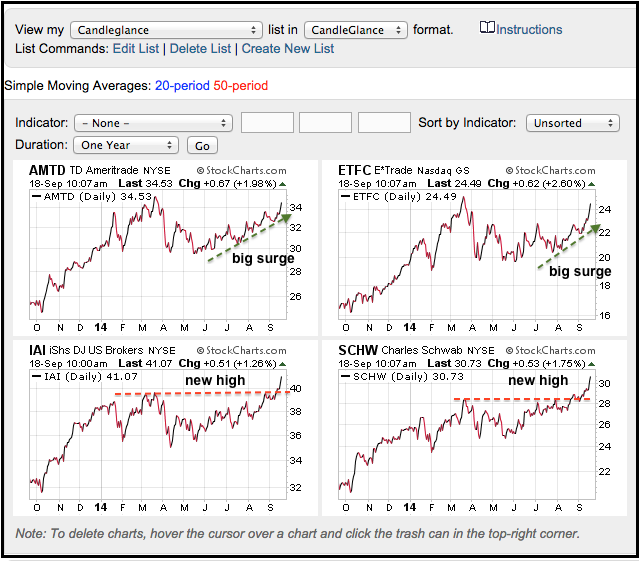
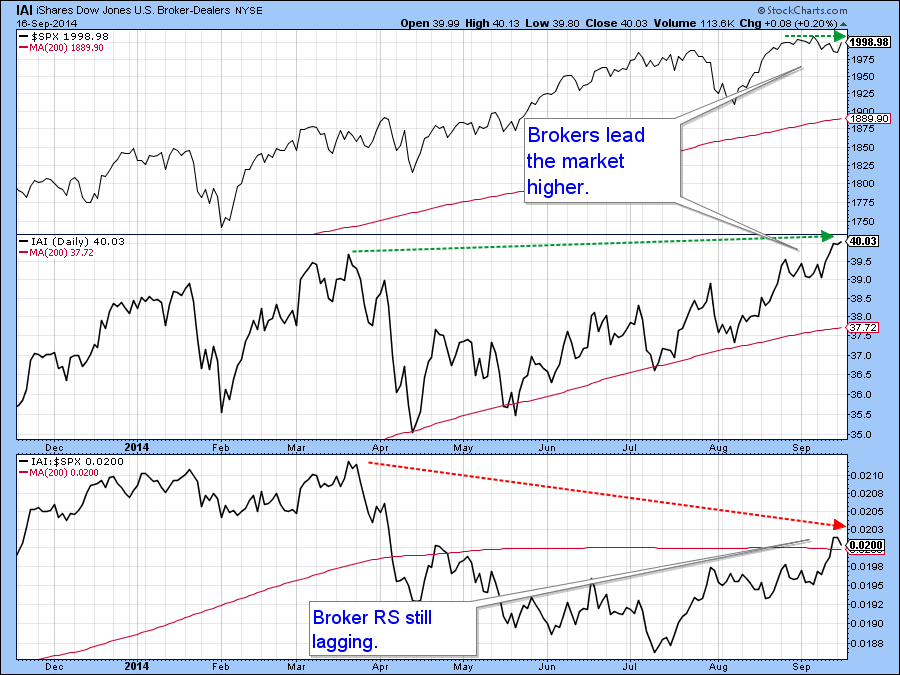
Schwab Leads Broker-Dealer iShares to New High
by Arthur Hill,
Chief Technical Strategist, TrendInvestorPro.com
The Broker-Dealer iShares (IAI) is showing leadership over the last few weeks with a surge above its March highs. Notice that the ETF is up around 10% from its early August low. Within the group, Charles Schwab (SCHW) is leading with a new high in late August and further strength...
READ MORE
MEMBERS ONLY
SPY and QQQ Hold Breakouts - IWM Lags - Six Setups
by Arthur Hill,
Chief Technical Strategist, TrendInvestorPro.com
The Fed has come and gone, and the major index ETFs managed to hold on to small gains. Finance, industrials and materials led the sector SPDRs higher, but their gains were modest (.39% to .60%). Energy was weak as oil fell again. Gold miners were hammered again as gold fell...
READ MORE
MEMBERS ONLY

DOW INDUSTRIALS HIT NEW HIGHS -- BANKS LEAD FINANCIALS HIGHER -- LENNAR LEADS BIG BOUNCE IN HOMEBUILDERS -- RATE BOUNCE AFTER FED MEETING PUSHES DOLLAR HIGHER AND GOLD LOWER -- RISING SHORT-TERM RATES CAN BE GOOD FOR STOCKS
by John Murphy,
Chief Technical Analyst, StockCharts.com
DOW INDUSTRIALS JOIN TRANSPORTS IN NEW HIGHS... Chart 1 shows the Dow Transports hitting another record high today, and remaining the strongest of the three Dow averages. Today's rally was led by rails and delivery services. Fedex gained 3.5% to lead the latter group higher. Chart 2...
READ MORE
MEMBERS ONLY
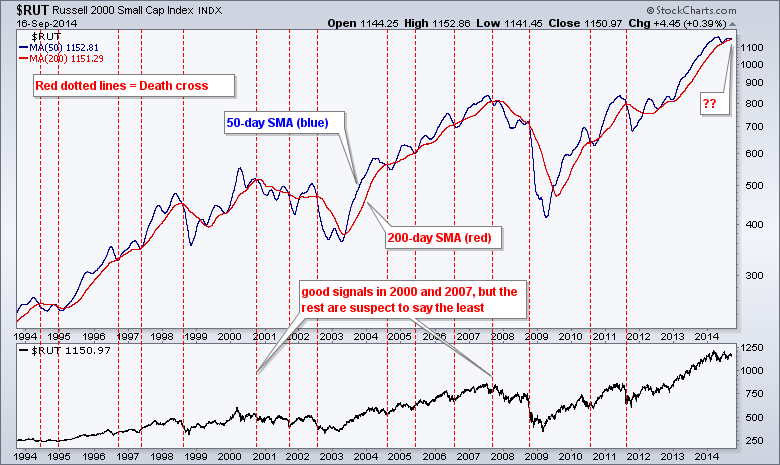
Would a Russell 2000 Death Cross Really be Bad?
by Arthur Hill,
Chief Technical Strategist, TrendInvestorPro.com
There is a lot of talk of an "impending" death cross for the Russell 2000. This event occurs when the 50-day simple moving average crosses below the 200-day SMA. While this event has triggered a couple of good signals over the last 20 years, the majority of signals...
READ MORE
MEMBERS ONLY
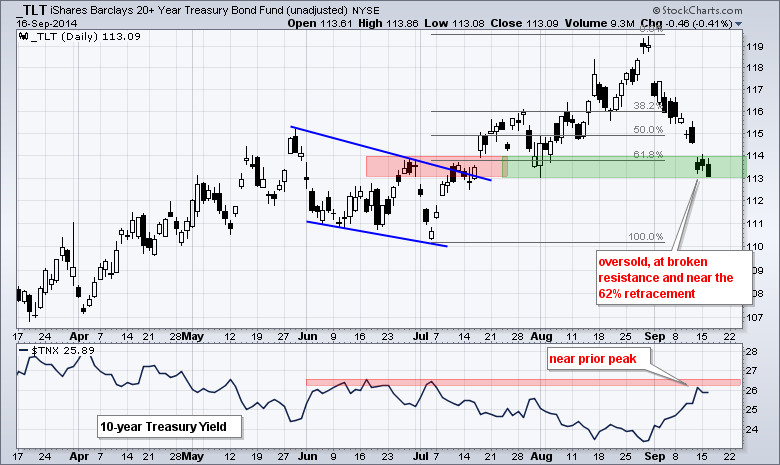
TLT Hits Key Level as Fed Looms
by Arthur Hill,
Chief Technical Strategist, TrendInvestorPro.com
Fed day is here and the markets will hang on every word from the Fed. Sometimes the markets even hang are words that don't appear in the Fed statement. Truth be told, I do not know what the Fed will say or do, and I do not know...
READ MORE
MEMBERS ONLY
Five Year Yield Experiences Major Upside Breakout
by Martin Pring,
President, Pring Research
* - Brokers experience new bull market closing high.
* - NYSE stocks above their 200-day MA’s continue to shrink.
* - Canadian dollar experiences false break to the downside.
* - Commodities break to the downside. Could it be a whipsaw?
US Equities
Tuesday’s strong equity action could well be a...
READ MORE
MEMBERS ONLY

DOW AND S&P 100 HOLD UP THE BEST -- INDUSTRIAL SECTOR SHOWS RELATIVE STRENGTH -- BANDWIDTH INDICATOR HITS NEW LOW FOR XLI -- 3M AND GENERAL ELECTRIC -- AEROSPACE & DEFENSE ETF PACES INDUSTRIALS -- ALLIANT TECH AND ROCKWELL COLLINS
by John Murphy,
Chief Technical Analyst, StockCharts.com
DOW AND S&P 100 HOLD UP THE BEST... Link for today's video. After a big advance in August, stocks succumbed to some selling pressure in September. This selling pressure, however, has not been uniformly spread throughout the stock market. As noted in Monday's Market...
READ MORE
MEMBERS ONLY
Using Breadth to Define Oversold - Plus CF, FOSL, LLTC, XLNX
by Arthur Hill,
Chief Technical Strategist, TrendInvestorPro.com
Stocks started the day weak and finished weak, except for some large-caps. The Russell 2000 iShares and Nasdaq 100 ETF led the market lower with 1% declines. The Dow Diamonds and S&P 100 ETF bucked the selling pressure to finish with fractional gains. The sector SPDRs were mixed...
READ MORE
MEMBERS ONLY
Have You Checked the DecisionPoint Chart Gallery Lately?
by Erin Swenlin,
Vice President, DecisionPoint.com
The free DecisionPoint Chart Gallery is a hidden gem with the link sitting in the middle of the StockCharts Homepage. You may want to review it daily (if you don't already!). The S&P 500 charts are free to view, but as a member you can also...
READ MORE
MEMBERS ONLY
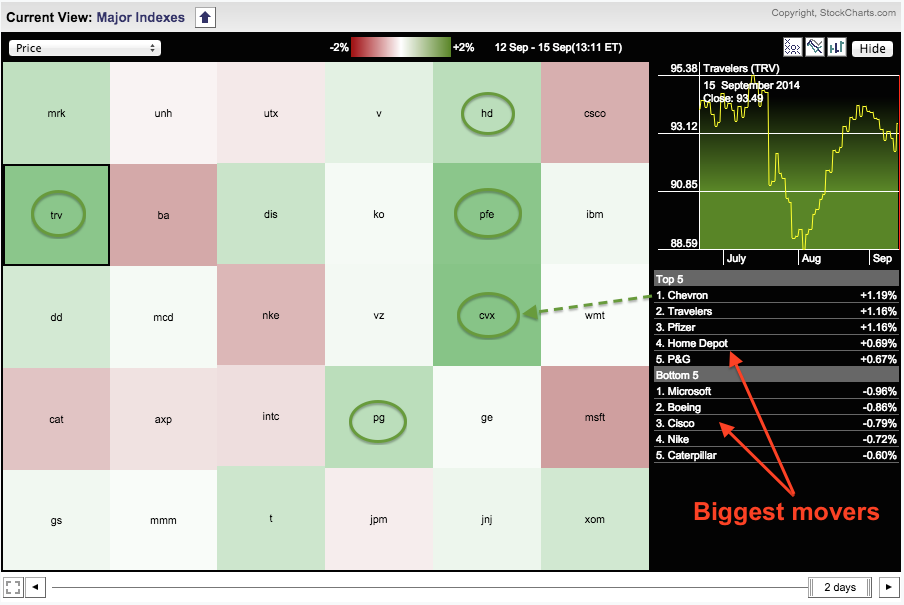
Energy and Pharma Stocks Lift the Dow
by Arthur Hill,
Chief Technical Strategist, TrendInvestorPro.com
The Dow Industrials is bucking the selling pressure with strength in Chevron, Pfizer, Travellers, Procter & Gamble and Home Depot (among others). Chartists can easily spot the winners and losers on a Market Carpet. The chart below shows at least ten green squares, which means these ten are up. There...
READ MORE
MEMBERS ONLY

SMALL-CAPS LEAD THE MARKET LOWER -- INTERNET ETF LEADS TECH SECTOR LOWER -- GOOGLE AND AMAZON SHOW RELATIVE WEAKNESS -- BIOTECHS AND SOLAR STOCKS LEAD MOMENTUM NAMES LOWER -- FINANCE SECTOR MOVES INTO SCTR TOP THREE
by John Murphy,
Chief Technical Analyst, StockCharts.com
SMALL-CAPS LEAD THE MARKET LOWER ... Link for today's video. The Russell 2000 iShares (IWM) and the S&P SmallCap iShares (IJR) are showing relative weakness in September and leading the current correction. There may be some debate on the term "correction" though. The S&...
READ MORE
MEMBERS ONLY
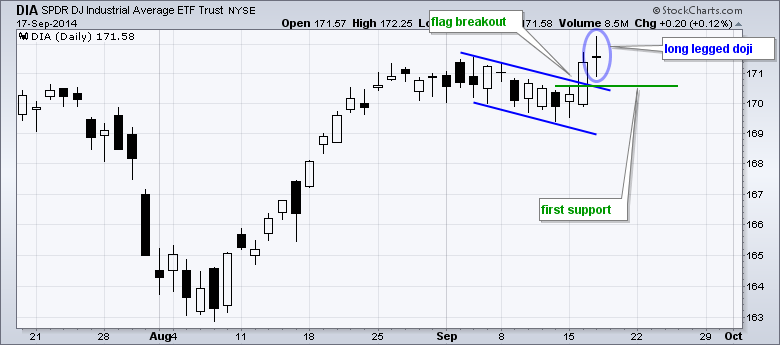
XLF Shows Relative Strength - Flags form in SPY and IWM
by Arthur Hill,
Chief Technical Strategist, TrendInvestorPro.com
It is Fed week and stocks are in corrective mode. IWM and SPY edged lower this month, while QQQ has traded flat since late August. The patterns for SPY and IWM look like falling flags, which are bullish continuation patterns. Breakouts in both would be quite bullish for the market...
READ MORE
MEMBERS ONLY

SWEDISH KRONA IS EUROPE'S WEAKEST CURRENCY -- FALLING COMMODITIES ALSO HURT AUSSIE AND CANADIAN DOLLARS -- TREASURY YIELDS ARE HIGHLY CORRELATED TO LOWER GERMAN YIELDS -- TREASURY YIELD JUMPS TO TWO-MONTH HIGH -- BOND ETFS HAVE WORST WEEK IN A YEAR
by John Murphy,
Chief Technical Analyst, StockCharts.com
MORE CURRENCY WEAKNESS... My mid-week message on the broadbased nature of the U.S. dollar rally showed a number of falling currencies, including the Euro, the Swiss franc, the British Pound, the Japanese yen, and the Canadian Dollar. Chart 1 adds two more. The blue line shows the Swedish Krona...
READ MORE
MEMBERS ONLY
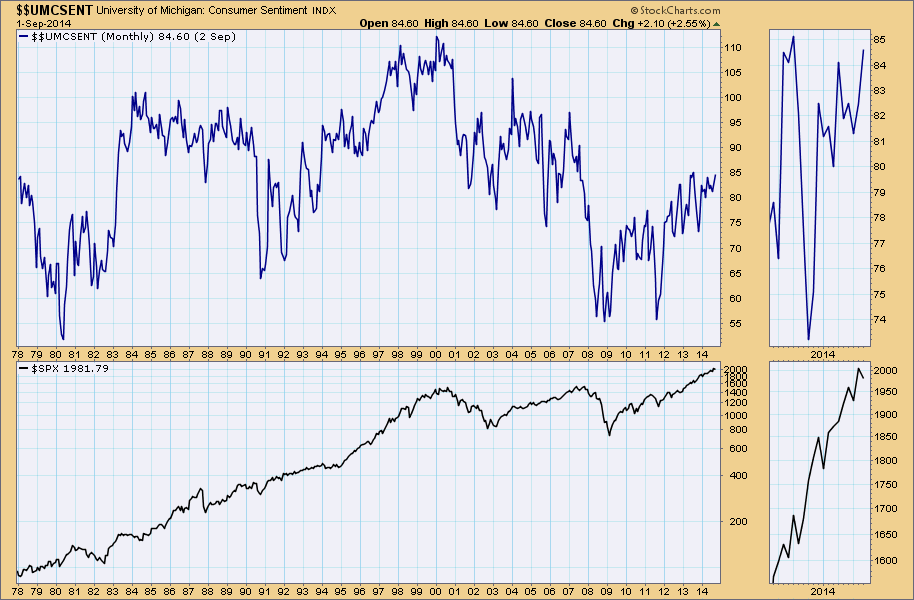
Consumer Sentiment Improves but Is Historically Mediocre
by Carl Swenlin,
President and Founder, DecisionPoint.com
Just a quick note here to look at the University of Michigan Consumer Sentiment chart. It has been reported that Consumer Sentiment improved this month, and that it is near last year's high; however, in the historical context it is only midway its 35-year range. This is notable...
READ MORE
MEMBERS ONLY

MAJOR INDICES STILL CONSOLIDATING WITHIN UPTRENDS -- FINANCE AND TECH SECTORS HOLD NEAR HIGHS -- BANK OF AMERICA AND TYCO BREAK OUT -- RISING 10-YR BOOSTS BANKS AND HURTS REITS -- COPPER ETF REVERSES UPSWING
by John Murphy,
Chief Technical Analyst, StockCharts.com
NIKKEI HITS SEVEN MONTH HIGH... Link for today's video. Despite some stalling over the last few weeks, the major stock indices remain in long-term uptrends. The S&P 500, S&P 500 Equal-Weight Index and the S&P 1500 all hit new highs in early...
READ MORE
MEMBERS ONLY
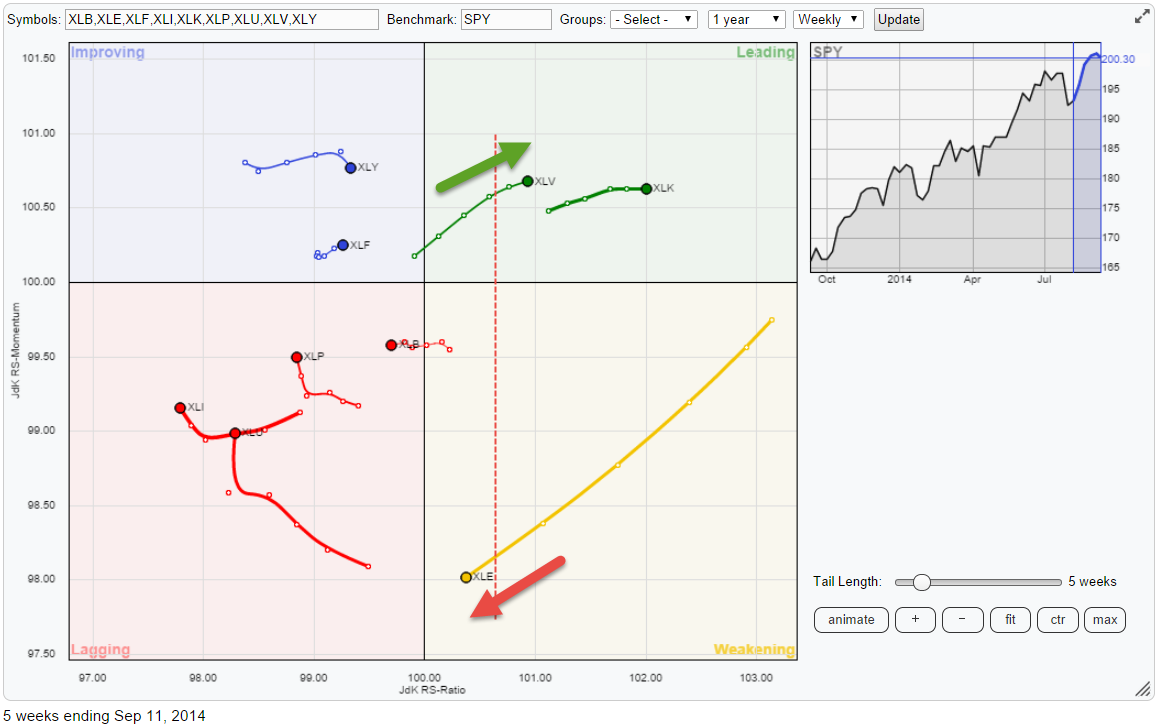
Strong relative rotation for Health Care and Technology
by Julius de Kempenaer,
Senior Technical Analyst, StockCharts.com
The Relative Rotation Graph of the nine sector ETFs against the S&P 500 (SPY) is showing some clear and distinct rotations at the moment. Especially the right hand side of the plot where we find the sectors that are (still) in relative up-trends against the broader S&...
READ MORE
MEMBERS ONLY

A Game of 21: 21 Investors / 21 Rules
by Gatis Roze,
Author, "Tensile Trading"
I don’t know of any college in the world that offers you a higher return per unit of effort than the value of a proper investment education. I believe a solid investment education is one of the most high leverage activities an individual can possibly do.
Bold statement, yes,...
READ MORE
MEMBERS ONLY
Financial Services Lead Small-cap Rebound
by Arthur Hill,
Chief Technical Strategist, TrendInvestorPro.com
Stocks were mixed on Thursday with the Russell 2000 iShares (IWM) moving higher and the Dow Diamonds (DIA) edging lower. Strength in financial services helped the Russell 2000 gain. The Regional Bank SPDR (KRE) gained .81% as the 10-YR Treasury Yield ($TNX) continued higher. The Retail SPDR (XRT) also showed...
READ MORE
MEMBERS ONLY

SHORT-TERM RATES REMAIN BELOW LONG-TERM RATES -- BUT THE GAP IS NARROWING -- THAT'S BEEN GOOD FOR STOCKS IN THE PAST -- RISING SHORT-TERM RATES ARE HELPING THE DOLLAR -- BUT ARE BEARISH FOR GOLD -- FALLING BULLION IS WEIGHING ON GOLD MINERS
by John Murphy,
Chief Technical Analyst, StockCharts.com
ANOTHER WAY TO LOOK AT YIELD CURVE... My Wednesday message included a paragraph on the yield curve. One of the charts, however, overlaid the 2-year and 10-year Treasury yields on the same chart. I was trying to show that short-term rates were rising, while long-term yields were dropping. That chart,...
READ MORE
