MEMBERS ONLY
Getting a Quick Daily Market Overview

by Carl Swenlin,
President and Founder, DecisionPoint.com
After Erin's presentation at ChartCon 2014 many attendees responded positively to learning about the DP Daily Update, which is located in the DP Reports Blog (available to StockCharts EXTRA and above subscribers). The purpose of the DP Daily Update is to quickly review the day's action,...
READ MORE
MEMBERS ONLY
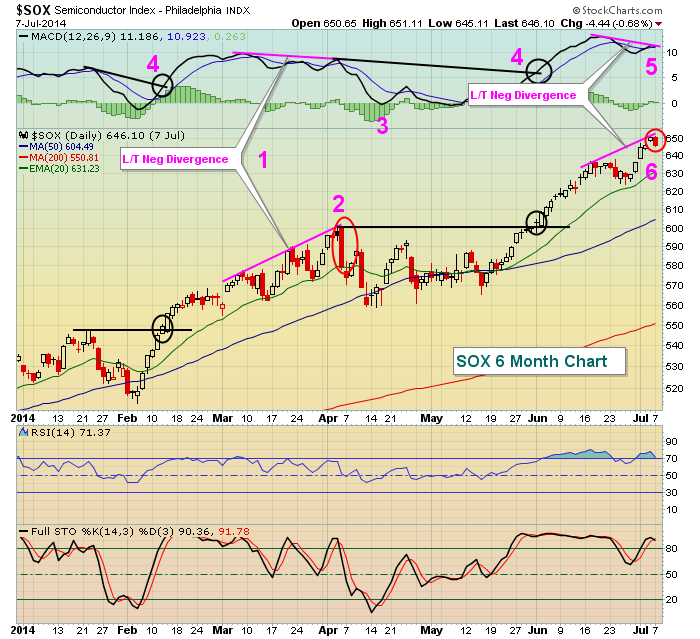
Price Support Holds After Momentum Slows

by Tom Bowley,
Chief Market Strategist, EarningsBeats.com
The NASDAQ has been powering forward off the mid-April lows and one big reason has been the semiconductor industry. The Philadelphia Semiconductor index ($SOX) rose 15% in just a seven week period from May 15th through July 3rd. From there, a severe long-term negative divergence printed and that suggested that...
READ MORE
MEMBERS ONLY
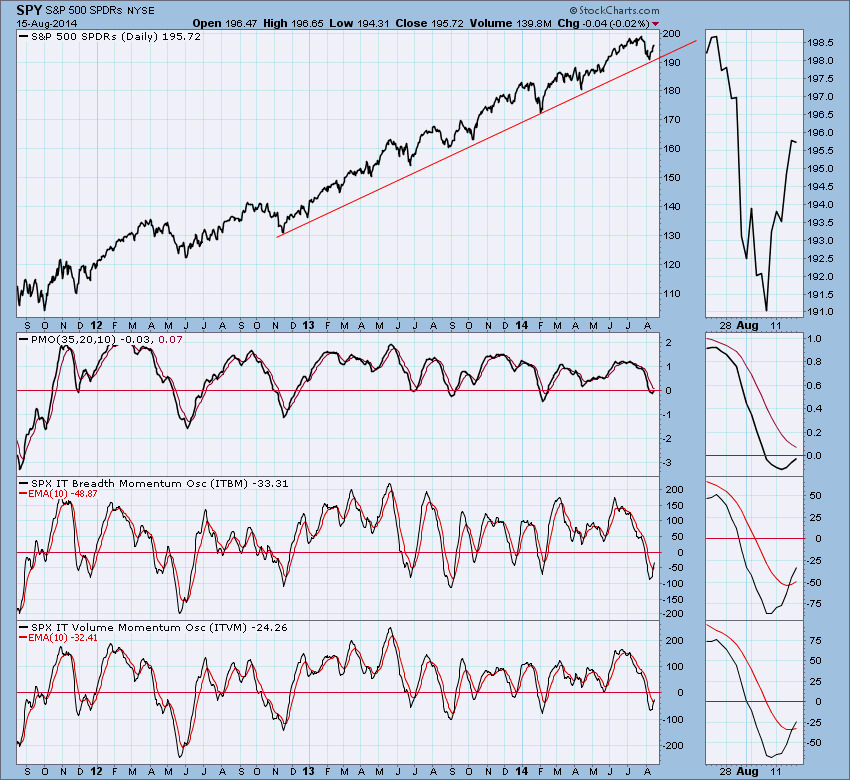
DP Daily Update: Drifting Above Resistance - August 14, 2014
by Carl Swenlin,
President and Founder, DecisionPoint.com
This is a sample of the DP Daily Update, which is available to StockCharts EXTRA and above subscribers. The purpose of the DecisionPoint Daily Update is to quickly review the day's action, internal condition, and Trend Model status of the broad market (S&P 500), the nine...
READ MORE
MEMBERS ONLY

SETTING FIRST SUPPORT FOR SPY BOUNCE -- TREASURIES SURGE ON TAME PPI -- GOLD REVERSES COURSE ON GEOPOLITICAL TENSIONS -- URANIUM ETF SURGES OFF SUPPORT -- CAMECO LEADS URANIUM ETF HIGHER -- AD LINE AND AD VOLUME LINE REVERSE SHORT-TERM DOWNTRENDS

by John Murphy,
Chief Technical Analyst, StockCharts.com
SETTING FIRST SUPPORT FOR SPY BOUNCE... Link for today's video. Stocks opened strong and then sold off on reports suggesting an escalation of tensions in Ukraine - at least that was reasoning in the financial media. As of noon, the S&P 500 SPDR (SPY) was trading...
READ MORE
MEMBERS ONLY

My Top 12 Takeaways from ChartCon 2014

by Gatis Roze,
Author, "Tensile Trading"
It was wonderful to see so many familiar faces this past weekend at the ChartCon 2014 Conference. I know I walked away a more energized trader with a handful of new tactical options and strategies and a number of tradeable ideas I’m presently working through.
Listed below are some...
READ MORE
MEMBERS ONLY
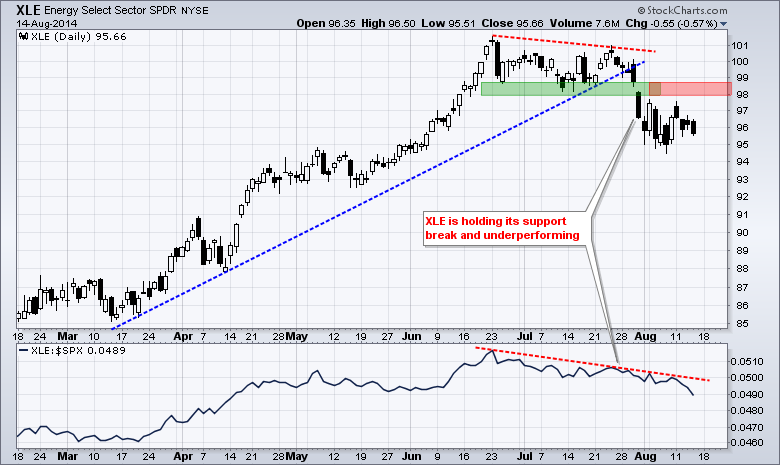
XLE Holds its Break Down - GLD Stalls at Resistance

by Arthur Hill,
Chief Technical Strategist, TrendInvestorPro.com
Stocks edged higher on Thursday with the major index ETFs scoring modest gains. The HealthCare SPDR (and the Utilities SPDR (XLU) led the sectors, while the Energy SPDR (XLE) lagged with a loss. Another break down in Spot Light Crude ($WTIC) weighed on the energy sector. The consumer discretionary sector...
READ MORE
MEMBERS ONLY

$SPX BOUNCES OFF THE PRIMARY TREND ON THE MONTHLY CHARTS -- $SPX 30 WEEK MA HAS BEEN SOLID SUPPORT FOR 20 MONTHS -- CHANGE IN $SPX SLOPE DEFINES THE NEXT TEST -- $SPX TESTS BOTH THE 20 DMA AND 50 DMA FROM BELOW
by John Murphy,
Chief Technical Analyst, StockCharts.com
$SPX BOUNCES OFF THE PRIMARY TREND ON THE MONTHLY CHARTS... With the bounce off last weeks lows, we have moved back above the monthly trend off the 2011-2012 lows on the S&P 500 ($SPX). This level also coincides with some moving averages on shorter time frames. The confluence...
READ MORE
MEMBERS ONLY
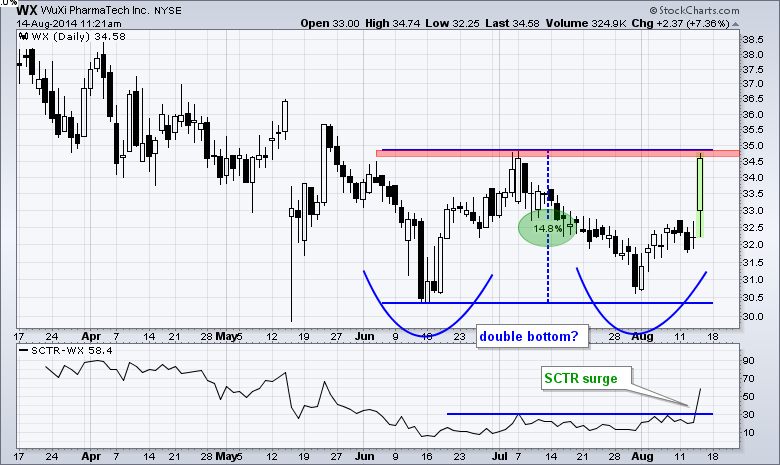
WuXi Surges to Form Bullish Reversal Pattern
by Arthur Hill,
Chief Technical Strategist, TrendInvestorPro.com
WuXi PharmaTech (WX) is a mid cap stock showing a big gain in its StockCharts Technical Rank (SCTR) on Thursday. Notice that the SCTR surged above 50 and to its highest level since May. On the price chart, the two lows in the 30.5 area form a possible double...
READ MORE
MEMBERS ONLY
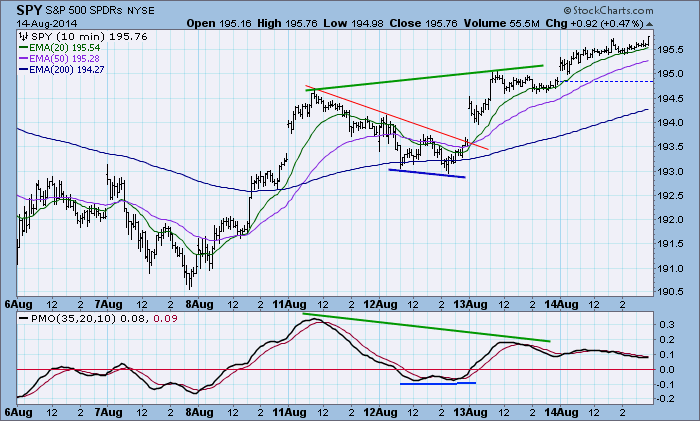
SPY Breaks Flag Trend Line - Gold is on the Verge
by Arthur Hill,
Chief Technical Strategist, TrendInvestorPro.com
Stocks advanced on Wednesday with a fairly broad-based rally. Volume was low, but volume is supposed to be low in mid August so I would not read too much into this indicator right now. In addition, exchange volume has not been that great of an indicator for signs of accumulation...
READ MORE
MEMBERS ONLY
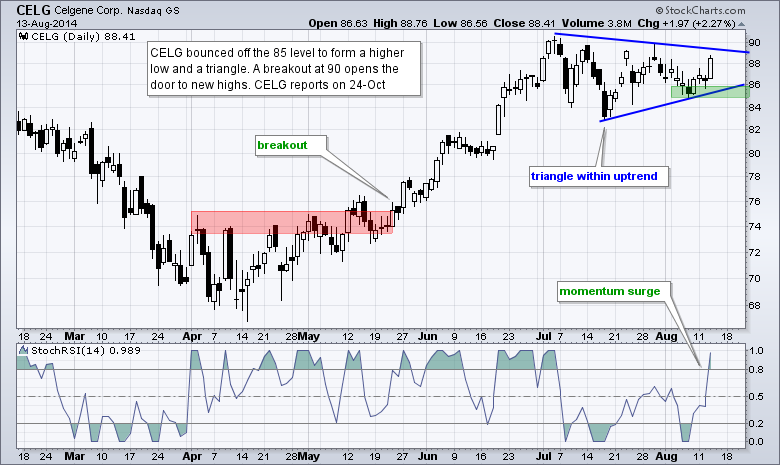
Four Bullish Setups and One Bearish Setup
by Arthur Hill,
Chief Technical Strategist, TrendInvestorPro.com
There are five setups today. First, we have a biotech forming a triangle in an uptrend. Second, there is an auto retailer with a bearish wedge. Third, we have a biotech services company with a triangle breakout. Fourth, there is a steel stock showing signs of accumulation. And finally, we...
READ MORE
MEMBERS ONLY

Oversold Condition Should generate a Short-term US Equity Rally as Part of an Overall Topping Process

by Martin Pring,
President, Pring Research
* Bottom Fisher indicator may be close to an upside reversal.
* If the rally develops watch the value Line Arithmetic for an indication of its resilience.
* Gold shares may be about to break to the upside.
(Click here for a video version of this article.)
US Equities
Last week the NYSE...
READ MORE
MEMBERS ONLY
Oversold Condition Should generate a Short-term US Equity Rally as Part of an Overall Topping Process (Video)
by Martin Pring,
President, Pring Research
(Click here for the written version of this article.)...
READ MORE
MEMBERS ONLY
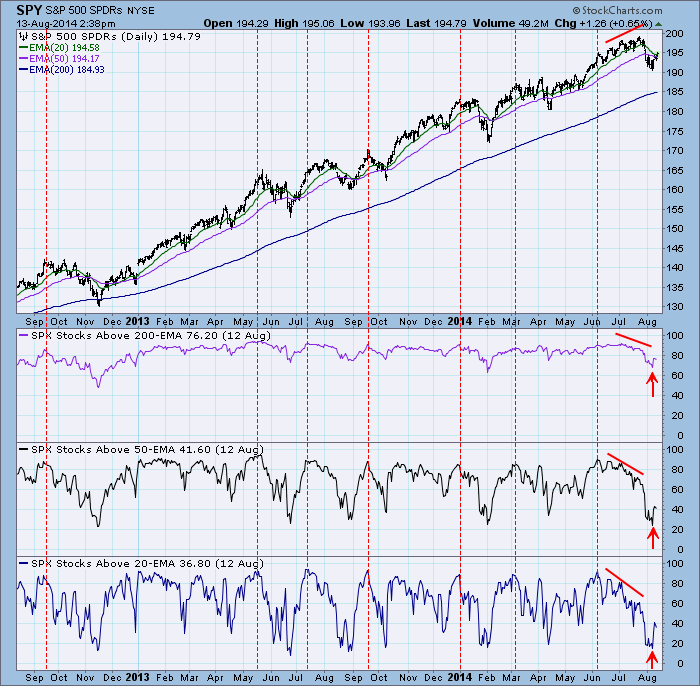
Percentage of Stocks Above Their 20/50/200-EMAs Looks Bullish
by Carl Swenlin,
President and Founder, DecisionPoint.com
Our indicators, the Percentage of Stocks Above their 20/50/200EMAs, gives us a view of market internals in three time frames: the 20EMA is short-term, the 50EMA is medium-term, and the 200EMA is long-term. When they have all reached the same extreme on either side of their normal range,...
READ MORE
MEMBERS ONLY
Major Index ETFs Pull Back with Bull Flags
by Arthur Hill,
Chief Technical Strategist, TrendInvestorPro.com
Stocks surge from early Friday to early Monday and then corrected from Monday afternoon to Tuesday. A four day chart reveals a pattern similar to a 1-2 day surge followed by a 1-2 day falling flag. In other words, this week's pullback may just be a mini correction...
READ MORE
MEMBERS ONLY

FINANCE SECTOR BOUNCES OFF KEY RETRACEMENT -- GOLD MINERS ETF GETS A BULLISH MOMENTUM SIGNAL -- SMALL-CAP BREADTH IMPROVES -- HIGH-LOW LINE LINES REMAIN NEGATIVE -- USING THE VIX TO TIME A MARKET BOUNCE
by John Murphy,
Chief Technical Analyst, StockCharts.com
FINANCE SECTOR BOUNCES OFF KEY RETRACEMENT... Link for today's video. The Finance SPDR (XLF) is showing some relative strength early Tuesday with a modest advance. Chart 1 shows XLF hitting the 50% retracement in late July and firming for seven days. This firmness turned to buying pressure the...
READ MORE
MEMBERS ONLY
Five Stocks with Bullish Chart Patterns
by Arthur Hill,
Chief Technical Strategist, TrendInvestorPro.com
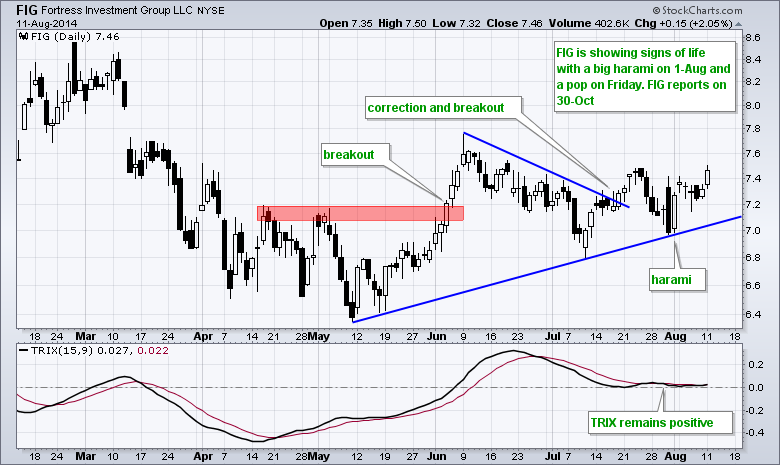
There are five setups today. First, we have an investment manager with follow through to a big harami. Second, there is an airline making a breakout. Third, we feature a volatile online real estate stock with a bullish consolidation. Fourth, there is a truck part manufacturer with a gap and...
READ MORE
MEMBERS ONLY
IWM Goes for a Breakout as QQQ Stalls in Resistance Zone
by Arthur Hill,
Chief Technical Strategist, TrendInvestorPro.com
Stocks followed up on Friday's gains with a strong open on Monday. There was not much follow through to this strong open, but the gains did hold for the most part. Short-term, I would say the cup is half full (bullish) until proven otherwise. A filling of Monday&...
READ MORE
MEMBERS ONLY

SMALL-CAPS START SHOWING RELATIVE STRENGTH -- TREND, SETUP AND TRIGGER FOR IWM -- XRT BREAKS RESISTANCE ZONE -- SOCIAL MEDIA ETF FORMS BULLISH CONTINUATION PATTERN -- COAL STOCKS TURN INTO MARKET LEADERS -- XME BREAKS RIM RESISTANCE
by John Murphy,
Chief Technical Analyst, StockCharts.com
SMALL-CAPS SHOW A LITTLE RELATIVE STRENGTH ... Video note: I am on the road today and there is no video for Monday. Video will return on Tuesday when I get back to the office. Even though it is just one week, small-caps are starting to show relative strength by outperforming. Note...
READ MORE
MEMBERS ONLY
Boeing Hits Big Support Zone and Becomes Oversold
by Arthur Hill,
Chief Technical Strategist, TrendInvestorPro.com
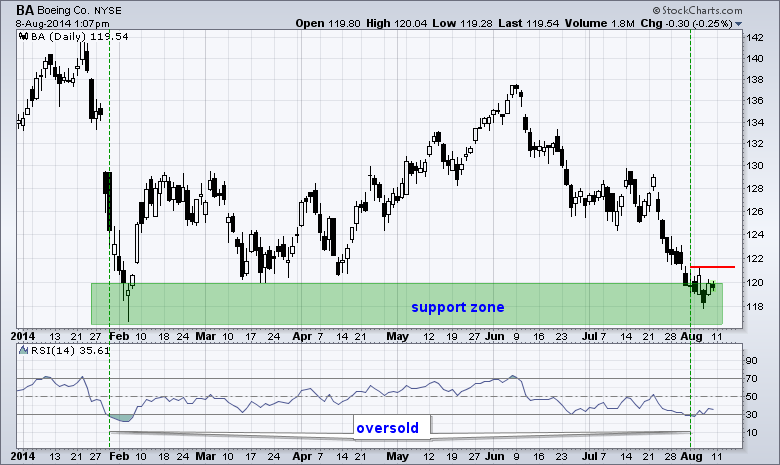
It has been a rough year for Boeing, but the stock may be poised for an oversold bounce. After a big plunge in January, the stock firmed for a few months and then worked its way higher in April-May. BA peaked in early June and fell back to support over...
READ MORE
MEMBERS ONLY

Evidence-Based Trading for Dummies
by Gatis Roze,
Author, "Tensile Trading"
Robin Griffiths, the renowned technical strategist, once opined that “Trading is a traffic light system. At a traffic light, you wait for it to turn green and then you go. You don’t try to predict when it’ll go green.”
Unfortunately, far too many investors believe that to achieve...
READ MORE
MEMBERS ONLY

QQQ REMAINS THE LONE HOLD OUT -- IGN AND XSD HOLD SUPPORT BREAKS -- MARKETVECTORS RETAIL ETF BREAKS DOWN, BUT XRT HOLDS FIRM -- MEDIA AND LEISURE ETFS WEIGH ON CONSUMER DISCRETIONARY -- GOLD IGNORES DOLLAR WITH SURGE ABOVE 1300
by John Murphy,
Chief Technical Analyst, StockCharts.com
QQQ REMAINS THE LONE HOLD OUT... Link for today's video. The Russell 2000 iShares (IWM) peaked in early July and fell the last five weeks. The S&P 500 SPDR (SPY) held out, but succumbed to selling pressure in late July and broke first support. The Nasdaq...
READ MORE
MEMBERS ONLY
Stocks Remain Weak as Bonds Surge
by Arthur Hill,
Chief Technical Strategist, TrendInvestorPro.com
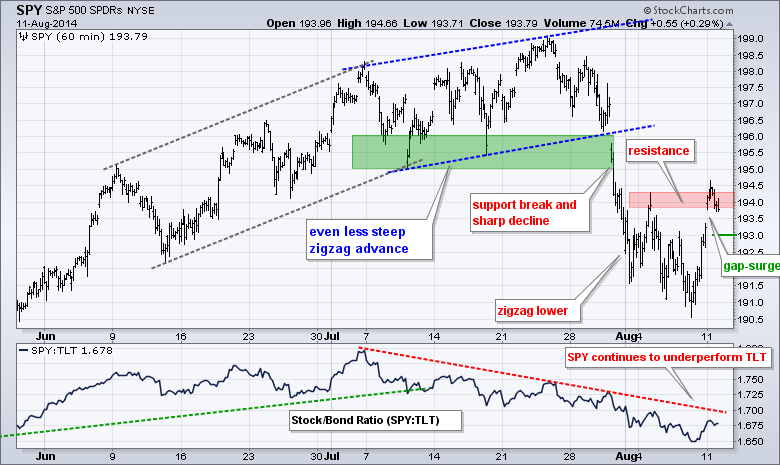
I am going straight to the charts, but here is a summary. QQQ, IWM and SPY remain in downtrends. QQQ and SPY held the late July support breaks. IWM, however, is showing some relative strength over the past weeks and chartists should watch for a breakout. Treasuries continue to move...
READ MORE
MEMBERS ONLY

CONSUMER STAPLES (XLP) BECOMES THE STRONGEST SECTORS ON THE WEEK -- UTILITIES (XLU) CONTINUE TO UNDER PERFORM -- COMPLIMENTING SECTOR PERF CHARTS WITH RELATIVE ROTATION GRAPHS -- THE ENERGY SECTOR MOVES INTO THE WEAKENING QUADRANT
by John Murphy,
Chief Technical Analyst, StockCharts.com
CONSUMER STAPLES (XLP) BECOMES THE STRONGEST SECTOR OF THE WEEK... Since August 1, the Sector SPDR Consumer Staples (XLP) has really surged. It has become the top sector on the week. Notice the box in the bottom right of Chart 1 says 6 days.
On Chart 2, XLP is now...
READ MORE
MEMBERS ONLY
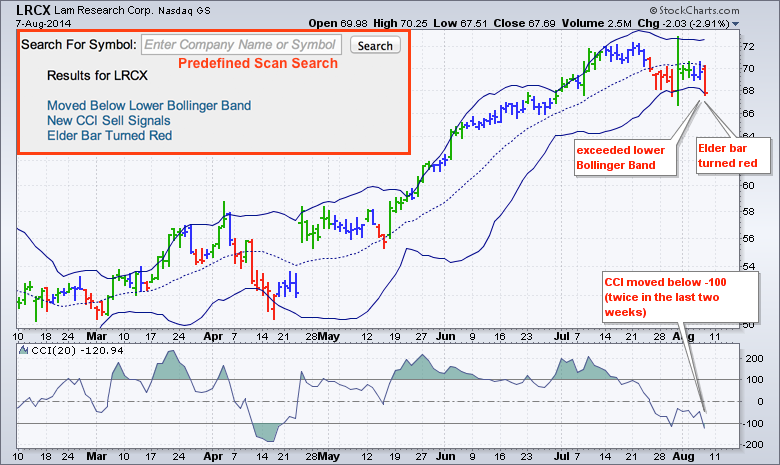
Lam Research Makes Three Bearish Scans $LRCX
by Arthur Hill,
Chief Technical Strategist, TrendInvestorPro.com
Chartists can search pre-defined scans to find out if their favorite stock or ETF triggered any scans. The chart below shows Lam Research (LRCX) triggering three bearish scans today. The Elder bar turned red, the stock moved below the lower Bollinger Band and the Commodity Channel Index (CCI) moved below...
READ MORE
MEMBERS ONLY
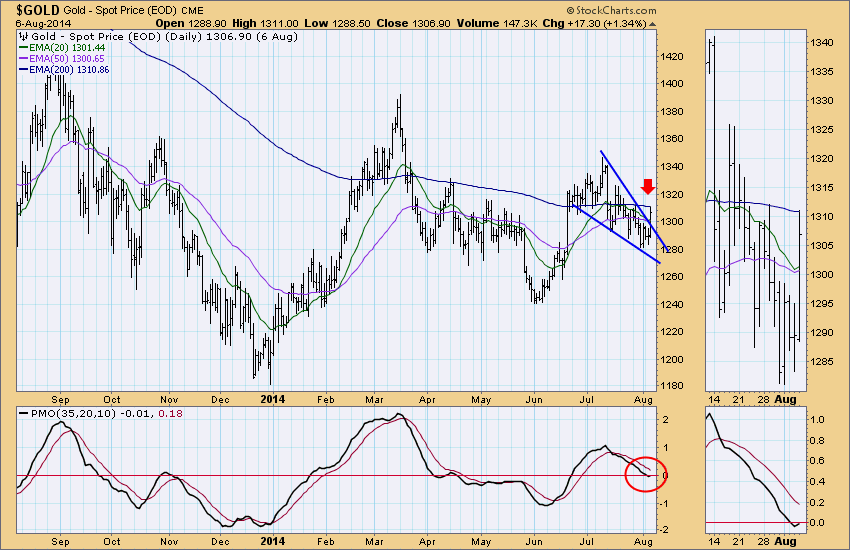
Gold Breaks Out From Falling Wedge

by Erin Swenlin,
Vice President, DecisionPoint.com
Yesterday, gold rallied and broke out from the bullish descending wedge that was formed over the past month or so. The technical expectation of a falling wedge pattern is a breakout and it happened. Remember, that the only expectation of wedge patterns is a breakout (falling wedge) or breakdown (rising...
READ MORE
MEMBERS ONLY
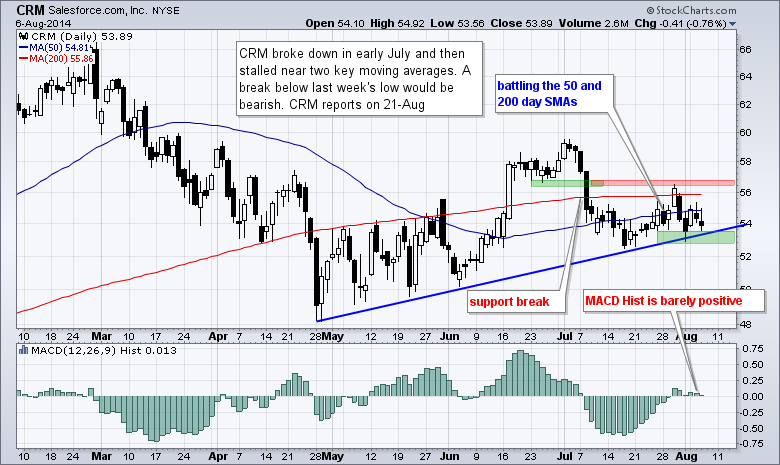
Four Charts Setting Up for a Move
by Arthur Hill,
Chief Technical Strategist, TrendInvestorPro.com
There are four setups today. We start with a big software stock showing weakness near two key moving averages. Second, there is a consumer services stock with a bullish wedge. Third, we feature a tech stock breaking out with strong volume patterns. And finally, there is a social media stock...
READ MORE
MEMBERS ONLY
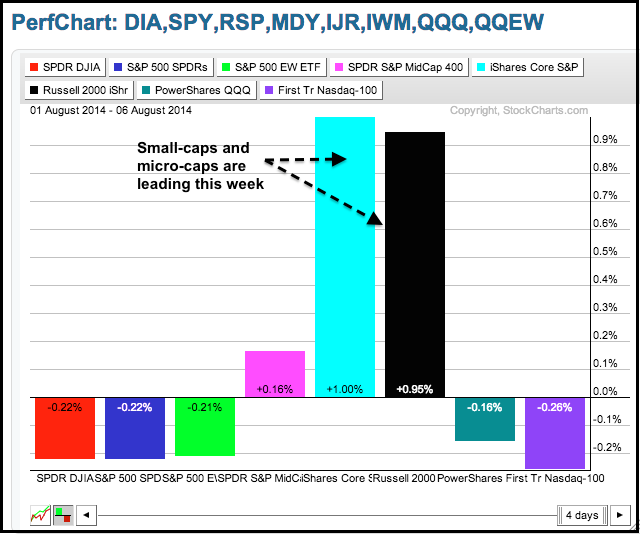
Small-Cap ETF Firms, but Remains Short of Breakout
by Arthur Hill,
Chief Technical Strategist, TrendInvestorPro.com
Stocks were mixed on Wednesday, but small-caps and micro-caps are starting to show some relative strength. The PerfChart below shows the performance for eight major index ETFs this week. IWM and IWC are up around 1% and leading the pack. MDY is the only other one showing a gain. SPY,...
READ MORE
MEMBERS ONLY
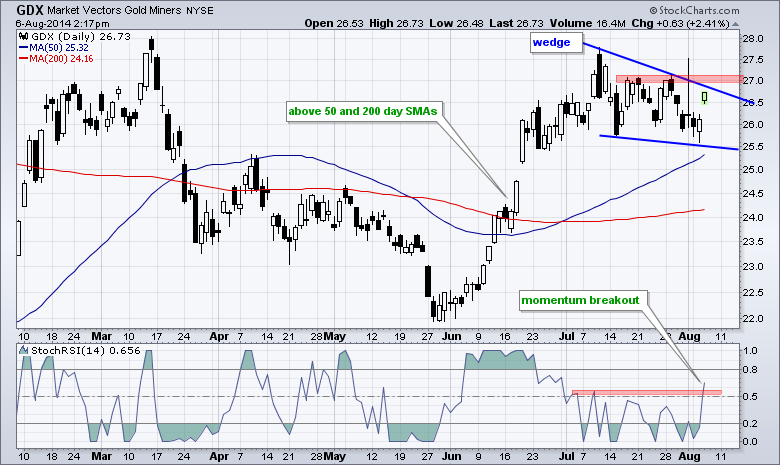
Gold Miners ETF Gets a Momentum Breakout
by Arthur Hill,
Chief Technical Strategist, TrendInvestorPro.com
The Gold Miners ETF (GDX) is reacting to strength in gold with a gap and 2+ percent surge. The chart below shows GDX forming a wedge above the 50 and 200 day moving averages. The ETF gapped up within this wedge and StochRSI surged above its July highs for a...
READ MORE
MEMBERS ONLY

THE DOW AND S&P 500 ARE TESTING THEIR 200 AND 100-DAY MOVING AVERAGES RESPECTIVELY -- RUSSELL 2000 AND EUROZONE ISHARES NEAR SUPPORT AT SPRING LOWS -- OVERSOLD HIGH YIELD BOND ETF IS ALSO TESTING 200-DAY AVERAGE -- SEE YOU IN SEATTLE
by John Murphy,
Chief Technical Analyst, StockCharts.com
DOW IS TESTING 200-DAY LINE ... The Dow Industrials have already reached their 200-day moving average. At the same time, the 14-day RSI line (above chart) has reached a short-term oversold reading at 30. This is an important test for the Dow and the rest of the market. Chart 2 shows...
READ MORE
MEMBERS ONLY
IWM Firms, but Remains Short of Breakout
by Arthur Hill,
Chief Technical Strategist, TrendInvestorPro.com
There are no real changes in the trends so I just updated the charts.
**This chart analysis is for educational purposes only, and should not
be construed as a recommendation to buy, sell or sell-short said securities**
**************************************************************
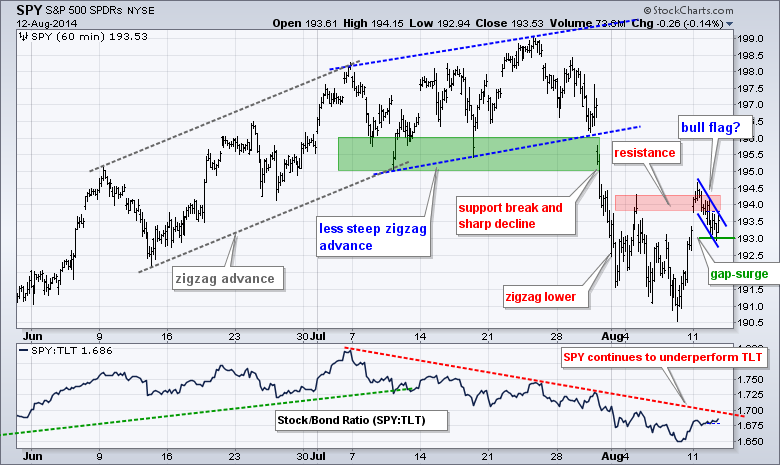
SPY remains in a short-term downtrend after the support break in the 195-196...
READ MORE
MEMBERS ONLY
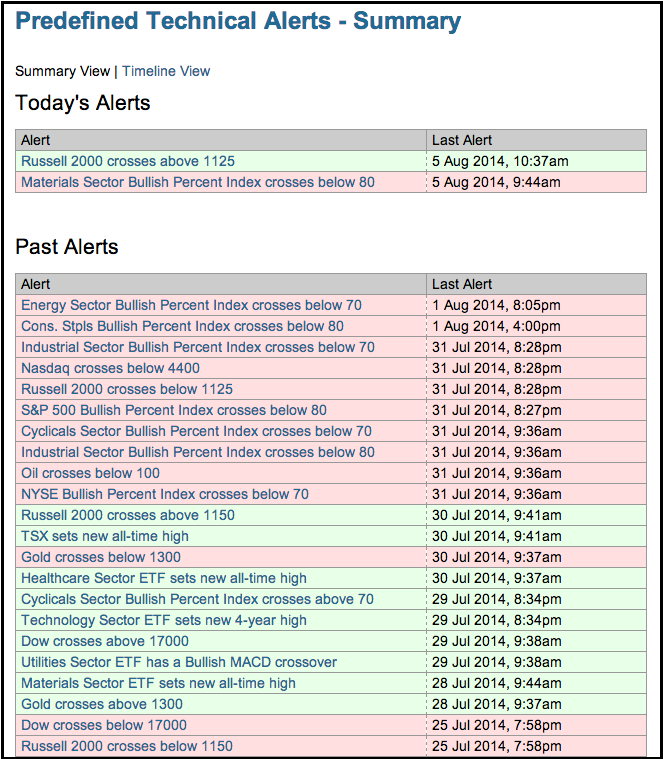
The Red Technical Alerts are Piling Up
by Arthur Hill,
Chief Technical Strategist, TrendInvestorPro.com
The pre-defined technical alerts page is a great place see the positive and negative events of the last few days. The image below shows a green (positive) alert for the Russell 2000 and a red (negative alert for the Materials SPDR (XLB). Prior to today, there were eleven negative alerts...
READ MORE
MEMBERS ONLY

INTERNET ETF CONSOLIDATES AT MOMENT-OF-TRUTH -- GOOGLE TESTS SUPPORT AS YAHOO STALLS AT RESISTANCE -- A SHIFT IN SENTIMENT TOWARDS UTILITIES -- THREE UTILITIES ETFS BREAK SUPPORT -- OIL BREAKS LONG-TERM SUPPORT
by John Murphy,
Chief Technical Analyst, StockCharts.com
INTERNET ETF CONSOLIDATES AT MOMENT-OF-TRUTH ... Chart 1 shows the Internet ETF (FDN) advancing to the 62% retracement and consolidating with a triangle. This is a make-or-break level for the ETF. A triangle after an advance is typically a bullish continuation pattern. As such, a break above the upper trend line...
READ MORE
MEMBERS ONLY

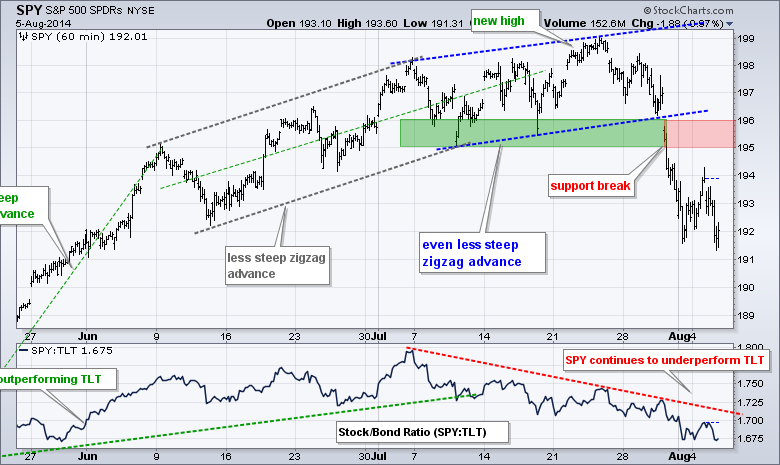
Equities Continue to Show Long-term Deterioration
by Martin Pring,
President, Pring Research
* Value Line Arithmetic violates key uptrend line.
* Introducing the Bottom Fisher, but unfortunately not the bottom!
* Stock/bond ratio at the brink.
* 5-year yield between two key converging trend lines.
* Gold/stock ratio on the verge of an upside breakout.
US Equities
The bullish seasonal end of the month period...
READ MORE
MEMBERS ONLY
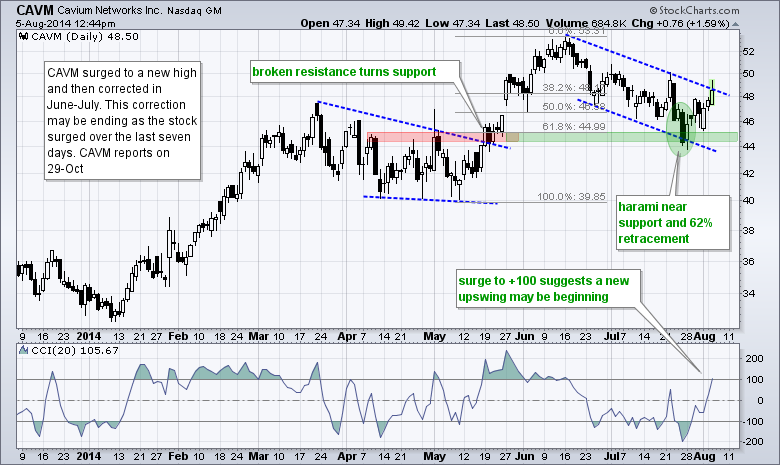
Four Chart Setups: Three Bulls and One Bear
by Arthur Hill,
Chief Technical Strategist, TrendInvestorPro.com
There are four setups today. We start with a volatile networking stock challenging a channel trend line. Next, there is a major airline testing support. Third, we are featuring an apparel retailer showing resilience near support. And finally, there is a semiconductor equipment stock with a bearish pennant.
**This chart...
READ MORE
MEMBERS ONLY
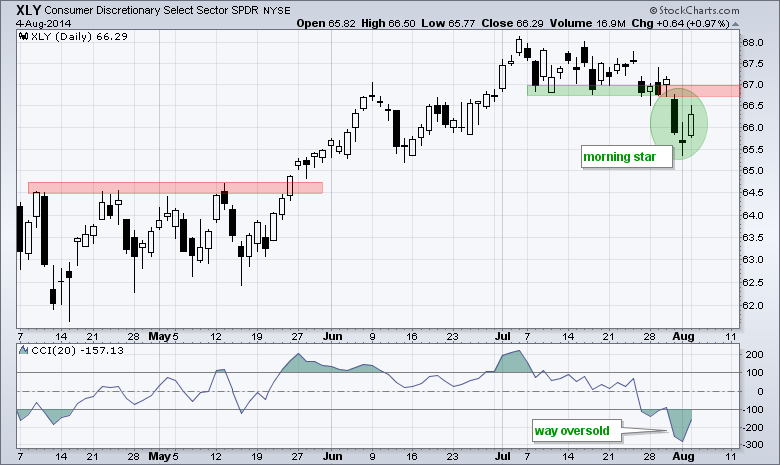
XLY Forms Morning Star as Retails Catch a Bid
by Arthur Hill,
Chief Technical Strategist, TrendInvestorPro.com
Stocks rebounded on Monday with a broad advance that lifted most sectors and industry groups. The Materials SPDR and Energy SPDR led with 1+ percent gains. The Utilities SPDR lagged with a .54% loss. Of note, the Consumer Discretionary SPDR was the third strongest sector with a .97% gain. Strength...
READ MORE
MEMBERS ONLY
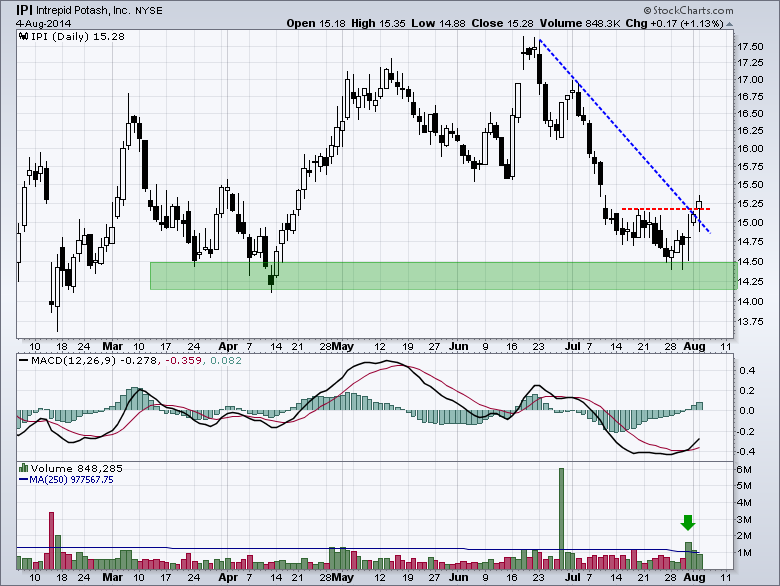
Potash Player Gets MACD Cross on Good Volume
by Arthur Hill,
Chief Technical Strategist, TrendInvestorPro.com
Intrepid Potash (IPI) fell to support in July, firmed for a few days and then surged above first resistance with good volume. Support stems from the March-April lows, and now the July low. The indicator window shows MACD moving above its signal line the last two days. This breakout is...
READ MORE
MEMBERS ONLY

FINANCE SPDR TESTS THE MAY BREAKOUT -- MORGAN STANLEY AND JP MORGAN TESTS KEY SUPPORTS -- THREE IMPROVING INDUSTRY GROUPS ON RRG -- REGIONAL BANK SPDR HEADS FOR MAJOR SUPPORT TEST -- METALS & MINERS SPDR FORMS BIG BULLISH CONTINUATION PATTERN
by John Murphy,
Chief Technical Analyst, StockCharts.com
FINANCE SPDR TESTS THE MAY BREAKOUT... Link for today's video. The Finance SPDR (XLF) got slammed last week and broke first support in the 22.50 area. Will it continue lower and drag the market down? Or, will XLF firm and resume the bigger uptrend. Here's...
READ MORE
MEMBERS ONLY
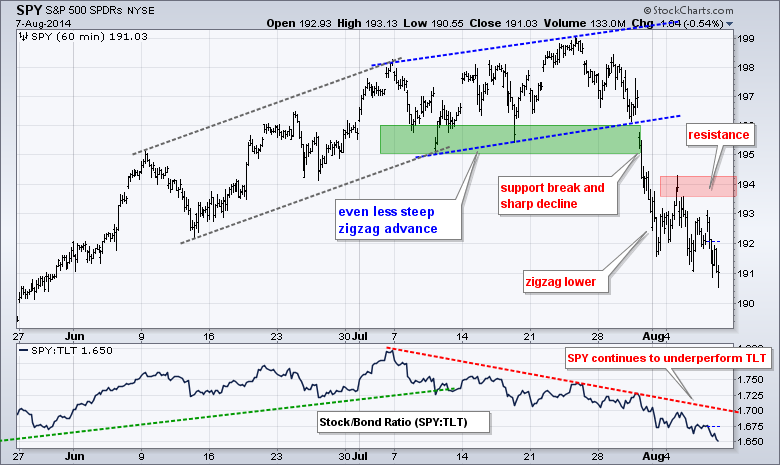
SPY Breaks down to Join IWM in Short-Term Downtrend
by Arthur Hill,
Chief Technical Strategist, TrendInvestorPro.com
Stocks were hit with broad selling pressure last week. Small-caps were weak, but large-caps joined the party last week as both DIA and SPY broke below their July lows. DIA broke below its June lows as well and gave up its June-July gains in a hurry. The Industrials SPDR and...
READ MORE
MEMBERS ONLY

ChartCon 2014 Starts on Friday!
Hello Fellow ChartWatchers!
ChartCon week is finally here! Here's a visual representation of what that means for me currently:
That's a picture of me currently - overworked and overwhelmed and without any of my hair!
I'll be honest - pulling together all of the...
READ MORE
MEMBERS ONLY
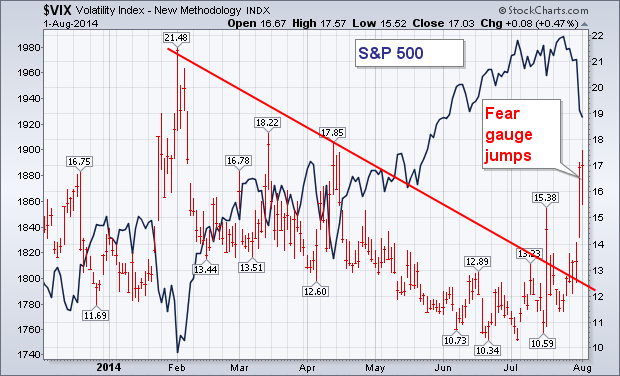
VIX Jumps to Four-Month High
by John Murphy,
Chief Technical Analyst, StockCharts.com
As usually happens when stocks weaken, the CBOE Volatility (VIX) Index jumped sharply this week to the highest level since April. The VIX (also called the "fear gauge") has climbed 47% since the start of July. That means that traders are buying "option" insurance against a...
READ MORE
