MEMBERS ONLY
S&P 500 Breaks Key Trendline as Growth Stocks Plunge

by David Keller,
President and Chief Strategist, Sierra Alpha Research
In this edition of StockCharts TV'sThe Final Bar, Dave previews earnings releases from TSLA and GOOGL, breaks down key levels to watch for SPOT, GE, and more, and analyzes the discrepancy between S&P 500 and Nasdaq breadth indicators.
See Dave's MarketCarpet featuring the Vanilla...
READ MORE
MEMBERS ONLY

1-2-3 Reversal Pattern: What It Is and How to Use It

by Joe Rabil,
President, Rabil Stock Research
In this exclusive StockCharts TV video, Joe explains the 1-2-3 reversal pattern, its criteria, and what it will take for QQQ to complete the pattern. He also discusses how the pattern is not always as clean as we would like. Joe then shares a few Crypto markets which are starting...
READ MORE
MEMBERS ONLY
Small Caps Surge, Markets React to TSLA & GOOGL Earnings
by David Keller,
President and Chief Strategist, Sierra Alpha Research
In this edition of StockCharts TV'sThe Final Bar, Dave previews earnings releases from TSLA and GOOGL, breaks down key levels to watch for SPOT, GE, and more, and analyzes the discrepancy between S&P 500 and Nasdaq breadth indicators.
This video originally premiered on July 23, 2024....
READ MORE
MEMBERS ONLY

CrowdStrike's Epic Fail: Here are the Critical Trading Levels to Watch Now!

by Karl Montevirgen,
The StockCharts Insider
KEY TAKEAWAYS
* Following the CrowdStrike debacle, the stock is as much a technical trade as it is a news-driven trade
* Crowdstrike's stock price has entered a potential buying zone, but potential lawsuits may be a headwind
* Crowdstrike could be a buying opportunity but watch momentum, buying levels, and...
READ MORE
MEMBERS ONLY
Can Small and Mid-Caps Save the Market?

by Julius de Kempenaer,
Senior Technical Analyst, StockCharts.com
In this video from StockCharts TV,Julius takes a look at the markets through the lens of the "market factors" panel you can find on your StockCharts dashboard. Starting from the RRG, he then moves to the individual charts for these factors and notes a low correlation for...
READ MORE
MEMBERS ONLY
Have We Bottomed? Here Are 3 Charts To Watch

by Tom Bowley,
Chief Market Strategist, EarningsBeats.com
Tops and bottoms are so much fun to predict, but key signals are not always accurate. That's where a healthy dose of skepticism comes in. At EarningsBeats.com, we try to put as many signals together as possible, looking for corroboration. That helps to build confidence in the...
READ MORE
MEMBERS ONLY

The Stock Market is Bracing for Earnings IMPACT!
by David Keller,
President and Chief Strategist, Sierra Alpha Research
In this edition of StockCharts TV'sThe Final Bar, Dave breaks down today's upside recovery day for stocks, then shares the charts of TSLA, NVDA, and more. He also illustrates the conflicting messages from AAII and NAAIM sentiment surveys, and also highlights the VIX testing the key...
READ MORE
MEMBERS ONLY
DP Trading Room: Behind the Scenes: CrowdStrike (CRWD)

by Erin Swenlin,
Vice President, DecisionPoint.com
Friday was a bad day for CrowdStrike Holdings (CRWD) as a bug was pushed out that disrupted Windows machines worldwide. The trouble for CRWD is the follow-up lawsuits etc that will likely plague the stock for some time to come. You'll be shocked to see the warning signs...
READ MORE
MEMBERS ONLY
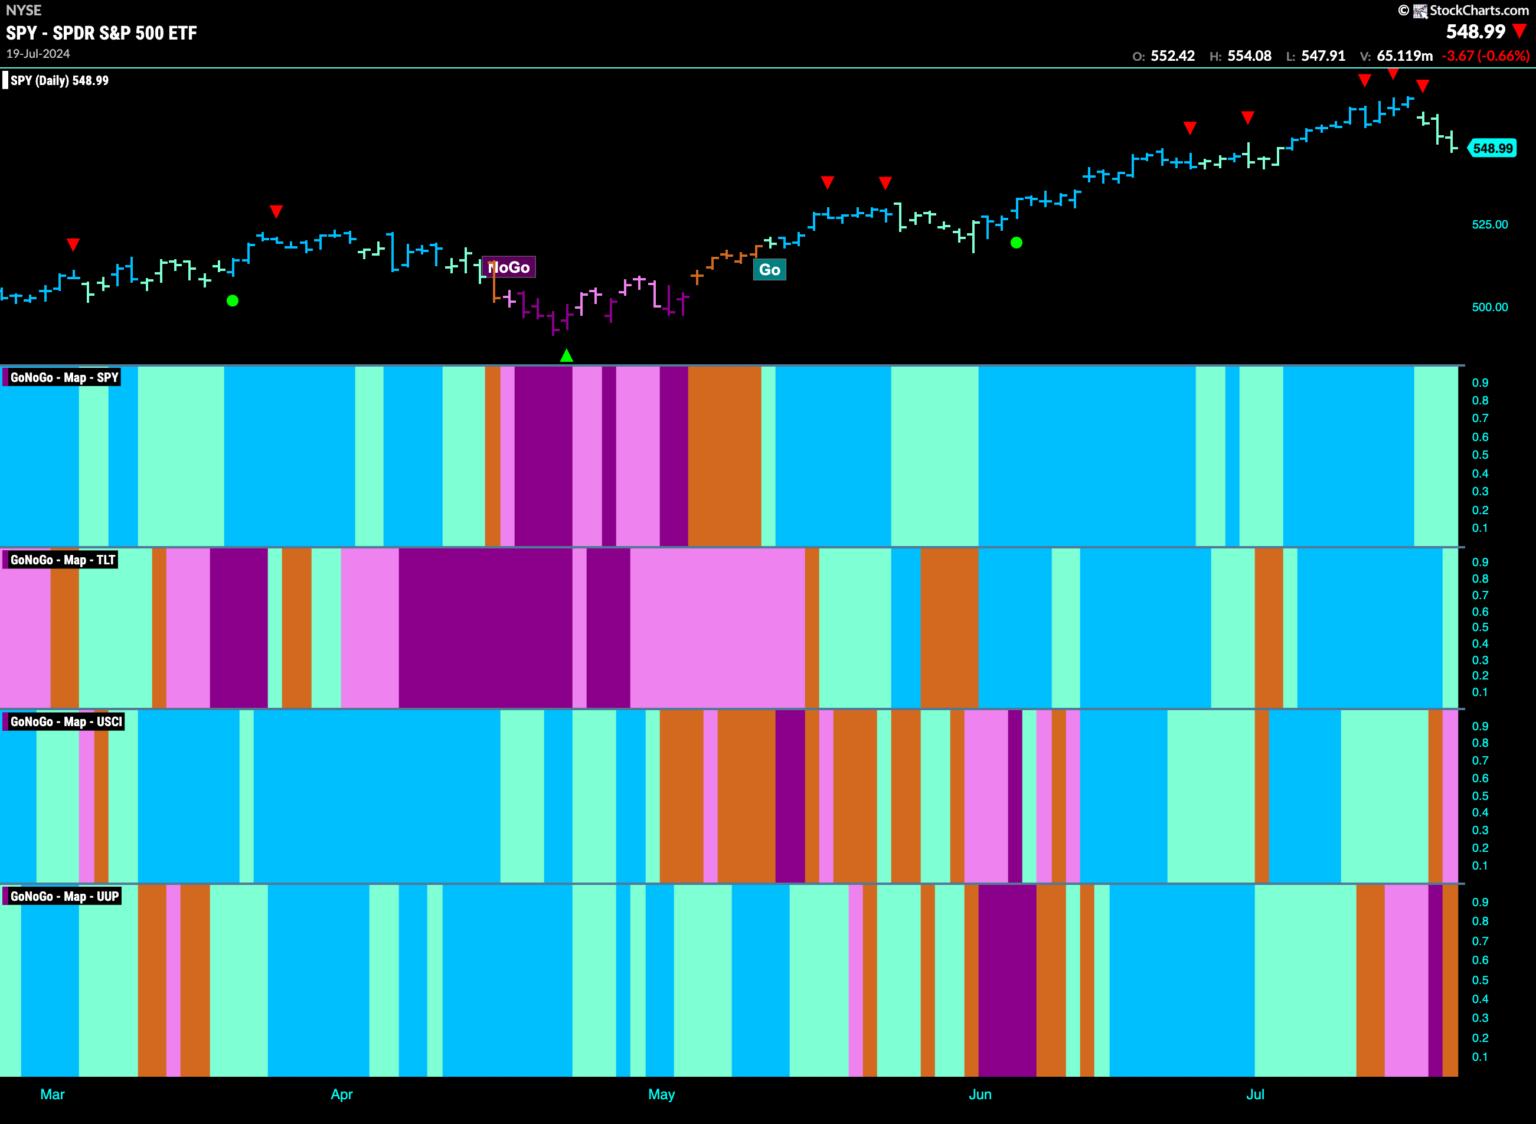
FINANCIALS BEGIN TO OUTPERFORM AS EQUITY "GO" TREND WEAKENS

by Alex Cole,
Co-founder, GoNoGo Charts®

by Tyler Wood,
Co-founder, GoNoGo Charts®
Good morning and welcome to this week's Flight Path. We saw a lot of weakness this week but so far the "Go" trend has held in U.S. equities. GoNoGo Trend has reflected the weakness with a couple of aqua "Go" bars late in...
READ MORE
MEMBERS ONLY

Time for a Pause That Refreshes Stocks and Gold?

by Martin Pring,
President, Pring Research
Most weekends, I run through a chart list featuring weekly bars and candlesticks of bonds, stocks and commodities to see if any one or two bar patterns or candlestick formations have developed. Last week produced a crop of bearish messages from the major averages and some sectors. Before you rush...
READ MORE
MEMBERS ONLY
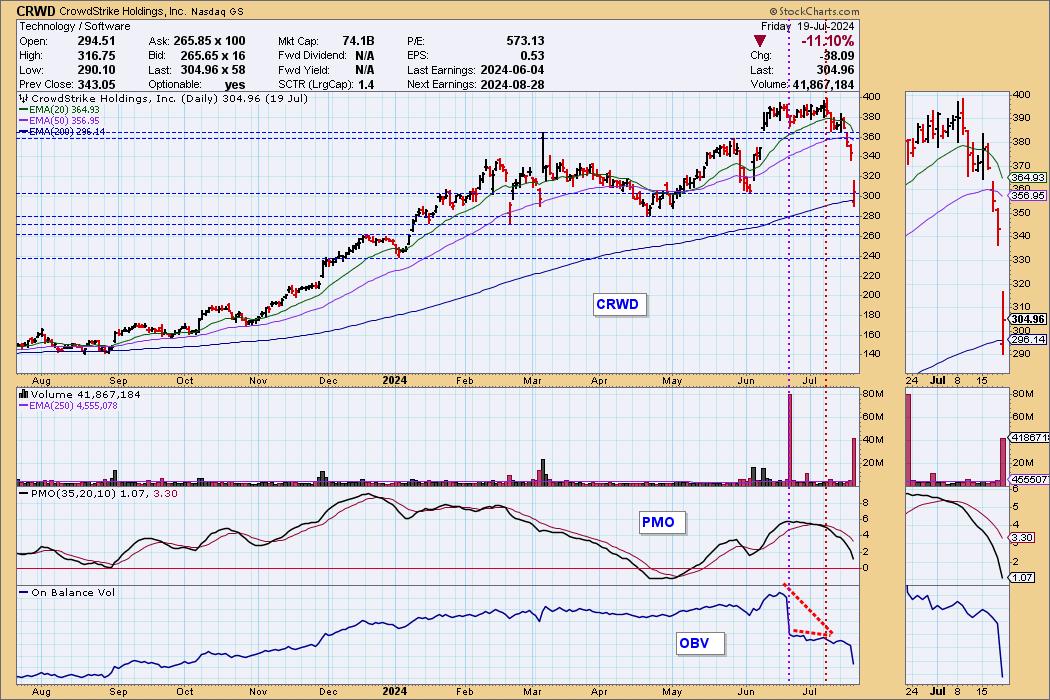
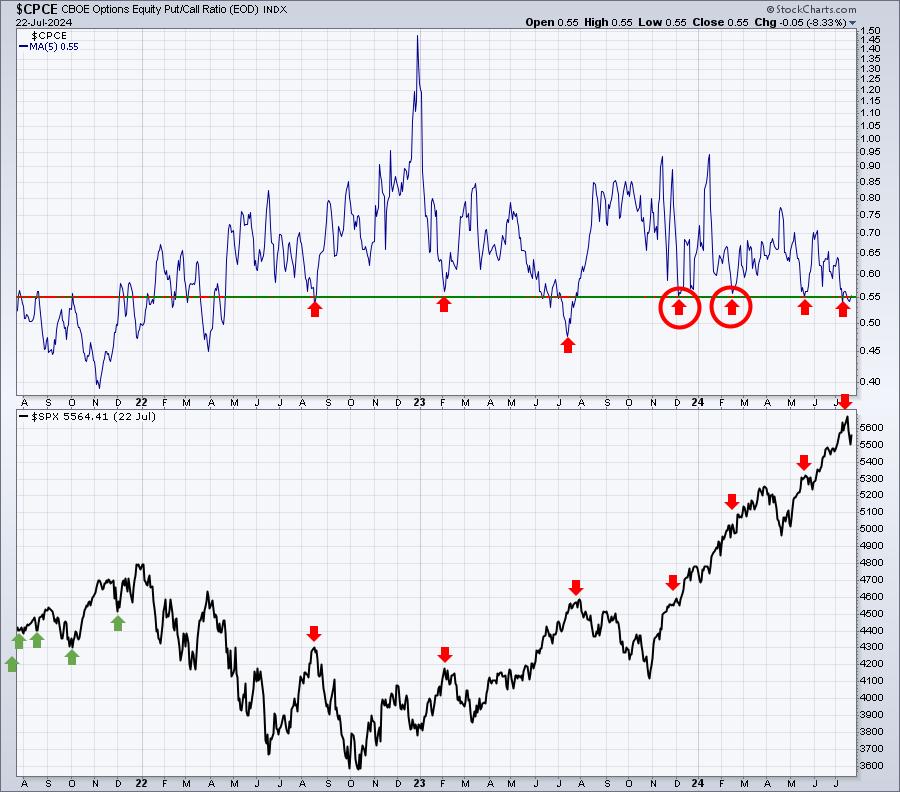
CrowdStrike: Did On-Balance Volume See the "Largest IT Outage In History" Coming?

by Carl Swenlin,
President and Founder, DecisionPoint.com
Friday's CrowdStrike software disaster has been described as "the largest IT outage in history," and it brought home just how vulnerable the planet is to itty-bitty coding errors. We were busy publishing the DecisionPoint ALERT Weekly Wrap, so I didn't have a chance to...
READ MORE
MEMBERS ONLY
Is It Game Over for Growth Stocks?

by Mary Ellen McGonagle,
President, MEM Investment Research
In this StockCharts TV video, Mary Ellen examines which areas of the market have moved into favor amid the S&P 500 pullback. She compares value vs. growth stocks and the merits of both, and highlights the move away from technology stocks. Which areas are poised for more downside?...
READ MORE
MEMBERS ONLY

Important Market Breadth Indicators to Watch: Making Sense of Three Consecutive Down Days

by Jayanthi Gopalakrishnan,
Director of Site Content, StockCharts.com
KEY TAKEAWAYS
* Three consecutive declining days in the stock market increases risk appetite
* Semiconductors were the catalyst for the selloff and trading below two support levels
* Keep an eye on market breadth indicators to get indications of whether the stock market is correcting or if the selloff will be longer-term...
READ MORE
MEMBERS ONLY
Hindenburg Omen: The Truth, Effects, and Duration
by David Keller,
President and Chief Strategist, Sierra Alpha Research
In this edition of StockCharts TV'sThe Final Bar, Dave answers viewer questions on the best time frames for viewing charts, insights on using Vanguard ETFs for sector rotation, the duration and effect of the Hindenburg Omen indicator, how stocks are indexed in Dow Jones Groups on StockCharts, and...
READ MORE
MEMBERS ONLY
What Does a Market Top Look Like?
by David Keller,
President and Chief Strategist, Sierra Alpha Research
The S&P 500 remains in a primary uptrend, as confirmed by a fairly consistent pattern of higher highs and higher lows. But what would confirm that a top is in place for our major equity benchmarks? To answer that, it may be helpful to review other charts that...
READ MORE
MEMBERS ONLY
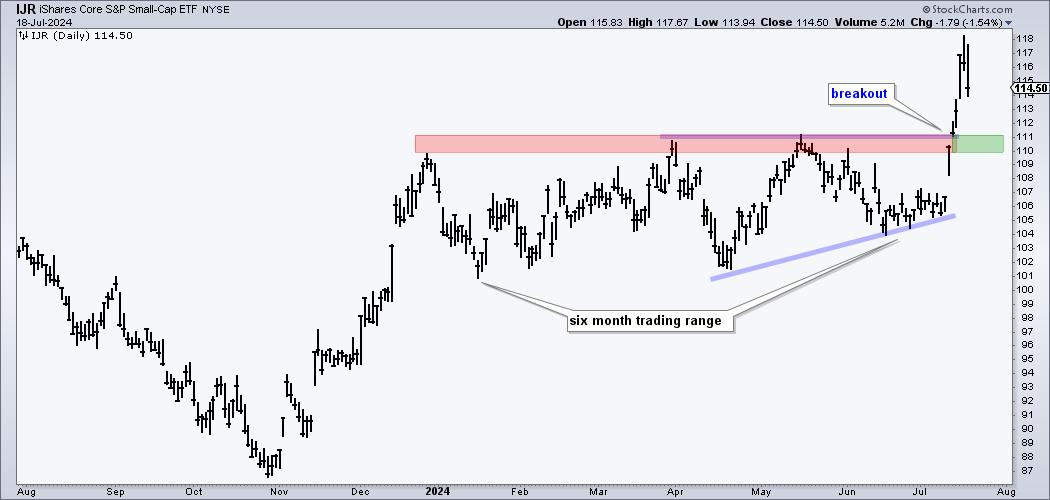
Small-caps Break Out and Lead - Now What?

by Arthur Hill,
Chief Technical Strategist, TrendInvestorPro.com
KEY TAKEAWAYS
* IJR broke out and a strong breakout should hold.
* Broken resistance turns first support.
* Small-caps are prone to extended trading ranges.
Small-caps took the lead over the last two weeks with the S&P SmallCap 600 SPDR (IJR) surging over 10% in five days and hitting a...
READ MORE
MEMBERS ONLY
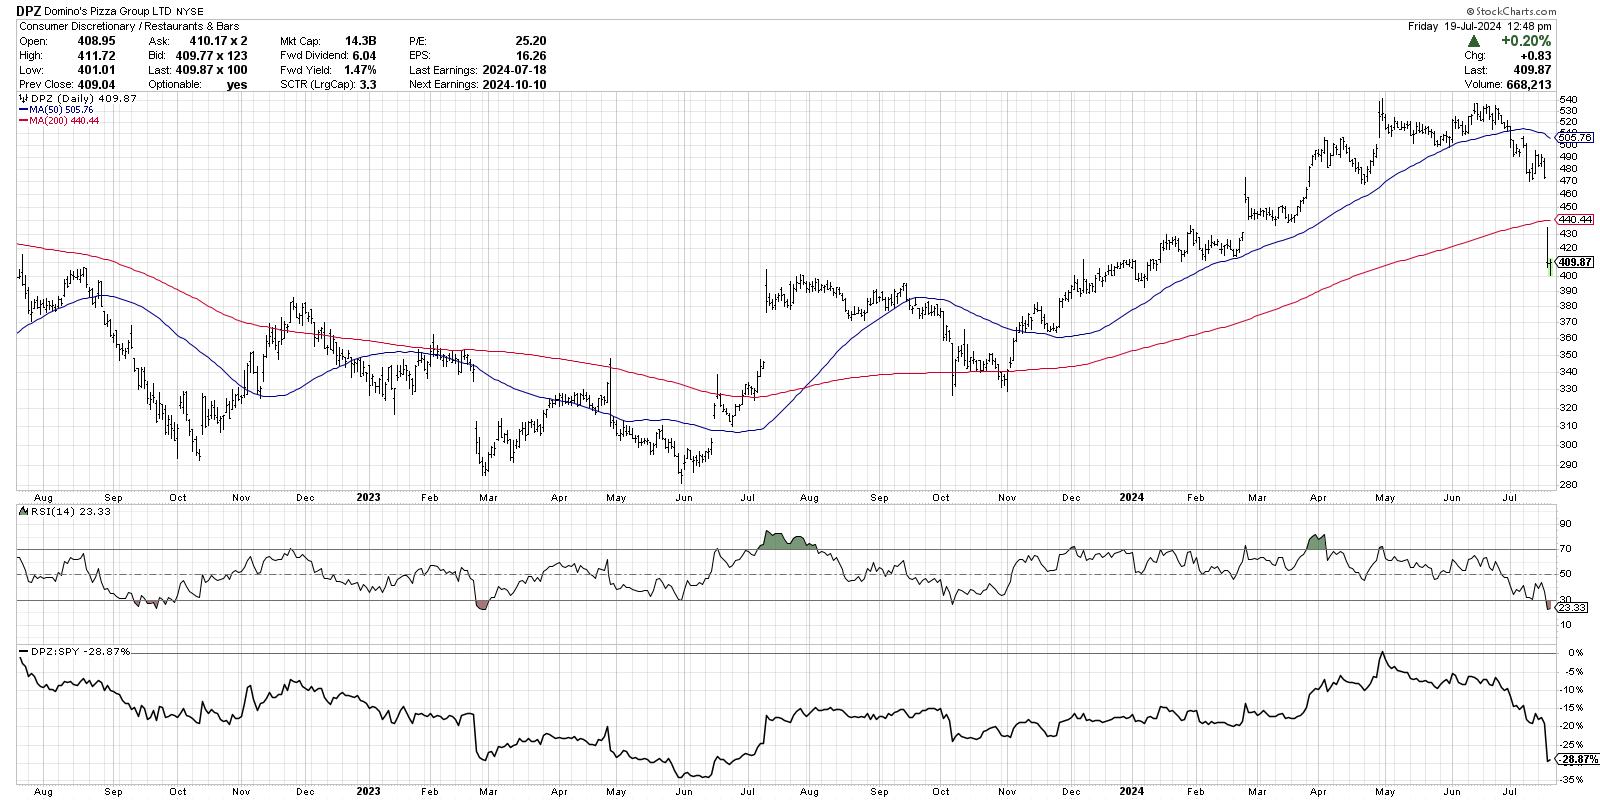
VIX SPIKES! Is a Market Correction Coming?
by David Keller,
President and Chief Strategist, Sierra Alpha Research
In this edition of StockCharts TV'sThe Final Bar, Dave shares a market update including key levels to watch for the S&P 500 index, what a VIX above 15 means for a possible market correction, the improvement in value-oriented sectors, and why DPZ may be the world&...
READ MORE
MEMBERS ONLY
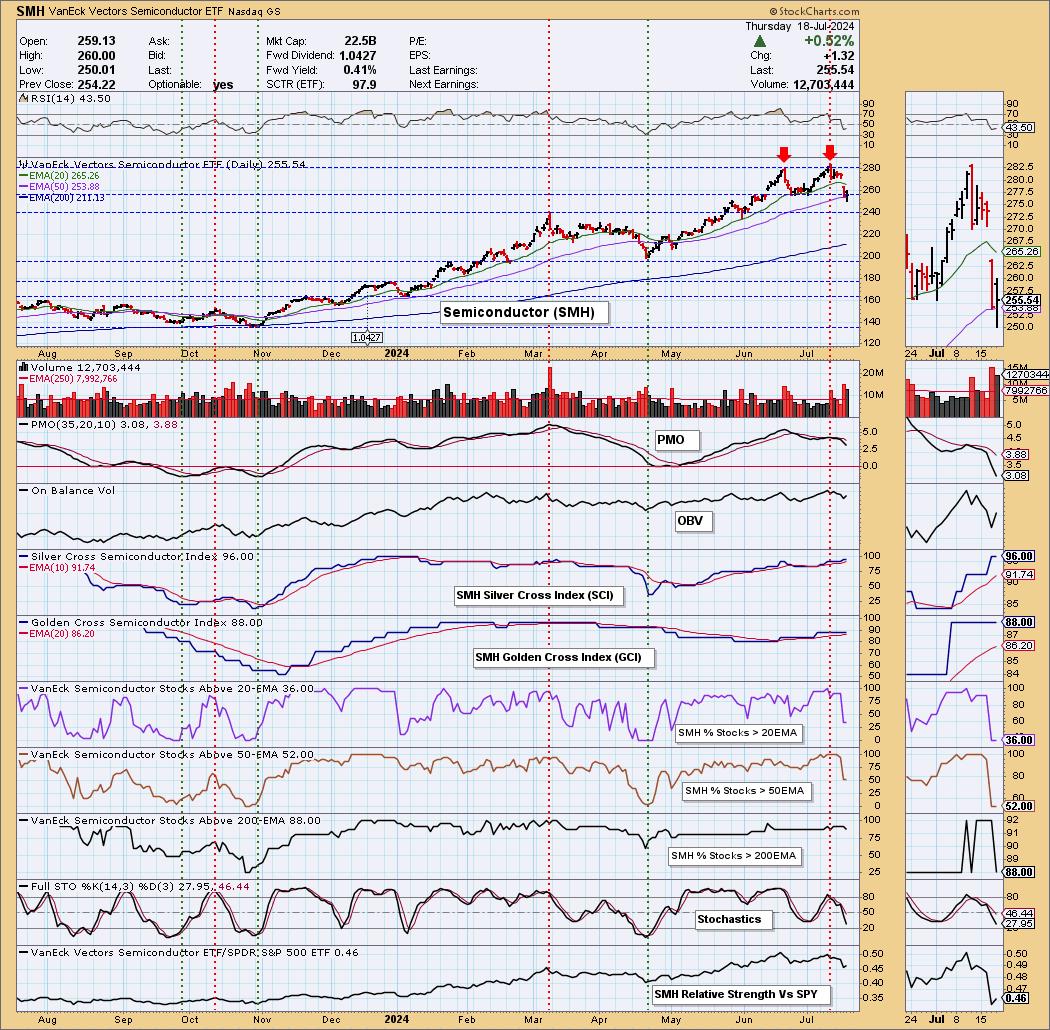
Double Top on Semiconductors (SMH)
by Erin Swenlin,
Vice President, DecisionPoint.com
(This is an excerpt from the subscriber-only DecisionPoint Alert)
We noticed a double top on the Semiconductor industry group (SMH) that looks very much like the NVIDIA (NVDA) chart. NVDA is clearly the bellwether for the group, and it appears all of the Semiconductors are feeling the pain. The downside...
READ MORE
MEMBERS ONLY

Will This Sector Rotation Be the Start of Something Bigger?
by Julius de Kempenaer,
Senior Technical Analyst, StockCharts.com
KEY TAKEAWAYS
* Technology is rotating out of favor
* Market Capitalization is a two-edged sword
* Negative divergences on Technology and S&P 500 charts are executing
Strong Rotations on Daily RRG
This daily RRG shows the sector rotation over the last five days. With only one more trading day to...
READ MORE
MEMBERS ONLY

Why Homebuilder Stocks are on Fire Right Now!
by Karl Montevirgen,
The StockCharts Insider
KEY TAKEAWAYS
* Homebuilder stocks are rallying on hopes of at least one (if not three) interest rate cuts in 2024
* The SPDR S&P Homebuilders ETF broke out above a short-term downward trend
* Though much depends on the interest rate environment, the charts of individual homebuilder stocks show support...
READ MORE
MEMBERS ONLY

Election Year Patterns | Larry's "Family Gathering" July 18, 2024 Recording

by Larry Williams,
Veteran Investor and Author
What stocks right now does Larry have his eye on? Which ones is he saying "see you later... for now"? And which ones does he not like very much at all?
In this month's Family Gathering video, Larry presents an in-depth discussion on the patterns we...
READ MORE
MEMBERS ONLY

"Family Gathering" Meeting Today at 2 PM Eastern
Today, Larry Williams will be hosting a "Family Gathering" meeting at 2pm Eastern Daylight Time (11am Pacific). Sign-in in begins 5 minutes prior. The show, which will include both a presentation from Larry and a viewer Q&A session, will be recorded and posted online for those...
READ MORE
MEMBERS ONLY

Find Trades Using These POWERFUL MACD Combinations
by Joe Rabil,
President, Rabil Stock Research
In this exclusive StockCharts TV video, Joe shows how to use 2-3 specific MACD patterns on the monthly and weekly charts to set the stage for potential trading ideas. Joe then goes through the shifts in the Sector action and shows where the money is flowing. He covers the stock...
READ MORE
MEMBERS ONLY
Dow Theory Bull Confirmed! What Happens Next?
by David Keller,
President and Chief Strategist, Sierra Alpha Research
In this edition of StockCharts TV'sThe Final Bar, Dave comments on the Newer Dow Theory signal, improving market breadth conditions, impact of lower interest rates, and key levels to watch for GLD, UNH, CAT, and BAC. He also breaks down today's rally driven by small caps...
READ MORE
MEMBERS ONLY

Seasonal Sector Investing in the Fall: Top Sectors to Watch Now!
by Karl Montevirgen,
The StockCharts Insider
KEY TAKEAWAYS
* One sector ETF is slightly outperforming the S&P 500 while the rest are underperforming the index.
* The performances of the four outperforming sector ETFs from September to December vary.
* Check the price action and fundamentals to see if both might agree with each sector's...
READ MORE
MEMBERS ONLY

Why Stocks are STILL the BEST Investment
by Julius de Kempenaer,
Senior Technical Analyst, StockCharts.com
In this video from StockCharts TV,Julius looks at the markets from an asset allocation perspective using various RRGs. Stocks are (still) beating bonds, while commodities are rotating out of favor and the USD is losing steam. BTC is jumping higher off support, and the Yield Curve is steepening against...
READ MORE
MEMBERS ONLY
Small Caps & Value Sectors are Booming (For Now)
by David Keller,
President and Chief Strategist, Sierra Alpha Research
In this edition of StockCharts TV'sThe Final Bar, Dave recaps a strong Monday for value stocks, with the Financial and Energy sectors leading the S&P 500 and Nasdaq to new highs. He shares an update on the Hindenburg Omen, how Bitcoin has regained its 200-day moving...
READ MORE
MEMBERS ONLY

Carvana Stock Is Picking Up Speed. Is Now the Time To Buy?
by Jayanthi Gopalakrishnan,
Director of Site Content, StockCharts.com
KEY TAKEAWAYS
* Carvana stock hit a new 52-week high and has potential to move higher
* The weekly chart of Carvana's stock price shows the trend is up and has more upside potential
* Carvana's stock chart shows the relative strength index is just approaching overbought territory, indicating...
READ MORE
MEMBERS ONLY

These Two Sectors are Showing Promising Silver Cross Setups
by Martin Pring,
President, Pring Research
A silver cross occurs when a 20-day MA crosses above its 50-day counterpart. While far from perfect, such signals enable you to ride a persistent trend. However, like all trend following techniques, problems can occur in a trading range environment.
Chart 1 features two recent buy signals for the S&...
READ MORE
MEMBERS ONLY

Larry's LIVE "Family Gathering" Webinar Airs THIS WEEK - Thursday, July 18 at 2 PM EDT!
Larry is going LIVE! Don't miss the upcoming "Family Gathering" webinar with Larry Williams, airing live through Zoom on Thursday, July 18 at 2:00pm Eastern Daylight Time.
In this must-see event, Larry will be presenting his current opinions on a broad variety of current market...
READ MORE
MEMBERS ONLY
DP Trading Room: PMO Sort on Earnings Darlings
by Erin Swenlin,
Vice President, DecisionPoint.com
Earnings are coming into focus and today Erin looks at the big earnings stocks to find out which look the best going into earnings. She took the list of stocks and sorted them by the Price Momentum Oscillator (PMO) which put the strongest stocks at the top of the list....
READ MORE
MEMBERS ONLY

TIME TO USE YOUR DISCRETION AS SECTOR HELPS PROP UP EQUITIES?
by Alex Cole,
Co-founder, GoNoGo Charts®
by Tyler Wood,
Co-founder, GoNoGo Charts®
Good morning and welcome to this week's Flight Path. It was another strong week for U.S. equities as we saw S&P hit new highs on a week of strong blue "Go" bars. Treasury bond prices had a good weeks as well with a...
READ MORE
MEMBERS ONLY
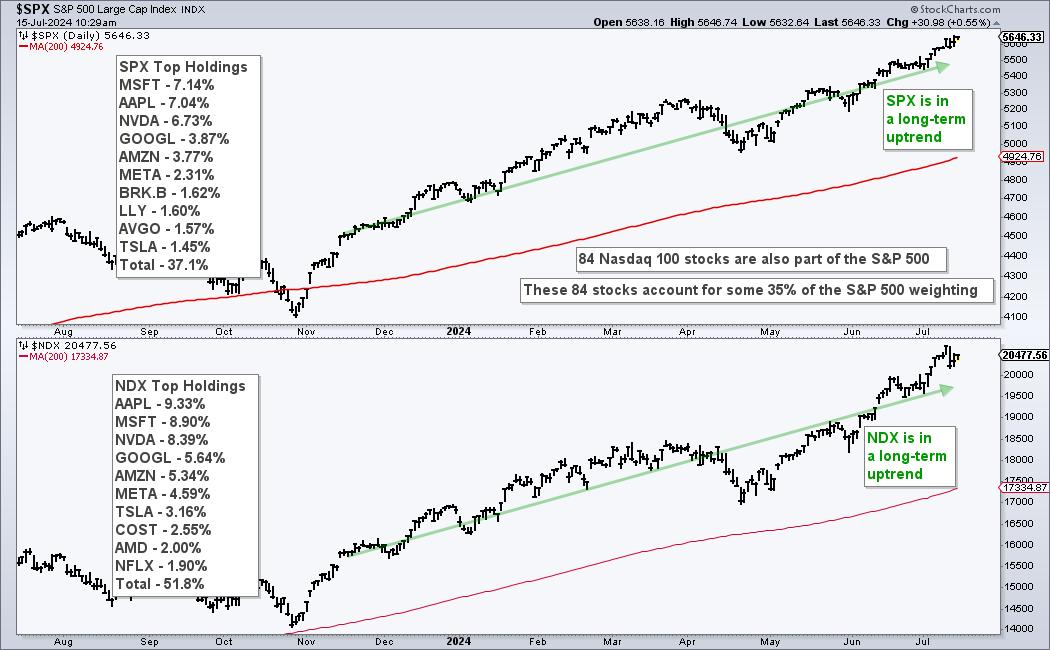
Using Nasdaq 100 Specific Breadth to Measure Risk Appetite
by Arthur Hill,
Chief Technical Strategist, TrendInvestorPro.com
KEY TAKEAWAYS
* Nasdaq 100 stocks account for over 30% of the S&P 500.
* Nasdaq 100 stocks represent the risk appetite in the stock market.
* Chartists can quantify the risk appetite using Nasdaq 100 specific breadth indicators.
The Nasdaq 100 is a major driver in the stock market and...
READ MORE
MEMBERS ONLY
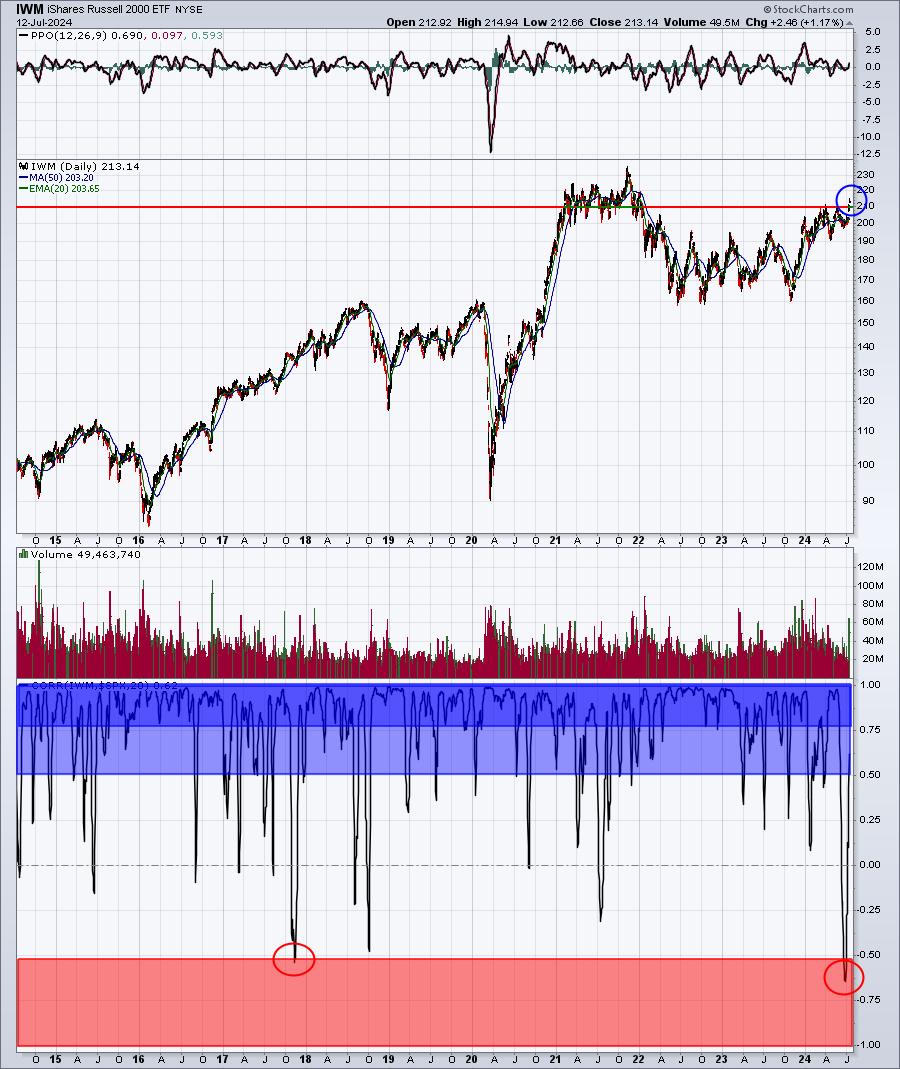
It's Time To Consider These Areas As Emerging Leaders
by Tom Bowley,
Chief Market Strategist, EarningsBeats.com
There was no doubt that new leadership emerged last week. Here were 3 areas that surged higher, either moving to fresh 52-week highs or breaking significant downtrends:
Small Caps
The small cap Russell 2000 (IWM) has been trying to clear the 210-211 area for the past two years. After doing...
READ MORE
MEMBERS ONLY

S&P 500 Sets New Record Highs Because of Value, Not Growth
by Tom Bowley,
Chief Market Strategist, EarningsBeats.com
It was a very interesting week indeed. All-time high records continued to fall on a daily basis, but the complexion of the market most definitely changed during the latter part of the week. First, I want to pull up an hourly RRG chart to track 10 key growth stocks, most...
READ MORE
MEMBERS ONLY
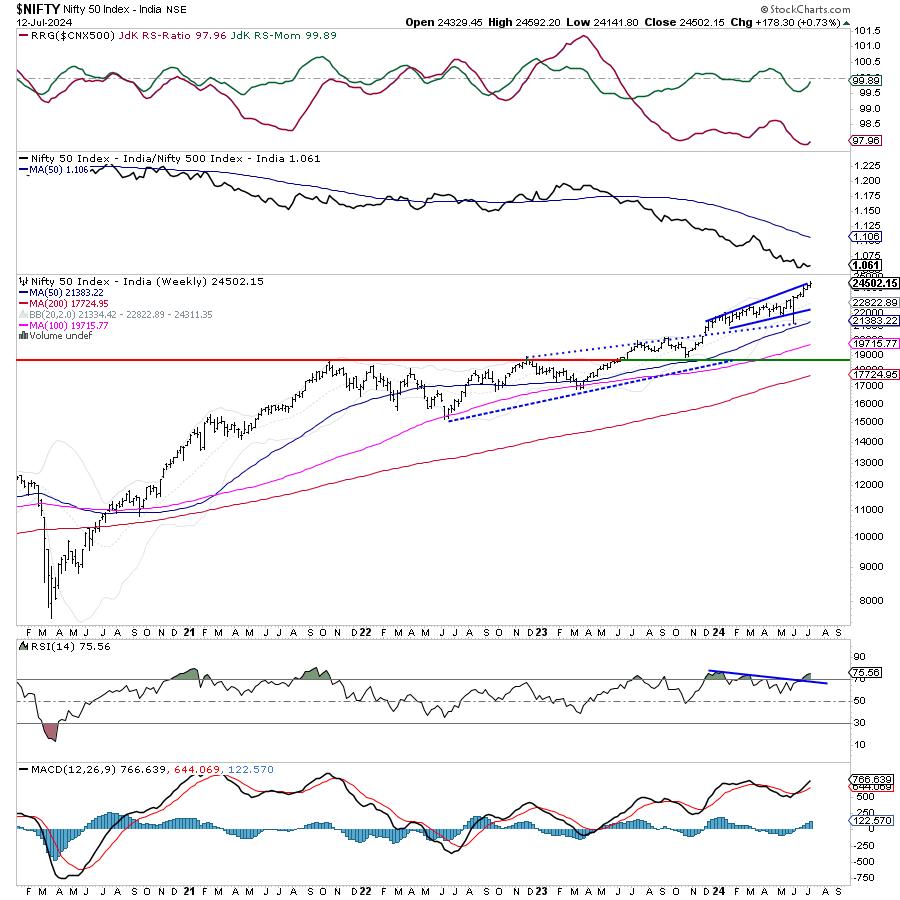
Week Ahead: NIFTY Remains Significantly Deviated From Mean; Stay Vigilant at Higher Levels

by Milan Vaishnav,
Founder and Technical Analyst, EquityResearch.asia and ChartWizard.ae
It was the sixth week in a row that saw the Nifty 50 index ending with gains. Over the past few days, the markets largely experienced trending days as they continued inching higher despite the intraday moves staying ranged. The Nifty also continued forming its new lifetime highs; the current...
READ MORE
MEMBERS ONLY
Is It Time To SELL Your Magnificent 7 Stocks?
by Mary Ellen McGonagle,
President, MEM Investment Research
In this StockCharts TV video, Mary Ellen reviews the sharp rotation that took place in the markets after inflation data came in below estimates. She also highlights new areas of possible leadership as interest rates decline. Most importantly, she shares the best way to uncover leadership names that are in...
READ MORE
MEMBERS ONLY

Stock Market Makes Spectacular Run, and It's Not From the Popular Magnificent Seven
by Jayanthi Gopalakrishnan,
Director of Site Content, StockCharts.com
KEY TAKEAWAYS
* Stock market sees rally in areas aside from the Magnificent Seven stocks
* Small-cap stocks had an impressive performance in the last two trading days of the week
* The stock market continues to show its bullish strength as we enter earnings season
What a strange trip it's...
READ MORE
MEMBERS ONLY

Citi Predicts $3,000 Gold by 2025 — What You Need to Know
by Karl Montevirgen,
The StockCharts Insider
KEY TAKEAWAYS
* What the Fed does in the coming months could dramatically affect the direction of gold prices
* While seasonality suggests a shift from slump to strong performance for gold, it will likely coincide with the Fed's rate decisions in the coming months
* Goldman Sachs projects gold to...
READ MORE
MEMBERS ONLY

NVDA & Mag 7 Breaking Down; Russell 2000 (IWM) and Retail (XRT) Get "Silver Cross" BUY Signals
by Carl Swenlin,
President and Founder, DecisionPoint.com
by Erin Swenlin,
Vice President, DecisionPoint.com
KEY TAKEAWAYS
* NVIDIA (NVDA) breaks down with Magnificent Seven
* Russell 2000 (IWM) gets IT Trend Model "Silver Cross" BUY Signal
This is a complimentary excerpt from the subscriber-only DecisionPoint Alert.
NVIDIA (NVDA) broke down today in what looks like an echo of last month's pullback. There...
READ MORE