MEMBERS ONLY

How To Manage Risk Using Technical Analysis!

by David Keller,
President and Chief Strategist, Sierra Alpha Research
In this edition of StockCharts TV'sThe Final Bar, Dave completes a three-part series based on the successful "Top Ten Charts" episodes ofThe Final Bar. Today, he wraps the series with talks about risk management and how to use technical analysis tools to better manage risk vs....
READ MORE
MEMBERS ONLY

Golf Geometry & Kinematics

by Greg Morris,
Veteran Technical Analyst, Investor, and Author
Here are some observations from golf that you might want to take into consideration.
1. I cannot begin to count the number of times while playing golf that someone thinks they are "away" when the distance between their ball and the cup versus the other person's...
READ MORE
MEMBERS ONLY

Simple RSI Trend Strategy: Entry BEFORE a Breakout!

by Joe Rabil,
President, Rabil Stock Research
In this exclusive StockCharts TV video, Joe shows an RSI strategy that offered a few opportunities to get into AAPL before the big breakout. He then highlights what to watch for in TSLA, which may provide the same type of RSI setup sometime over the next week or so; this...
READ MORE
MEMBERS ONLY

When Will the Stock Market's Bullish Momentum Snap? Charts You Need to Watch

by Jayanthi Gopalakrishnan,
Director of Site Content, StockCharts.com
KEY TAKEAWAYS
* The stock market could continue its bullish run on interest rate cut speculation
* The S&P 500 Equal-Weighted Index is a good indication of the health of the overall stock market
* Bond market action is often a leading indicator of stock market action
With the S&...
READ MORE
MEMBERS ONLY

They Say Three Steps and Stumble; This Market is Taking a Fourth

by Martin Pring,
President, Pring Research
The legendary technician Edson Gould had a rule that, after three discount rate hikes, the stock market would be likely to stumble. That doesn't apply to emerging markets, but it did make a catchy headline. What is relevant to the iShares MSCI Emerging Market ETF (EEM) is that,...
READ MORE
MEMBERS ONLY

The BEST Way to Track Stock and ETF Performance
by David Keller,
President and Chief Strategist, Sierra Alpha Research
In this edition of StockCharts TV'sThe Final Bar, available to watch below, Dave continues a three-part series on selecting top charts to follow every month. In this second episode, Dave reviews charts he and Grayson Roze selected in May and June, reflecting on what has happened, what has...
READ MORE
MEMBERS ONLY

Silver's AI Boom: The Next Big Trade You Need to Know About

by Karl Montevirgen,
The StockCharts Insider
KEY TAKEAWAYS
* Silver may be the next big "AI trade"
* While silver ETFs are seeing large outflows, silver futures are telling a different story
* Understanding silver's seasonal pattern and identifying the key levels to watch are critical
Over the last few years, the "AI trade&...
READ MORE
MEMBERS ONLY
Identifying Top Charts with Upside Potential in 2024
by David Keller,
President and Chief Strategist, Sierra Alpha Research
In this edition of StockCharts TV'sThe Final Bar, available to watch below, Dave begins a three-part series on selecting top charts to follow every month. In this first episode, he shares how he and Grayson Roze select the charts to include in the Top 10 lists using the...
READ MORE
MEMBERS ONLY
Market Foundation Showing CRACKS!

by Julius de Kempenaer,
Senior Technical Analyst, StockCharts.com
In this video from StockCharts TV,Julius continues to look at the narrowing market breadth and puts things into (another) perspective. The conclusion remains the same: it's a Risk-ON market, but the Risk is BIG.
This video was originally broadcast on July 9, 2024. Click anywhere on the...
READ MORE
MEMBERS ONLY
Equities Set New Highs As Growth Sectors Drive Markets

by Tyler Wood,
Co-founder, GoNoGo Charts®
Good morning and welcome to this week's Flight Path. The week ended with all of the major asset classes painting "Go" bars. However, we saw a little uncertainty in places during trading. After a few bars of weaker aqua "Go" bars, we saw equities...
READ MORE
MEMBERS ONLY

DP Trading Room: These Banks are Bullish Going Into Earnings

by Erin Swenlin,
Vice President, DecisionPoint.com
Earnings season is kicking off and Carl and Erin spotlight the banks that will be reporting on Friday. The setups aren't good for all of these banks, but some are set up nicely going into their earnings calls. Earnings are always tricky as good earnings can still result...
READ MORE
MEMBERS ONLY

Pre-Earnings Moves Are Underway And History Provides Us GREAT Clues To Find Them!

by Tom Bowley,
Chief Market Strategist, EarningsBeats.com
We're approaching Q2 earnings season, so I'm getting ready for all the short-term trading opportunities that await. But, in the meantime, there are plenty of other earnings opportunities right now - pre-earnings advances. Several of the large cap names (think Mag 7) are already starting powerful...
READ MORE
MEMBERS ONLY

Week Ahead: NIFTY Hovers Around Crucial Points; Keep Guarding Profits at Higher Levels

by Milan Vaishnav,
Founder and Technical Analyst, EquityResearch.asia and ChartWizard.ae
The markets continued with their unabated up move in the week that went by and ended once again with net gains. While continuing with the advance, the Nifty 50 Index extended its move higher. However, as compared to the previous week, this time, the trading range got narrower as the...
READ MORE
MEMBERS ONLY

The Economy is Slowing - Are You in the Right Stocks?

by Mary Ellen McGonagle,
President, MEM Investment Research
In this StockCharts TV video, Mary Ellen reviews where things stand after the markets close at another new high. She also shares what drove price action this week and how that may change the markets going forward. Finally, she highlights precise sell strategies in a shifting market.
This video originally...
READ MORE
MEMBERS ONLY
The Chart to Help Navigate a Summer Market Top
by David Keller,
President and Chief Strategist, Sierra Alpha Research
KEY TAKEAWAYS
* Value sectors have been consistently underperforming the benchmarks since the April market low
* Technology has outperformed the S&P 500 as well as other growth sectors in 2024
* Defensive sectors like Utilities and Consumer Staples may be the most important to watch, as they can demonstrate investor...
READ MORE
MEMBERS ONLY
An Awesome Breakthrough in S&P 500 and Nasdaq: Will the Momentum Continue?
by Jayanthi Gopalakrishnan,
Director of Site Content, StockCharts.com
KEY TAKEAWAYS
* S&P 500 and Nasdaq Composite close at record highs
* Equities, precious metals, and bonds all rise, but Bitcoin shows weakness
* Keep an eye on the Equal Weighted S&P 500 and Nasdaq breadth to get early insight into stock market direction.
If you were taking...
READ MORE
MEMBERS ONLY

Tesla Stock's Shocking Comeback: What You Need to Know Before July 23
by Karl Montevirgen,
The StockCharts Insider
KEY TAKEAWAYS
* TSLA's stock price surged 32% above its zone of congestion following its April 23 earnings report
* News of Tesla's dwindling inventories, plus expectations of a Fed rate cut before the end of the year (among other things), are fueling the stock's advance...
READ MORE
MEMBERS ONLY

Unmasking Market Moves: Why Focusing on Individual Stocks Beats Indexes in 2024
by Julius de Kempenaer,
Senior Technical Analyst, StockCharts.com
KEY TAKEAWAYS
* Today, we're looking at market breadth from a different perspective
* In this article, we'll plot major US stockmarket indices on a Relative Rotation Graph
* Even inside the NYFANG index, the base is narrow
There's been much chatter and mentions of weak or...
READ MORE
MEMBERS ONLY

One Rule to Drastically Improve Your Trading
by Joe Rabil,
President, Rabil Stock Research
On this week's edition of Stock Talk with Joe Rabil, Joe uses a chart of AAPL to demonstrate how properly using a MACD and ADX indicator combo increases your chances of success. He analyzes 10-Year Yields, Bitcoin, Tesla, Datadog, and ServiceNow. Going through all the sectors, Joe explains...
READ MORE
MEMBERS ONLY
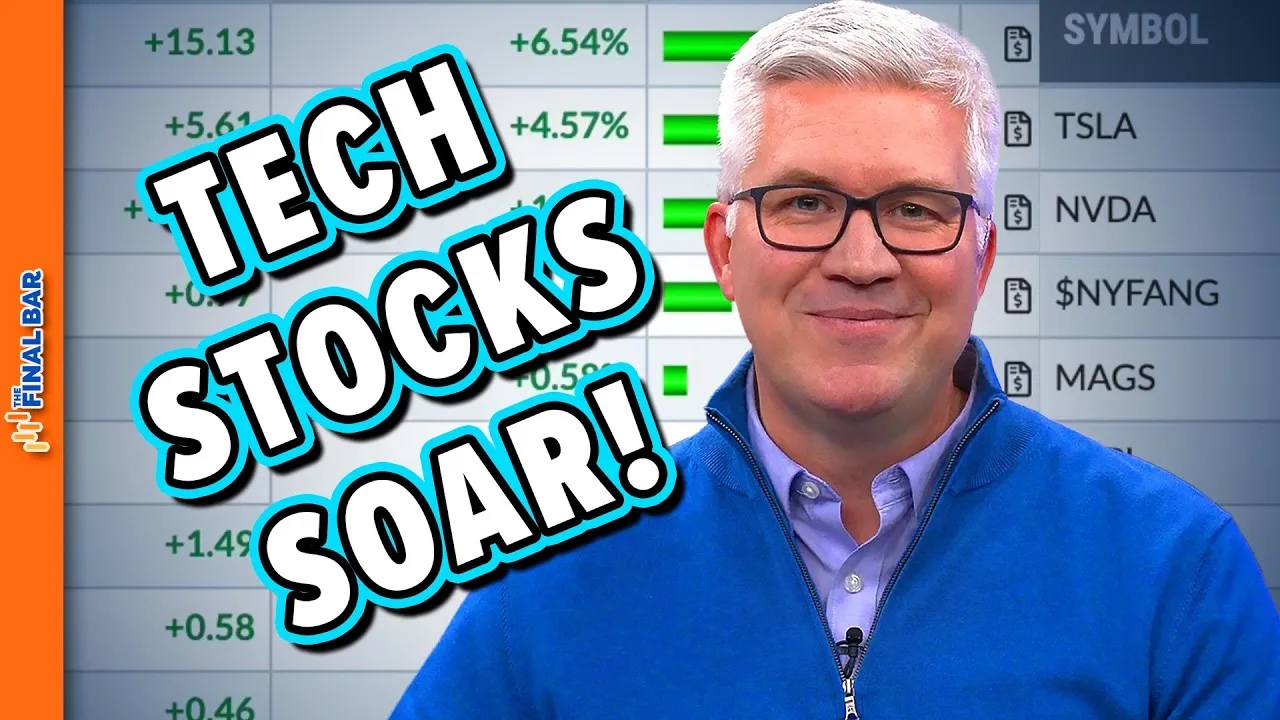
Technology Shares SOAR to New All-Time Highs
by David Keller,
President and Chief Strategist, Sierra Alpha Research
In this edition of StockCharts TV'sThe Final Bar, available to watch below, Dave recaps a shortened trading session marked by strength in the technology sector, potential breakouts in gold stocks, and key levels to watch as the S&P 500 index makes a new closing high on...
READ MORE
MEMBERS ONLY

Has Housing Topped Out for the Cycle?
by Martin Pring,
President, Pring Research
Residential housing is not important for its size relative to GDP, which, according to Copilot, is about 3-5%. Rather, due to its interest rate sensitivity, housing is significant because it is the first sector of the economy to turn at the end of a recession, and the first to turn...
READ MORE
MEMBERS ONLY

Should You Be Worried About Poor Market Breadth?
by David Keller,
President and Chief Strategist, Sierra Alpha Research
In this edition of StockCharts TV'sThe Final Bar, available to watch below, Dave celebrates the S&P 500 closing above 5500, laments the lack of market breadth, and provides updates on the infamous Hindenburg Omen. He also breaks down key levels to watch on charts of V,...
READ MORE
MEMBERS ONLY

Could AMZN's Stock Hit $3 Trillion Valuation? What You Need To Know
by Karl Montevirgen,
The StockCharts Insider
KEY TAKEAWAYS
* AMZN's stock price entered new all-time high territory, closing at $200.02; it could rise higher
* If AMZN's stock price dips, watch for key levels to enter a long position
* Amazons' next earnings report is expected to drop on August 1, 2024, which...
READ MORE
MEMBERS ONLY

Market Breadth is Narrowing - Should You Be Worried?
by Julius de Kempenaer,
Senior Technical Analyst, StockCharts.com
In this video from StockCharts TV,Julius assesses the long-term trends as they are playing out on the monthly S&P 500 sector charts. He takes a look into the future using the expected seasonal trends for the month of July. Markets are still going higher, but the path...
READ MORE
MEMBERS ONLY

S&P 500 Earnings Results Are In for 2024 Q1 and Market Is Still Overvalued

by Carl Swenlin,
President and Founder, DecisionPoint.com
S&P 500 earnings are in for 2024 Q1, and here is our valuation analysis.
The following chart shows the normal value range of the S&P 500 Index, indicating where the S&P 500 would have to be in order to have an overvalued P/E...
READ MORE
MEMBERS ONLY

AAPL and TSLA Kick Off Q2 With BREAKOUTS!
by David Keller,
President and Chief Strategist, Sierra Alpha Research
In this edition of StockCharts TV'sThe Final Bar, available to watch below, Dave lays out the strong seasonal pattern for the S&P 500 in July, highlights the breakouts in AAPL and TSLA, shares the painful breakdowns in MGM, WM and CCL, and addresses the sudden rise...
READ MORE
MEMBERS ONLY

DP Trading Room: Deflation...a Possibility?
by Erin Swenlin,
Vice President, DecisionPoint.com
Today's DP Trading Room was jam packed! The lead story is definitely the fact that deflation is another possibility that many are not talking about. We don't know if it will be the final outcome, but we have a link that discusses this possibility: https://hoisington....
READ MORE
MEMBERS ONLY

What to Expect This Month | Focus on Stocks: July 2024

by Larry Williams,
Veteran Investor and Author
Historically, July has seen stock prices move higher almost 80% of the time, cementing this in our trader's notebook as a time to stay home and trade. Others can vacation this month!
Chart 1 is my true seasonal pattern for the Dow for the last 124 years. It...
READ MORE
MEMBERS ONLY

COMMUNICATIONS SECTOR JOINS TECHNOLOGY SECTOR TO HELP BUOY EQUITY MARKETS

by Alex Cole,
Co-founder, GoNoGo Charts®
by Tyler Wood,
Co-founder, GoNoGo Charts®
Good morning and welcome to this week's Flight Path. "Go" bars were the order of the week again for U.S. equities and the end of the week saw a return to strong blue bars. Treasury bond prices also were able to maintain "Go"...
READ MORE
MEMBERS ONLY

Here's Why You Should Be Buying Software NOW
by Tom Bowley,
Chief Market Strategist, EarningsBeats.com
The recovery in semiconductor shares ($DJUSSC) last week, in my opinion, was quite weak. Much of the strength occurred by 10am ET, and the balance of the days really didn't see much progress back to the upside. Accordingly, I'd call the rebound more market maker manipulation...
READ MORE
MEMBERS ONLY
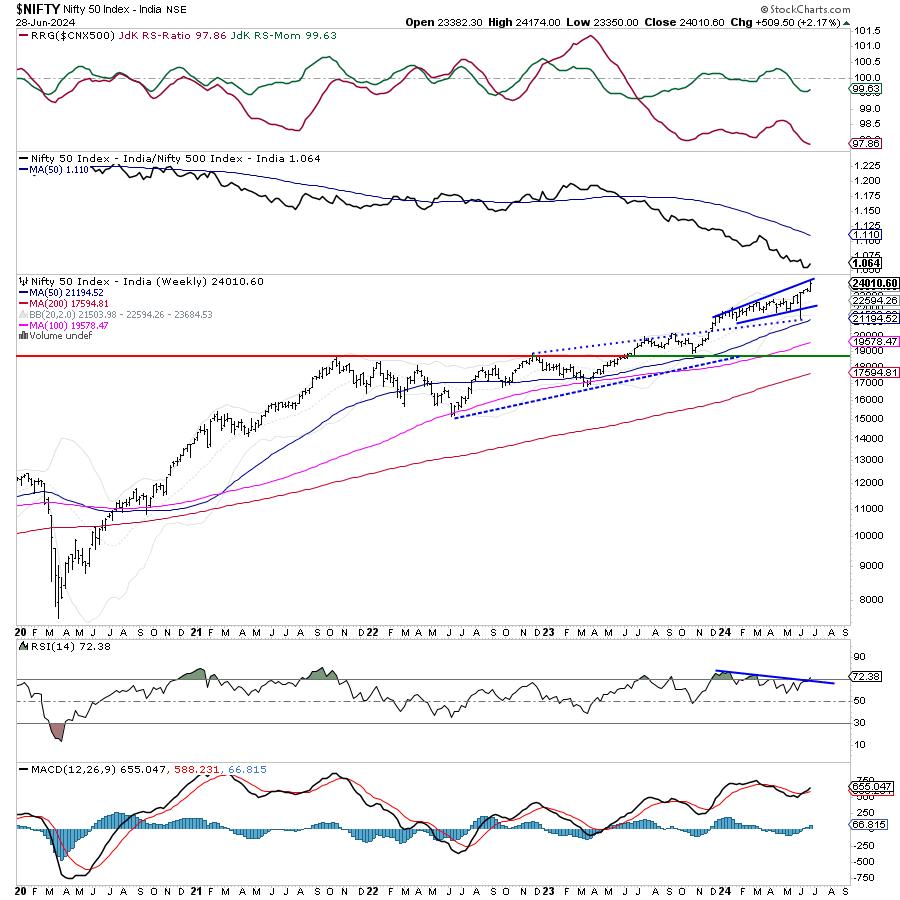
Week Ahead: Nifty Creates Resistance In This Zone; Continue Guarding Profits At Higher Levels
by Milan Vaishnav,
Founder and Technical Analyst, EquityResearch.asia and ChartWizard.ae
After consolidating in the week prior, the markets resumed their up move and have ended the present week on a strong note. The markets also navigated weekly derivatives expiry, showing some signs of fatigue and impending consolidation on the last trading day after rising for four trading sessions in a...
READ MORE
MEMBERS ONLY

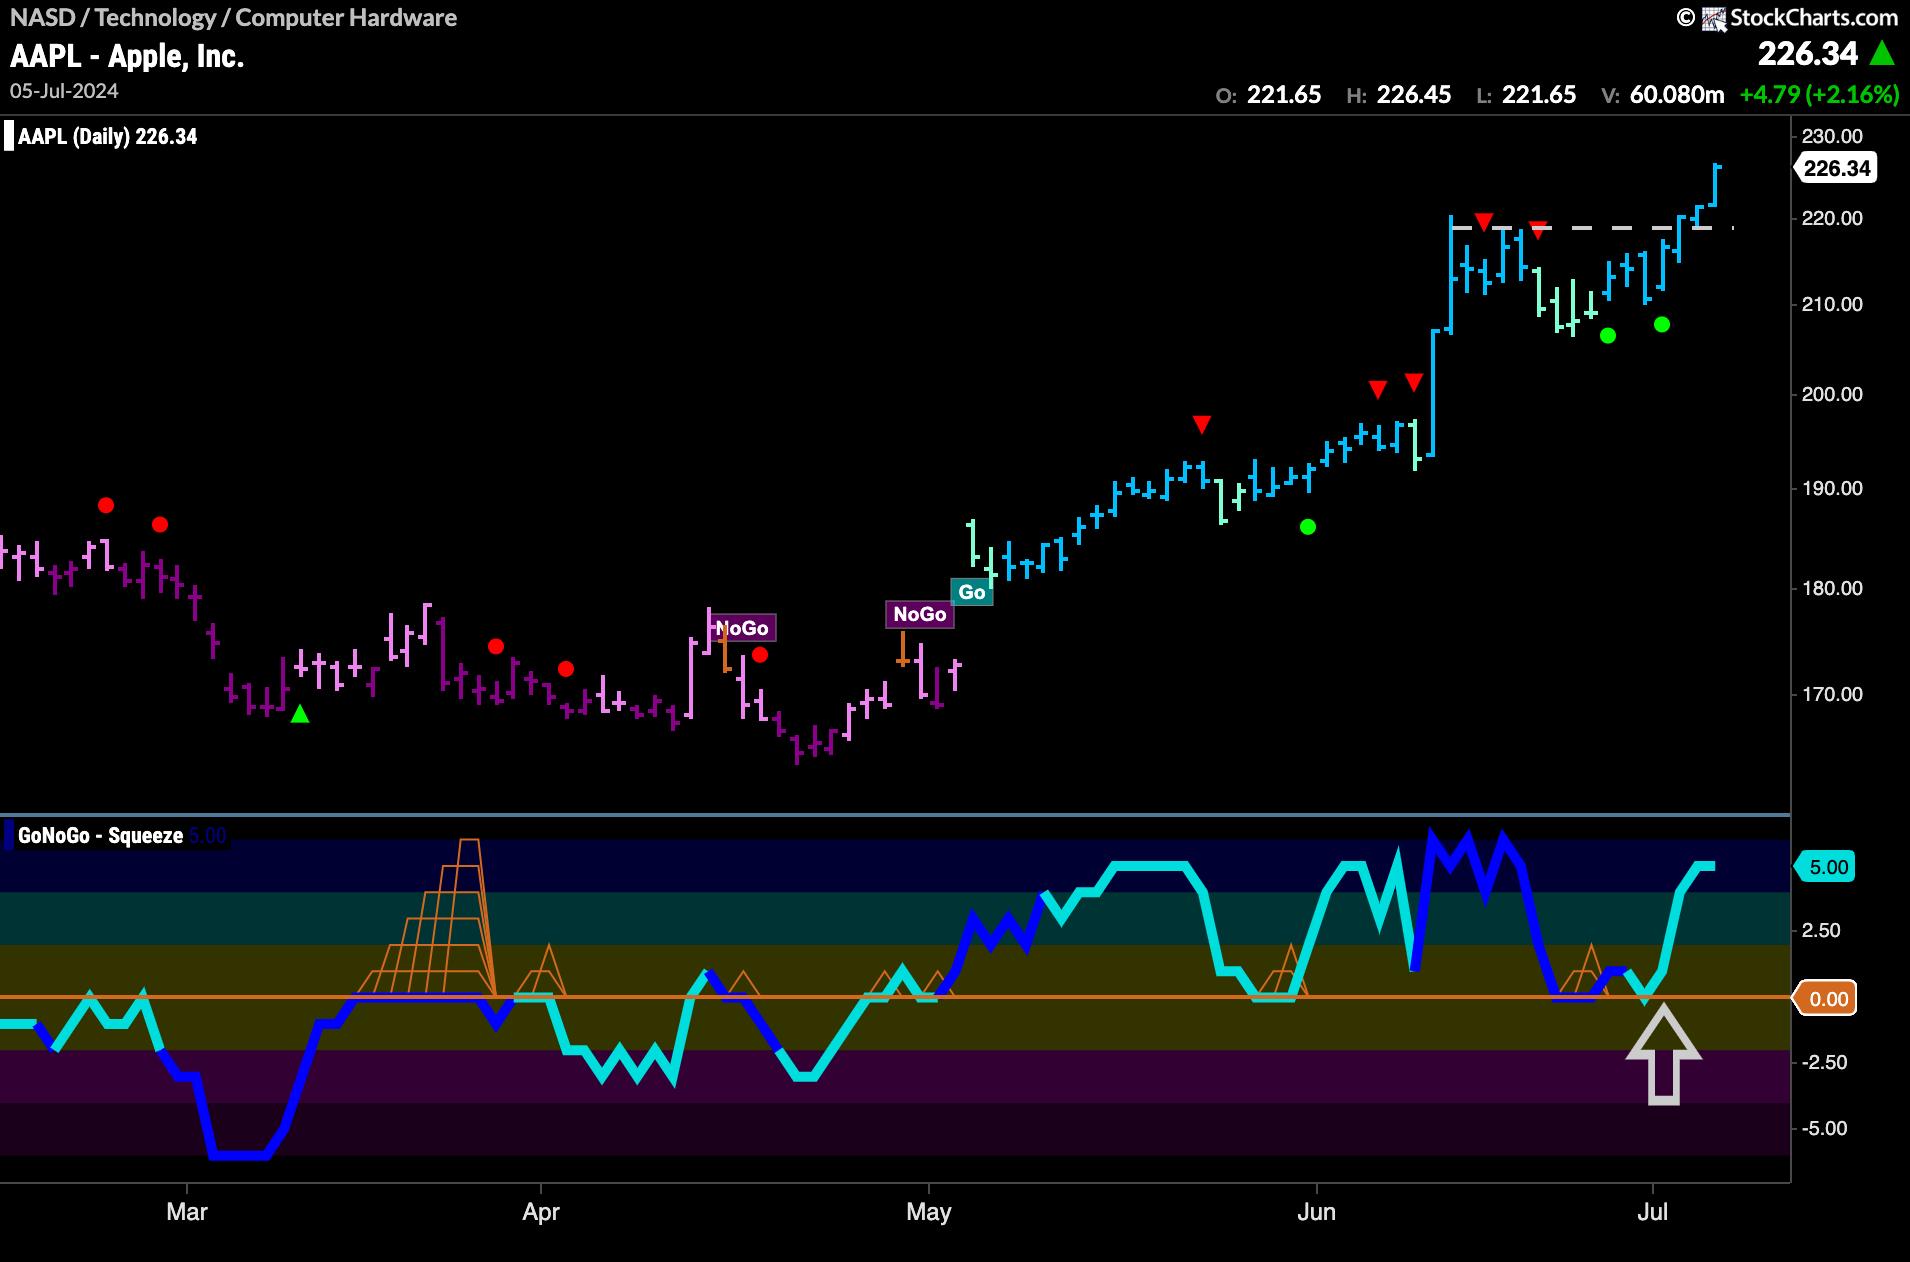
Top 5 Stocks in "Go" Trends | Fri June 28, 2024
by Tyler Wood,
Co-founder, GoNoGo Charts®
KEY TAKEAWAYS
* Trend Continuation
* Breakouts
* Momentum Confirmation
* Bull Flags
Top 5 Stocks in "Go" Trends
Trend Continuation on Rising Momentum
GoNoGo Charts® highlight low-risk opportunities for trend participation with intuitive icons directly in the price action. The resurgence of momentum in the direction of the underlying price trend...
READ MORE
MEMBERS ONLY
2 NEW AREAS Are on the Move - Don't Miss Them!
by Mary Ellen McGonagle,
President, MEM Investment Research
In this StockCharts TV video, Mary Ellen recaps last week's market activity and the factors influencing market movements. She highlights two names, PANW and ADSK, as two bright spots in an otherwise rough preview of earnings season.
This video originally premiered June 28, 2024. You can watch it...
READ MORE
MEMBERS ONLY
Top 10 Stocks to Watch in July 2024!
by David Keller,
President and Chief Strategist, Sierra Alpha Research

by Grayson Roze,
Chief Strategist, StockCharts.com
In this edition of StockCharts TV'sThe Final Bar, join Dave and Grayson as they run through top 10 charts to watch in July 2024! They'll cover breakout strategies, moving average techniques, relative strength, and much more. You don't want to miss these insights into...
READ MORE
MEMBERS ONLY
Stock Market's Choppy Action Continues: Focus is on Jobs Report, Powell Speech
by Jayanthi Gopalakrishnan,
Director of Site Content, StockCharts.com
KEY TAKEAWAYS
* The stock market continued to move sideways as investors continue to be indecisive
* Speech from Fed Chair Powell and Fed meeting minutes could send the market in either direction
* Friday's jobs report could impact price action in the stock market
The stock market's theme...
READ MORE
MEMBERS ONLY
Mastering GoNoGo Charting: Scanning Securities on StockCharts.com
by Tyler Wood,
Co-founder, GoNoGo Charts®
KEY TAKEAWAYS
* Scanning
* screening
* Idea Generation
* Market Breadth
Join Tyler Wood, CMT, in this insightful tutorial where he demonstrates how to effectively scan for GoNoGo conditions using StockCharts.com. GoNoGo Charts, a powerful method developed by Alex Cole and Tyler Wood, blend foundational tools in technical analysis into a powerful...
READ MORE
MEMBERS ONLY
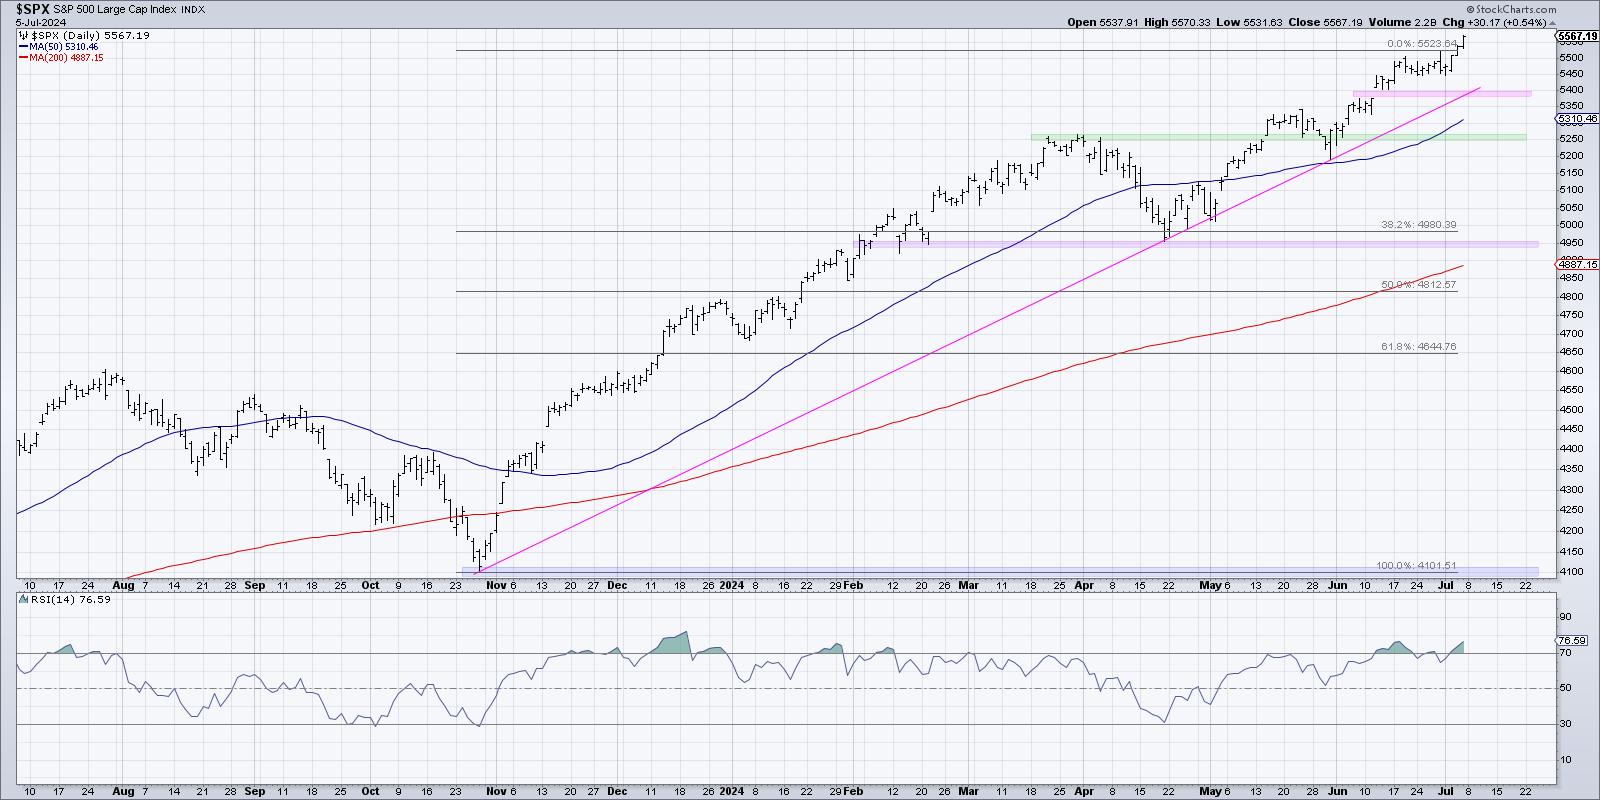
Can the S&P 500 Move Meaningfully Higher Without NVDA?
by David Keller,
President and Chief Strategist, Sierra Alpha Research
2024 has been a year marked by exceptional returns for a relatively small number of high-flying growth stocks. In recent weeks, top performers like Nvidia (NVDA) have pulled back, and Super Micro Computer (SMCI) remains well below its all-time high from earlier this year. So can the major equity benchmarks...
READ MORE
MEMBERS ONLY

3 Essential Lessons We Investors Can Learn from Top Winemakers

by Gatis Roze,
Author, "Tensile Trading"
"It takes 10 years to learn from the vineyard, and another 10 years to learn the wine from that vineyard."
Metaphors and analogies are powerful teachers and offer behavioral adhesiveness. In other words, the ideas and lessons they present stick in our memory, and can thus more easily...
READ MORE
MEMBERS ONLY

Bank Stress Tests: What They Mean for Your Portfolio
by Jayanthi Gopalakrishnan,
Director of Site Content, StockCharts.com
KEY TAKEAWAYS
* The 2024 bank stress results show that all participating banks are able to withstand an economic collapse
* In spite of the banks passing the stress test, the XLF didn't see much movement
* Look for XLF to reverse at its 50% Fibonacci retracement level and start gaining...
READ MORE
MEMBERS ONLY

The 4 Best Tech Stocks to Watch Now!
by David Keller,
President and Chief Strategist, Sierra Alpha Research
In this edition of StockCharts TV'sThe Final Bar, Dave shares charts for Palo Alto Networks, Arista Networks, Adobe Systems, and Fortinet, four tech stocks that are all pushing higher despite major indexes remaining sideways going into Friday's economic releases. He also breaks down the chart of...
READ MORE