MEMBERS ONLY
STOCKCHARTS NOW ON FACEBOOK
DO YOU LIKE US? DO YOU REALLY, REALLY LIKE US? - StockCharts now has an official page on FaceBook that FaceBook users can use to keep up with the latest site developments and articles. Just visit https://facebook.com/stockchartscom and click the "Like" button at the top...
READ MORE
MEMBERS ONLY
THE NEED FOR SPEED
Hello Fellow ChartWatchers!
Are you feeling more bullish now? Last week's rallies have put some needed energy back into the traders that haven't gone on vacation this summer. Technically the market is mixed and you can see evidence of that in the articles below - John...
READ MORE
MEMBERS ONLY
S&P 500 BREAKS LONG-TERM MOVING AVERAGE

by Arthur Hill,
Chief Technical Strategist, TrendInvestorPro.com
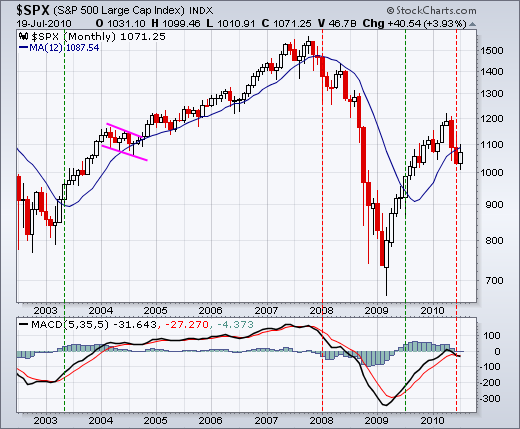
On the monthly chart, the S&P 500 broke below its 12-month moving average for the first time since July 2009. Even though moving average crossovers do not pick exact bottoms or tops, this moving average cross captured the major moves over the last eight years. As with all...
READ MORE
MEMBERS ONLY

DOW AND NASDAQ CROSS BACK OVER 200-DAY LINES -- THAT INCREASES ODDS FOR SUMMER RALLY -- EMERGING MARKETS ARE LEADING RALLY -- % NYSE STOCKS TRADING OVER 200-DAY AVERAGE TURNS UP

by John Murphy,
Chief Technical Analyst, StockCharts.com
EMERGING MARKETS LEAD STOCK RALLY... A couple of months ago we were concerned that foreign stocks (and emerging markets in particular) were leading the U.S. stock market lower. That trend has reversed. Emerging markets are now leading us higher. Chart 1 shows Emerging Market iShares having already exceeded its...
READ MORE
MEMBERS ONLY
STOCK INDEXES BREAK DAILY DOWNTREND
by John Murphy,
Chief Technical Analyst, StockCharts.com
Stocks turned in a strong performance Thursday. The three major stock indexes shown below closed back over their 50-day moving averages. The S&P 500 (Chart 2) and the Nasdaq Composite (Chart 3) did so for the first time since early May. Another positive sign is the ability of...
READ MORE
MEMBERS ONLY
UNDERSTANDING DIVERGENCE

by Tom Bowley,
Chief Market Strategist, EarningsBeats.com
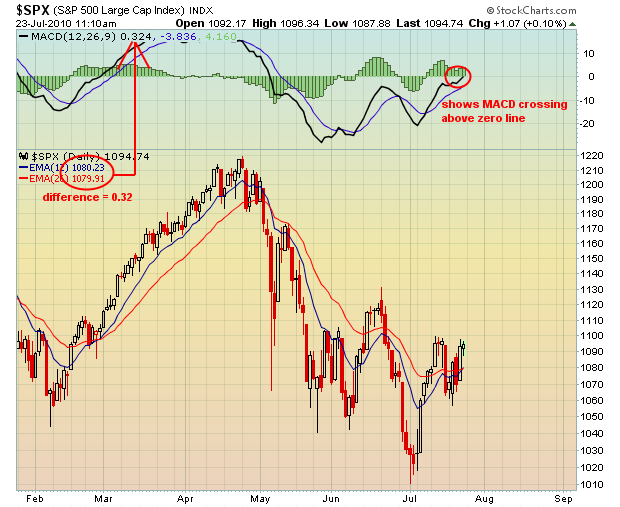
Divergences are among the most misused technical analysis tool anywhere, in my opinion. The first step in successful trading using divergences is understanding both their strengths and their limitations. My preference is to focus on divergences as they relate to the Moving Average Convergence Divergence (MACD). Others use divergences on...
READ MORE
MEMBERS ONLY
NOW THAT'S A TRADABLE RALLY!

by Richard Rhodes,
Founder and President, Rhodes Capital Management and Rhodes Trading Group
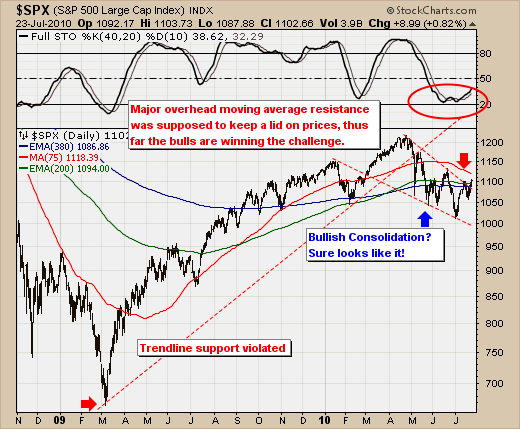
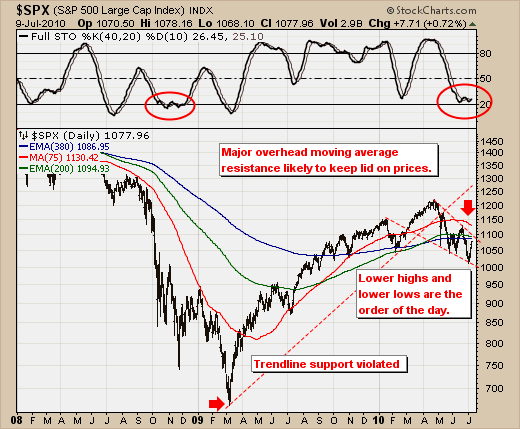
After a horrid 2nd quarter, the S&P 500 is sure making up it's losses at a rapid rate. We've been rather bearish of late given the S&P was trading below its major moving averages that delineate bull & bear markets, with the...
READ MORE
MEMBERS ONLY
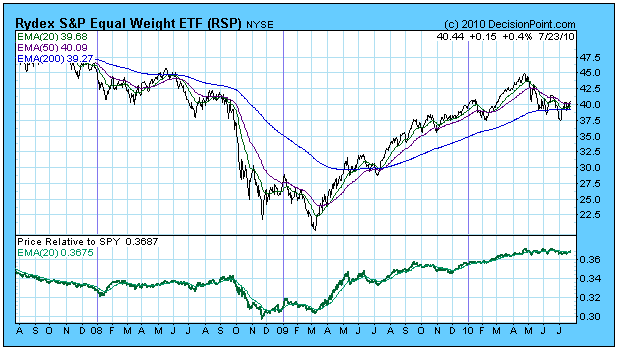
MONITORING EQUAL-WEIGHT INDEXES

by Carl Swenlin,
President and Founder, DecisionPoint.com
We have added a new page of charts to help us monitor the relative strength of equal-weighted indexes against their capitalization-weighted counterparts. Cap-weighted index values are dominated by the larger-cap stocks in the index. For example, the 50 largest-cap stocks in the S&P 500 represent about 70% of...
READ MORE
MEMBERS ONLY

DAX has yet to break down
by Arthur Hill,
Chief Technical Strategist, TrendInvestorPro.com
Despite all the troubles in Europe, the German DAX ($DAX) remains in a uptrend since March 2009 and has yet to roll over. The index is above its 12-month moving average and MACD(5,35,5) is positive. However, notice that index retraced 50-62% of its prior decline and is...
READ MORE
MEMBERS ONLY

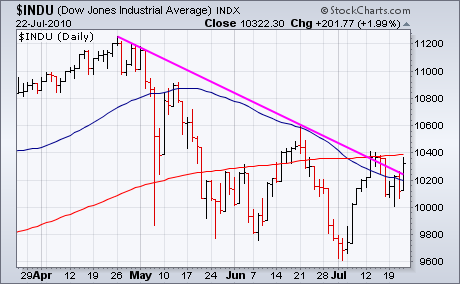
STOCK INDEXES BREAK THREE-MONTH DOWN TRENDLINE INCREASING ODDS FOR SUMMER BOUNCE -- THREE-MONTH HIGH IN COPPER IS ANOTHER SHORT-TERM POSITIVE FACTOR FOR STOCKS --
by John Murphy,
Chief Technical Analyst, StockCharts.com
STOCK INDEXES BREAK DOWN TRENDLINE... Stocks turned in a strong performance today. The three major stock indexes shown below closed back over their 50-day moving averages. The S&P 500 (Chart 2) and the Nasdaq Composite (Chart 3) did so for the first time since early May. Another positive...
READ MORE
MEMBERS ONLY

POSITIVE EARNINGS FORECASTS FROM AT&T, QUALCOMM, AND UPS BOOST STOCKS -- DOW TRANSPORTS AND NASDAQ 100 LEAD STOCK RALLY -- UPSIDE BREAKOUT IN COPPER BOOSTS FREEPORT MCMORAN COPPER & GOLD
by John Murphy,
Chief Technical Analyst, StockCharts.com
THREE EARNINGS LEADERS... The three stocks shown below are rallying sharply on increased profit forecasts and are giving a big boost to stocks. Chart 1 shows AT&T jumping 3% to the highest level in three months. Chart 2 shows Qualcomm gapping up 8% to a three month high...
READ MORE
MEMBERS ONLY

Bonds remain in long-term uptrend
by Arthur Hill,
Chief Technical Strategist, TrendInvestorPro.com
The 20+ Year T-Bond ETF (TLT) continues to trend higher within a large rising price channel. The ETF surged above the channel during the finance crisis of 2008, but returned to this channel in 2009 and resumed its rise in 2010. Long-term support is set at 85.
Click this image...
READ MORE
MEMBERS ONLY

BERNANKE'S COMMENT SINKS STOCKS -- BONDS CONTINUE RALLY -- VIX HOLDS SUPPORT
by John Murphy,
Chief Technical Analyst, StockCharts.com
MOVING AVERAGES PROVIDE RESISTANCE... [Arthur Hill is off today]. Mr. Bernanke's comment that the U.S. economic outlook is "unusually uncertain" contributed to afternoon selling of stocks and buying of bonds. The first three charts show that moving average lines are acting as resistance barriers over...
READ MORE
MEMBERS ONLY
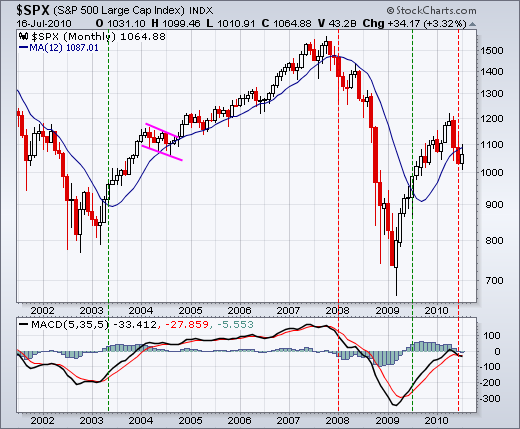
S&P 500 breaks 12-month moving average
by Arthur Hill,
Chief Technical Strategist, TrendInvestorPro.com
The monthly chart below shows the S&P 500 holding its 12-month moving average throughout long-term moves over the last 9 years. A decisive close above or below this 12-month moving average has been indicative of a long-term trend change, which occurred last month. Also notice that MACD(5,...
READ MORE
MEMBERS ONLY

STOCKS RECOVER FROM EARLY DROP -- COMMODITIES REBOUND WITH STOCKS -- GOLD AND GOLD STOCKS BOUNCE OFF CHART SUPPORT
by John Murphy,
Chief Technical Analyst, StockCharts.com
MARKET INDEXES ACHIEVE UPSIDE REVERSAL... Stocks turned in a reasonably impressive performance today. After trading lower this morning, the major stock indexes closed higher. Although volume wasn't that heavy, it did pick up a bit from yesterday. That turned what started out as a potentially ugly day into...
READ MORE
MEMBERS ONLY

IBM AND CHIP STOCKS LEAD MARKET LOWER -- SEMICONDUCTOR INDEX THREATENS 200-DAY AVERAGE -- NASDAQ 100 IS IN DANGER OF DEATH CROSS -- CORPORATE BONDS PAY HIGHER YIELDS BUT TREASURIES ARE SAFER
by John Murphy,
Chief Technical Analyst, StockCharts.com
FORMER TECH LEADERS GAP DOWN TODAY... The technology sector is leading the market lower today. Two of the big reasons for that is sharply lower openings in two large tech stocks that had been former leaders. Chart 1 shows IBM gapping down 5% this morning and trading below its 50-day...
READ MORE
MEMBERS ONLY
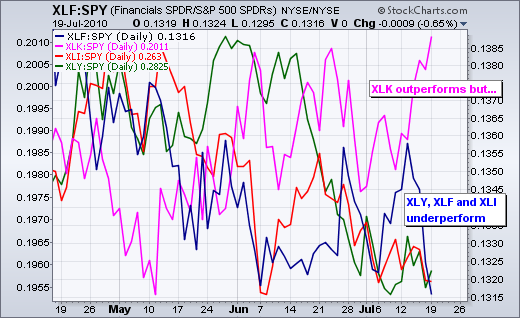
XLK outperforms SPY in July
by Arthur Hill,
Chief Technical Strategist, TrendInvestorPro.com
Believe it or not, the Technology SPDR (XLK) is outperforming the S&P 500 ETF (SPY) in July. The chart below shows four price relatives comparing the performance of the Technology SPDR (XLK), Industrials SPDR (XLI), Financials SPDR (XLF) and Consumer Discretionary SPDR (XLY) to the S&P...
READ MORE
MEMBERS ONLY

SPY stalls after sharp decline
by Arthur Hill,
Chief Technical Strategist, TrendInvestorPro.com
On the daily chart, the S&P 500 ETF (SPY) stalled with a small gain on the day. After Friday's sharp decline, a little indecision or a small rebound is normal. There is really no change on the daily chart. The falling wedge still dominates the overall...
READ MORE
MEMBERS ONLY

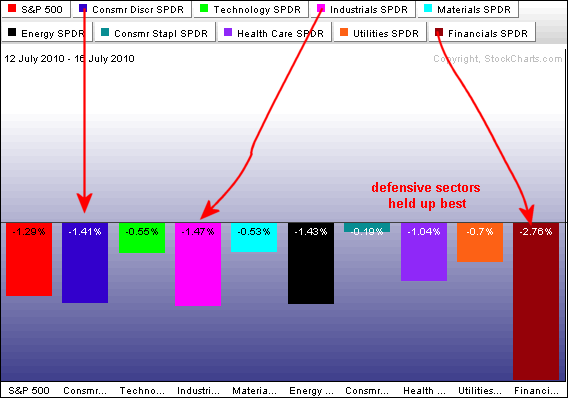
Finance leads the way lower
by Arthur Hill,
Chief Technical Strategist, TrendInvestorPro.com
The PerfChart below shows the percentage change for the nine sector SPDRs over the last five days (last week). Stocks were holding up well until Friday. With Friday's sharp decline, finance is now showing relative weakness because it declined more than the S&P 500 and more...
READ MORE
MEMBERS ONLY

FINANCIALS FAIL AT RESISTANCE AND SHOW RELATIVE WEAKNESS -- UTILITIES SPDR CONTINUES TO SHOW RELATIVE STRENGTH -- TIP AND GLD WEAKEN TOGETHER -- JAPAN FOLLOWS US, BUT CHINA GETS A BIG BOUNCE -- NATURAL GAS ETFS FORM FALLING CHANNELS
by John Murphy,
Chief Technical Analyst, StockCharts.com
FINANCIALS FAIL AT RESISTANCE AND SHOW RELATIVE WEAKNESS ... Link for todays video. Relative weakness in the finance sector weighed heavily on the market last week. All nine sectors and the S&P 500 were down for the week, but the finance sector was the only sector to loose over...
READ MORE
MEMBERS ONLY
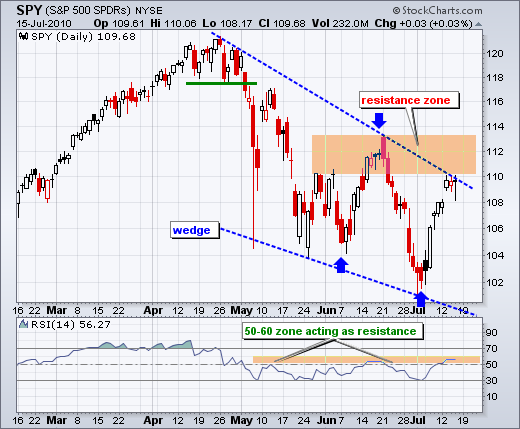
SPY fails at resistance zone
by Arthur Hill,
Chief Technical Strategist, TrendInvestorPro.com
Stocks moved sharply lower with a broad decline on Friday. The major indices were down from 2.52% (Dow) to 3.82% (Russell 2000). Small-caps continue showing relative weakness. All sectors were down with finance (-4.21%), consumer discretionary (-3.50%) and industrials (-3.34%) leading the way. Relative weakness...
READ MORE
MEMBERS ONLY

STOCKS MOVE SHARPLY LOWER TO AFFIRM RESISTANCE ZONES -- BREADTH INDICATORS REMAIN BEARISH OVERALL -- RISING EURO WEIGHS ON GOLD -- GOLD BREAKS WEDGE SUPPORT -- VOLATILITY INDICES TEST IMPORTANT SUPPORT ZONES
by John Murphy,
Chief Technical Analyst, StockCharts.com
STOCKS MOVE SHARPLY LOWER TO AFFIRM RESISTANCE ZONES... Link for todays video. After an eight week advance that pushed the S&P 500 up over 7%, stocks moved sharply lower in early trading on Friday. The day is still young, but the S&P 500 is down almost...
READ MORE
MEMBERS ONLY

Cummins forms bearish engulfing near resistance
by Arthur Hill,
Chief Technical Strategist, TrendInvestorPro.com
Cummins Engine came across the bearish engulfing scan as it opened strong and closed weak near resistance. The stock failed in the 74-76 area in April, May and June. July marks the fourth attempt. A move above resistance would break resistance from a rather large symmetrical triangle.
Click this image...
READ MORE
MEMBERS ONLY

Indicator Summary remains negative
by Arthur Hill,
Chief Technical Strategist, TrendInvestorPro.com
Even though last week's bounce continued this week, the indicator summary remains negative. The AD Lines and AD Volume Lines surged, but remain below their June highs (resistance). Another strong week would likely push these indicators above resistance and into bull mode. This means Mr Market is at...
READ MORE
MEMBERS ONLY
SPY extends stall near resistance zone
by Arthur Hill,
Chief Technical Strategist, TrendInvestorPro.com
There is no change on the daily chart as SPY stalls just below its big resistance zone. On a closing basis, there have been three moves in excess of 6% over the last 26 days (blue arrows). First, SPY bottomed on June 7th and advanced 6.4% in nine days....
READ MORE
MEMBERS ONLY

SOME FED GOVERNORS ARE WORRIED ABOUT DEFLATION -- NEGATIVE PPI DOESN'T HELP -- FALLING BOND YIELDS CAST DOUBT ON RECENT STOCK BOUNCE
by John Murphy,
Chief Technical Analyst, StockCharts.com
JUNE MINUTES SHOW DEFLATION FEAR ... Wednesday's market bounce stalled on release of the Fed's June minutes that lowered the estimate for the U.S. economy for the balance of the year. Also reported was a number of Fed governors that expressed concern about the growing threat...
READ MORE
MEMBERS ONLY

Euro-SPY connection remains
by Arthur Hill,
Chief Technical Strategist, TrendInvestorPro.com
There was a little delay, but the positive correlation between the Euro the US stocks remains in place.
The Euro ETF (FXE) bottomed on June 29 and SPY bottomed two days later. FXE surged in early July and SPY followed the Euro high the second week of July.
Click this...
READ MORE
MEMBERS ONLY
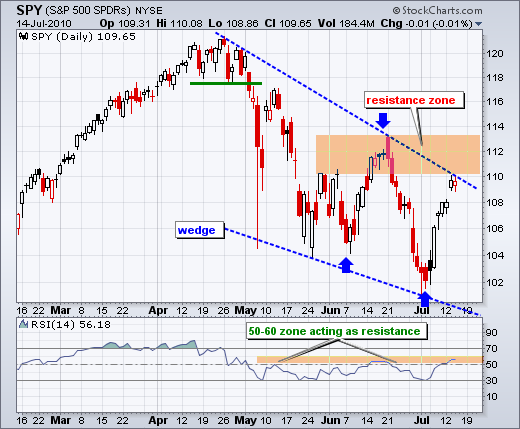
SPY stall near resistance zone
by Arthur Hill,
Chief Technical Strategist, TrendInvestorPro.com
There is no change on the daily chart as SPY stalls just below its big resistance zone. On a closing basis, there have been three moves in excess of 6% over the last 26 days (blue arrows). First, SPY bottomed on June 7th and advanced 6.4% in nine days....
READ MORE
MEMBERS ONLY

SPY AND DIA STALL NEAR RESISTANCE ZONES -- SEMICONDUCTORS HOLDRS SURGES TO RESISTANCE -- INTEL LEADS AS APPLE LAGS -- FINANCE SPDR AND REGIONAL BANK SPDR HIT RESISTANCE -- BASE METALS ETF BACKS OFF RESISTANCE
by John Murphy,
Chief Technical Analyst, StockCharts.com
SPY AND DIA STALL NEAR RESISTANCE ZONES... Link for todays video. After a big surge the last six days, stocks took a breather with mixed action on Wednesday. The Nasdaq edged higher, but the S&P 500 and Russell 2000 were lower on the day. Chart 1 shows the...
READ MORE
MEMBERS ONLY
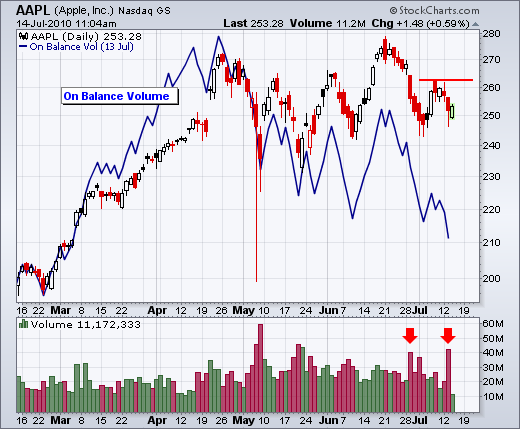
Selling Pressue in OBV for Apple
by Arthur Hill,
Chief Technical Strategist, TrendInvestorPro.com
The Apple chart shows signs of increased selling pressure with a steady decline in On Balance Volume (OBV) the last 2-3 months. OBV peaked in mid April, formed a lower high in late June and moved to new lows in July. With Apple (AAPL) hitting a new high in late...
READ MORE
MEMBERS ONLY

SPY hits resistance zone on daily chart
by Arthur Hill,
Chief Technical Strategist, TrendInvestorPro.com
Stocks were oversold 7-8 days ago and an oversold bounce was expected. However, I must admit that I did not expect a move all the way to the 110-113 resistance zone, especially after sharpness of the prior decline. On a closing basis, there have been three moves in excess of...
READ MORE
MEMBERS ONLY

KEY RETRACEMENTS COME INTO PLAY FOR DIA AND SPY -- IWM STALLS WITH SHORTER RETRACEMENT -- SMALL-CAPS AND MID-CAPS SHOW RELATIVE WEAKNESS -- OIL HITS RESISTANCE IN 50-62% RETRACEMENT ZONE -- OIL AND STOCKS CONTINUE MOVING TOGETHER
by John Murphy,
Chief Technical Analyst, StockCharts.com
KEY RETRACEMENTS COMING INTO PLAY FOR DIA AND SPY... Link for todays video. There are at least two trends present in the current market: a medium-term downtrend since late April and a short-term uptrend since last week. With the bigger trend down, this short-term uptrend is considered a corrective move...
READ MORE
MEMBERS ONLY
See the Market Message for today's commentary
by Arthur Hill,
Chief Technical Strategist, TrendInvestorPro.com
See the Market Message for today's commentary ( click here)....
READ MORE
MEMBERS ONLY

Nasdaq P&F chart shows downtrend
by Arthur Hill,
Chief Technical Strategist, TrendInvestorPro.com
The Nasdaq Point & Figure chart sports a clear downtrend with a bearish resistance line and a downside price objective around 1900. According to this chart, the trend will remain down until there is a break above the bearish resistance line, which is currently around 2345.
Click this image for...
READ MORE
MEMBERS ONLY

SPY enters retracement zone
by Arthur Hill,
Chief Technical Strategist, TrendInvestorPro.com
There is no change on the daily chart. SPY remains in a downtrend overall and is currently trading near the middle of its seven week range (113-101). A falling wedge defines the overall downtrend with a resistance zone around 110-113 from the June highs. Even though last week's...
READ MORE
MEMBERS ONLY
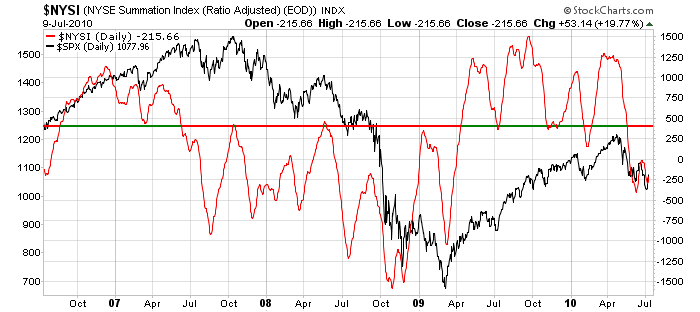
NYSE SUMMATION INDEX'S "400" SIGNAL
Hello Fellow ChartWatchers!
With the market posting four solid up days over the past week, is now the time to get back in to the market? That's the main topic of this week's newsletter and there are lots of opinions going around right now.
One of...
READ MORE
MEMBERS ONLY
THE MID-YEAR UPDATE
by Tom Bowley,
Chief Market Strategist, EarningsBeats.com
In the life of a technical analyst, a month seems like a week, a week seems like a day and a day seems like minutes. Time flies and so do the charts and various technical patterns. I think it's always a good idea to periodically take a step...
READ MORE
MEMBERS ONLY
CURRENT S&P RALLY HAVE STAYING POWER?
by Richard Rhodes,
Founder and President, Rhodes Capital Management and Rhodes Trading Group
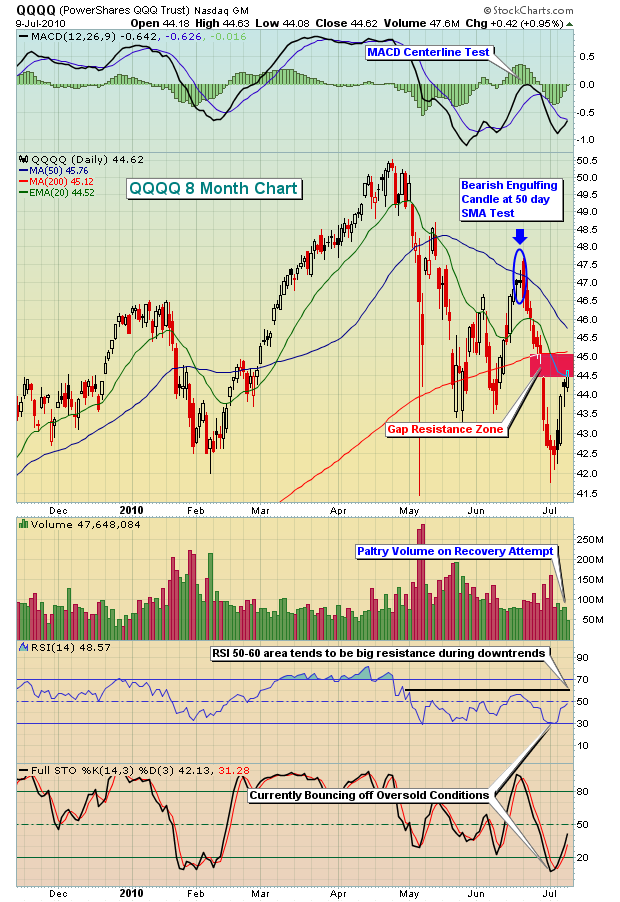
The July 4th fireworks came a bit more belatedly this year as the S&P 500 rose +4.86% in the holiday shortened week. This performance was rather impressive in terms of points and breadth, but certainly not in terms of volume. To us, this calls into question the...
READ MORE
MEMBERS ONLY
NEW LONG-TERM SELL SIGNAL GENERATED
by Carl Swenlin,
President and Founder, DecisionPoint.com
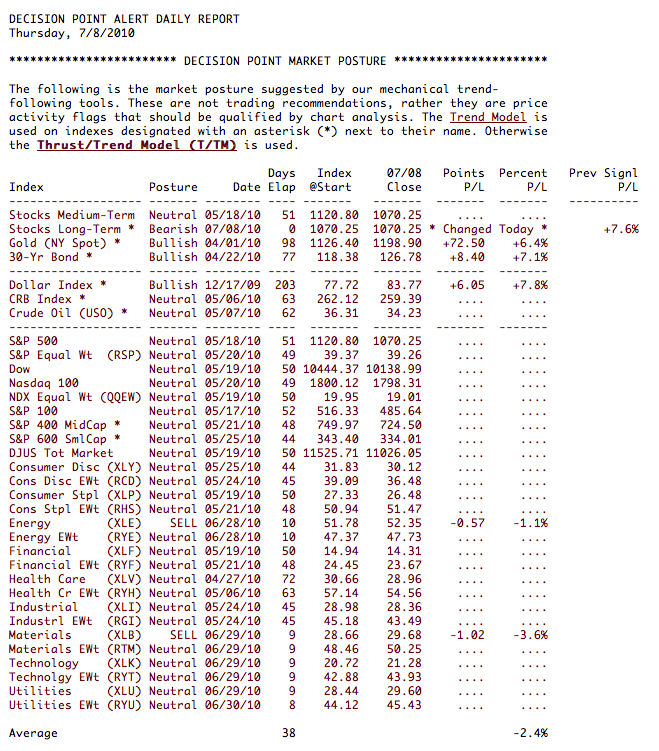
As you can see in our Decision Point Alert Daily Report below our Trend Model has triggered a Long-Term SELL signal for stocks. This occurs when the 50-EMA crosses below the 200-EMA. It has been headed this direction for quite some time so it is not unexpected. Note on the...
READ MORE
MEMBERS ONLY
Gold and silver test support zones
by Arthur Hill,
Chief Technical Strategist, TrendInvestorPro.com
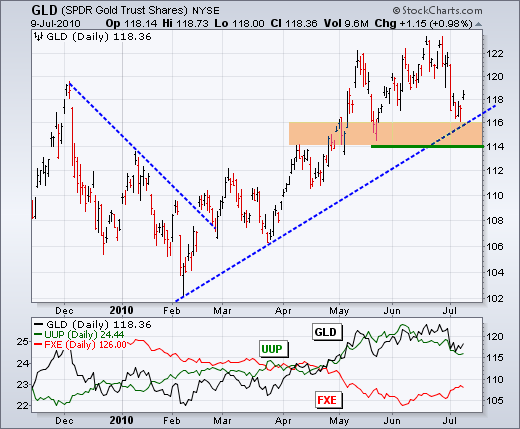
After sharp declines in late June and early July, gold and silver are testing important support zones from their prior lows. The fist chart shows the Gold ETF (GLD) hitting new 52-week highs in late June. These highs did not hold long as GLD declined towards support around 114-116. This...
READ MORE
