MEMBERS ONLY

FALLING 50-DAY AVERAGE USUALLY PROVIDES MORE RESISTANCE ON MARKET BOUNCES -- TIME TO SHORT THE YEN? -- ANALYSIS VERSUS REPORTING

by John Murphy,
Chief Technical Analyst, StockCharts.com
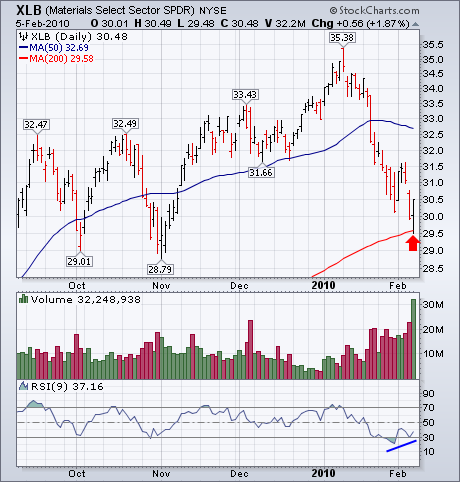
DOES FALLING 50-DAY LINE MEAN ANYTHING? ... One of our readers correctly points out that the blue 50-day moving average is declining for the first time since last March, and asks if that makes it more of a resistance barrier. The short answer is probably. Although most attention is...
READ MORE
MEMBERS ONLY

Overbought RSI and resistance for RIMM

by Arthur Hill,
Chief Technical Strategist, TrendInvestorPro.com
With an advance back to the low 70s, RIMM is one again trading near resistance. The stock was turned back here in mid October and mid December. Also notice that a harami formed on Friday-Tuesday and RSI become overbought last Friday. The 3 week trend is still up, but...
READ MORE
MEMBERS ONLY
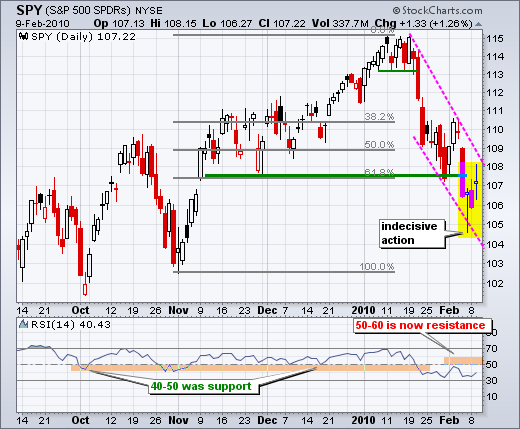
Truth or Consequences time for SPY
by Arthur Hill,
Chief Technical Strategist, TrendInvestorPro.com
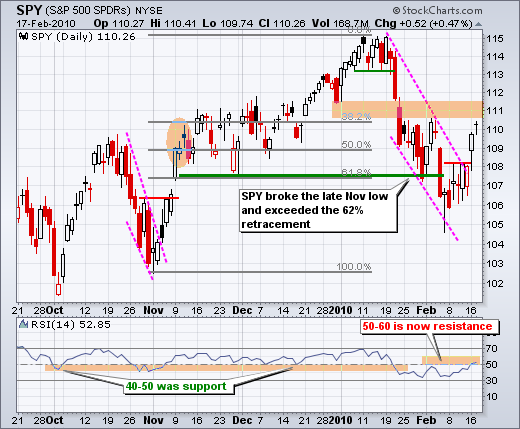
The bounce over the last seven days does not look that strong and resistance is nigh. First, I pointed out mixed breadth and weak volume on Wednesday. Second, individual days show more indecision than strength. After plunging from 115 to 105 (high to low), SPY was oversold in early February...
READ MORE
MEMBERS ONLY

BONDS FALL AS FED CONSIDERS ASSET SALES - EURO GETS HIT AGAIN - XLF TESTS SUPPORT AROUND 14 - GOLD AND EURO DECOUPLE FOR A FEW DAYS - LOOK AT 2003-2004 SPX FOR CLUES TO CURRENT SITUATION
by John Murphy,
Chief Technical Analyst, StockCharts.com
BONDS FALL AS FED CONSIDERS ASSET SALES... Link for todays video. The Fed released the minutes of its January meeting this afternoon. Shrinking the balance sheet proved a top priority among Fed officials. Among other things, this would involve sales of Treasury bonds the Fed bought during its quantitative easing...
READ MORE
MEMBERS ONLY

On Balance Volume surges for Juniper
by Arthur Hill,
Chief Technical Strategist, TrendInvestorPro.com
Juniper (JNPR) is down for the year, but On Balance Volume (OBV) is up so far in 2010. Joe Granville, creator of OBV, postulated that volume precedes price. This simple indicator broke resistance with a surge in early February. The stock is also showing signs of life with a little...
READ MORE
MEMBERS ONLY

Strong move on mixed breadth
by Arthur Hill,
Chief Technical Strategist, TrendInvestorPro.com
Stocks started strong with a gap up on the open and finished strong with a close near their highs for the day. Overall volume was not that strong and Net Advancing Volume was mixed. NYSE Net Advancing Volume ($NYUD) finished at +877, while Nasdaq Net Advancing Volume ($NAUD) finished at...
READ MORE
MEMBERS ONLY
Gasoline ETF Surges off Support
by Arthur Hill,
Chief Technical Strategist, TrendInvestorPro.com
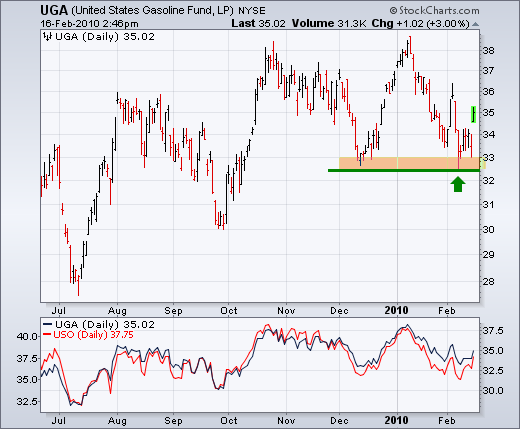
The US Gasoline ETF (UGA) surged off support with a gap and big move on Tuesday. This successful support test keeps the overall uptrend in place. A break below the Dec-Feb lows would reverse the medium-term uptrend. Notice how closely UGA and USO track.
Click this chart for...
READ MORE
MEMBERS ONLY

STOCK AND COMMODITY REBOUND CONTINUES AS EURO BOUNCES AND DOLLAR WEAKENS -- COMMODITY STOCKS LEAD REBOUND -- GLOBAL STOCK INDEXES RALLY TOWARD THEIR 50-DAY AVERAGES
by John Murphy,
Chief Technical Analyst, StockCharts.com
EURO BOUNCES OFF 62% RETRACEMENT LINE ... Most of the U.S. Dollar strength since December has come from a falling Euro. Therefore, any bounce in the Euro has a big influence on the direction of global stocks and commodities. Chart 1 shows the Euro trading well below its 200-day...
READ MORE
MEMBERS ONLY

IWM and QQQQ Show Resilience
by Arthur Hill,
Chief Technical Strategist, TrendInvestorPro.com
Today I am starting with the Russell 2000 ETF (IWM) and Nasdaq 100 ETF (QQQQ) because both are showing resilience with pretty good advances over the last two days. Both broke above wedge trendlines and finished near the high for the week. It is positive to see small-caps and...
READ MORE
MEMBERS ONLY

TECHS AND SMALL-CAPS SHOW RESILIENCE - SPX HITS LONG TERM REVERSAL ZONE - CHANNEL STILL FALLING FOR SPX - OIL BATTLES SUPPORT - XLE AND OIH ALSO BATTLING SUPPORT - SHANGHAI COMPOSITE BREAKS SUPPORT
by John Murphy,
Chief Technical Analyst, StockCharts.com
TECHS AND SMALL-CAPS SHOW RESILIENCE... Link for todays video. The Nasdaq 100 ETF (QQQQ) and the Russell 2000 ETF (IWM) are showing relative strength this week. Concerns with Greek debt and monetary tightening in China weighed on stocks in early trading, but buyers stepped in after the morning gap...
READ MORE
MEMBERS ONLY

Atmos Energy gets oversold bounce
by Arthur Hill,
Chief Technical Strategist, TrendInvestorPro.com
Atmos Energy came across the oversold RSI scan as 14-day RSI moved above 30 on Thursday. Also notice that the stock bounced right back to its 200-day moving average.
Click this chart for details...
READ MORE
MEMBERS ONLY

Evidence remains bearish
by Arthur Hill,
Chief Technical Strategist, TrendInvestorPro.com
On balance, the evidence still favors the bears at this stage. We are, however, still in a transition period or the early stages. The evidence favored the bulls from early September to February 5th. On February 5th, the sum total turned negative to favor the bears for the first time...
READ MORE
MEMBERS ONLY

SPY gets a bounce
by Arthur Hill,
Chief Technical Strategist, TrendInvestorPro.com
These daily SPY updates are short-term in nature and subject to change as new price data and information come to light - which is hourly. The objective of this analysis is education. It is not meant as a recommendation to buy, sell or sell short. The only advice I have...
READ MORE
MEMBERS ONLY

GREEK SUPPORT PLAN BOOSTS STOCKS AND COMMODITIES -- DAILY AND WEEKLY BOLLINGER BANDS SHOW SUPPORT -- MORE MARKETS BOUNCE OFF 200-DAY AVERAGE -- % NYSE STOCKS ABOVE 200-DAY AVERAGE HAS FALLEN TO SEVEN-MONTH LOW
by John Murphy,
Chief Technical Analyst, StockCharts.com
BLENDING DAILY AND WEEKLY BANDS... One of the reasons I thought last Friday's upside reversal day signalled a short-term rally attempt was because it occurred right at its lower Bollinger band as shown in Chart 1. Another reason is that the two bands have started to contract...
READ MORE
MEMBERS ONLY
Microsoft firms near the gap zone
by Arthur Hill,
Chief Technical Strategist, TrendInvestorPro.com
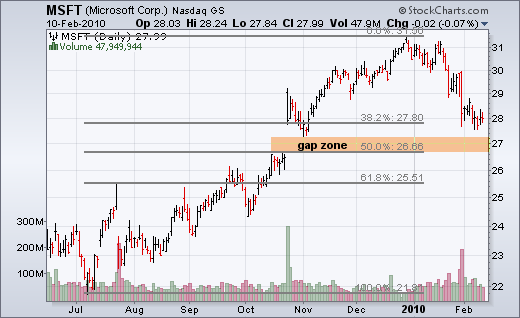
After a sharp (~10%) decline this year, Microsoft (MSFT) is nearing its first support zone around 27-28. Support here stems from the October gap and the 38% retracement. MSFT firmed around 28 over last four days and yesterday's range was the narrowest of the last six days....
READ MORE
MEMBERS ONLY
Oversold and firming
by Arthur Hill,
Chief Technical Strategist, TrendInvestorPro.com
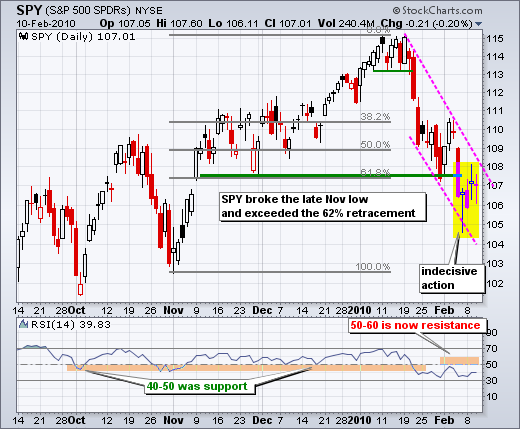
Today I am going to show four daily charts: SPY, RSP, IWM and QQQQ. This is an interesting quartet. SPY broke the late November low and exceeded the 62% retracement. The decline from 115 to 105 was the deepest since March and did enough technical damage to turn medium-term...
READ MORE
MEMBERS ONLY

STOCKS EXTEND STALL - BONDS DECLINE ON BERNANKE REMARKS - HIGH YIELD BOND ETF HIT HARD - CORPORATE BOND ETF FORMS LOWER HIGH - JUNK VERSUS INVESTMENT GRADE - PERCENT OF STOCKS ABOVE 50-DAY PLUMMETS
by John Murphy,
Chief Technical Analyst, StockCharts.com
STOCKS EXTEND STALL... Link for todays video. Stocks stalled again on Wednesday with the major indices finishing mixed. Actually, most indices were down slightly with fractional gains coming from the Russell 2000 ($RUT) and the S&P 600 SmallCap Index ($SML). Small-caps showed a little relative strength today....
READ MORE
MEMBERS ONLY
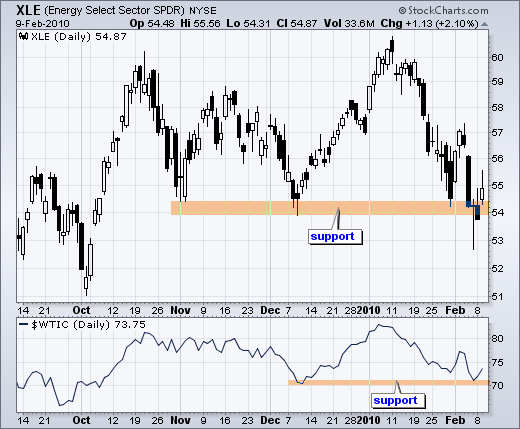
Energy SPDR and Oil Test Support
by Arthur Hill,
Chief Technical Strategist, TrendInvestorPro.com
The Energy SPDR (XLE) and West Texas Intermediate ($WTIC) are both testing support from their December lows. XLE bounced off the 54 area in early November and early December to establish support. Oil bounced off 70 in early December to establish support. Successful tests would be bullish, but breaks by...
READ MORE
MEMBERS ONLY
A hesitant bounce for SPY plus 5 stock charts
by Arthur Hill,
Chief Technical Strategist, TrendInvestorPro.com
The medium-term and short-term trends are both considered down at this point. SPY broke below its late November support zone with the biggest decline since early last year. After a selling climax of sorts on Friday, the ETF bounced back above 107 on Tuesday. This bounce was, however,...
READ MORE
MEMBERS ONLY

BIG DROP IN GREEK BOND YIELDS ENCOURAGES STOCK AND COMMODITY REBOUND AS DOLLAR DROPS -- MATERIALS ARE DAY'S STOCK LEADERS -- A LOT OF 200-DAY AVERAGES ARE HOLDING FOR NOW -- THAT SUGGESTS A SHORT-TERM BOTTOM
by John Murphy,
Chief Technical Analyst, StockCharts.com
MATERIALS LEAD GLOBAL REBOUND... A 40 basis point plunge in Greek bond yields, which is the biggest drop in more than a decade, has increased hopes for some type of aid to that endangered economy. That has eased downside pressure on the Euro and caused some profit-taking in an...
READ MORE
MEMBERS ONLY

ORLY forms a triangle consolidation
by Arthur Hill,
Chief Technical Strategist, TrendInvestorPro.com
After a decline from mid November to mid December, O'Reilly Automotive (ORLY) formed a triangle consolidation. The stock is holding up better that the S&P 500 since January, but a triangle break is required for the next directional signal.
Click this chart for details...
READ MORE
MEMBERS ONLY

SPY analysis and charts of interest
by Arthur Hill,
Chief Technical Strategist, TrendInvestorPro.com
SPY started the day strong, but finished weak and closed with a modest loss. Even though there was no follow through on Monday, the ETF remains short-term oversold and ripe for a bounce or consolidation. Overall, the 3-4 week pattern looks like a zigzag decline with three legs...
READ MORE
MEMBERS ONLY

Finance leads sectors lower
by Arthur Hill,
Chief Technical Strategist, TrendInvestorPro.com
The Sector SPDR section of the Market Summary shows the Financials SPDR (XLF) and the Materials SPDR (XLB) leading the market lower today. Despite Friday's intraday reversal, there was no follow through as all sectors moved lower on Monday.
Click this chart for details...
READ MORE
MEMBERS ONLY

DOLLAR BECOMES OVERBOUGHT AGAIN - GOLD REMAINS TIED TO THE DOLLAR - AN ABC CORRECTION FOR GLD - OIL FLIRTS WITH SUPPORT - LONG-TERM RATES RISING
by John Murphy,
Chief Technical Analyst, StockCharts.com
DOLLAR BECOMES OVERBOUGHT AGAIN... Link for todays video. For the second time in two weeks, the US Dollar Index ($USD) surged and became overbought. Chart 1 shows the index with 14-day RSI moving back above 70. This is also the third overbought reading since December 21st. While overbought readings...
READ MORE
MEMBERS ONLY

A reversal day for SPY
by Arthur Hill,
Chief Technical Strategist, TrendInvestorPro.com
SPY plunged below its late November low on Thursday and firmed on Friday with a reversal candlestick. Even though it is not a picture perfect hammer, the essence of the pattern is clearly there. SPY opened at 106.56, plunged below 105 intraday and recovered to close at 106.66,...
READ MORE
MEMBERS ONLY
ON ACCURACY AND EMAs - 2010 UPDATE
Hello Fellow ChartWatchers!
Here at StockCharts we are fanatical about accuracy. Without accuracy, there would be no reason to use our website. We work hard at it every day. There are two key factors in creating the "cult of accuracy" we have here - first, you need accurate data;...
READ MORE
MEMBERS ONLY

WHO DAT GONNA GET DEM BEARS?

by Tom Bowley,
Chief Market Strategist, EarningsBeats.com
Relax Chicago. You're not in the Super Bowl this year. I'm just applying a little Super Bowl-mania to the current state of the stock market. The bears are calling the plays.
From a sentiment and technical perspective, this market is really making sense right now....
READ MORE
MEMBERS ONLY
MATERIALS AND FINANCIALS BOUNCE OFF 200-DAY LINES
by John Murphy,
Chief Technical Analyst, StockCharts.com
The stock market remains in a downside correction as evidenced by the breaking of initial support levels and negative turns in several longer-term technical indicators (more on that later). Friday's heavy-volume upside reversal, however, suggests that a short-term bottom may have formed from an oversold...
READ MORE
MEMBERS ONLY
CHANGED TO NEUTRAL POSTURE

by Carl Swenlin,
President and Founder, DecisionPoint.com
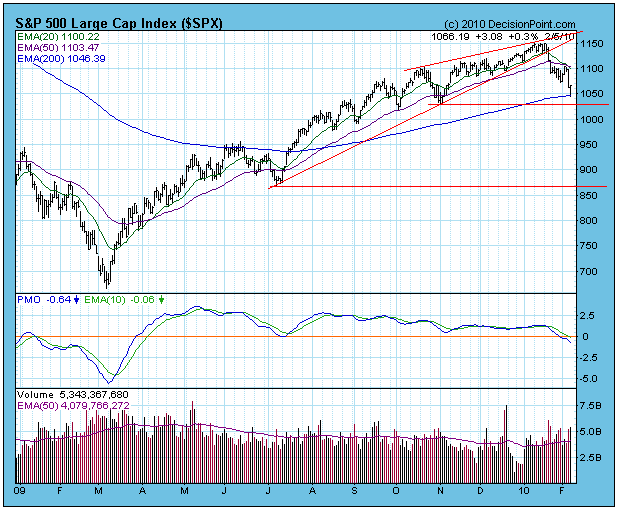
On Thursday our mechanical Thrust/Trend Model changed from a buy to neutral, based upon the 20-EMA crossing down through the 50-EMA. Now our hope is that there will be enough continuing decline to cover what may turn out to be a whipsaw signal. No guarantees in that...
READ MORE
MEMBERS ONLY
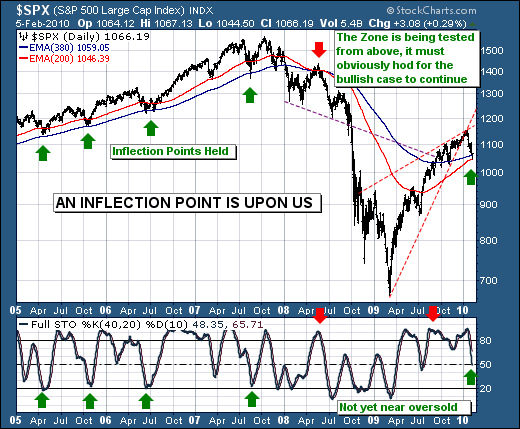
AN INFLECTION POINT IS UPON US

by Richard Rhodes,
Founder and President, Rhodes Capital Management and Rhodes Trading Group
Last week's S&P decline reached a crescendo on Friday around mid-day at 1044.50, which brings the decline to roughly 106 S&P points from the January 19th high at 1150.42. Pencil to paper, and the decline stands at -9.2%, which is...
READ MORE
MEMBERS ONLY

FRIDAY UPSIDE REVERSAL MAY GIVE WAY TO OVERSOLD BOUNCE AS NYSE INDEX BOUNCES OFF NOVEMBER LOW -- MATERIAL AND FINANCIAL SPDRS BOUNCE OFF 200-DAY LINES -- SELL SIGNAL IN NYSE BULLISH PERCENT INDEX, HOWEVER, ARGUES AGAINST QUICK RECOVERY
by John Murphy,
Chief Technical Analyst, StockCharts.com
MATERIALS AND FINANCIALS BOUNCE OFF 200-DAY LINES ... The stock market remains in a downside correction as evidenced by the breaking of initial support levels and negative turns in several longer-term technical indicators (more on that later). Friday's heavy-volume upside reversal, however, suggests that a short-...
READ MORE
MEMBERS ONLY
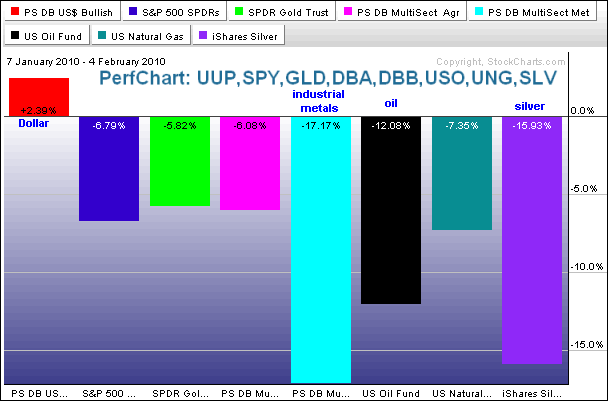
Commodities weighed down by Dollar and stocks
by Arthur Hill,
Chief Technical Strategist, TrendInvestorPro.com
In addition to stock markets around the world, we have seen a rout in various commodity groups over the last 3-4 weeks. Strength in the Dollar is partly to blame. Weakness in global equities also bodes ill for the commodities. A downturn in global equities would imply a future...
READ MORE
MEMBERS ONLY

STOCKS AND DOLLAR CONTINUE INVERSE CORRELATION - CHINA LEADS LOWER WITH BREAKDOWN - GLOBAL INDICES HIT HARD - COMMODITIES AFFECTED BY DOLLAR AND STOCKS - NATURAL GAS FORMS FALLING FLAG
by John Murphy,
Chief Technical Analyst, StockCharts.com
STOCKS AND THE DOLLAR CONTINUE INVERSE CORRELATION... Link for todays video. Maybe this time its different, but the sharp rise in the Dollar could be a big negative for the stock market. The Dollar and the stock market have had an inverse relationship for most of the last two years....
READ MORE
MEMBERS ONLY

A MACD cross for PSA
by Arthur Hill,
Chief Technical Strategist, TrendInvestorPro.com
Public Storage (PSA) came across the Bearish MACD Crossover on the predefined scans page. The chart below shows PSA gapping down and closing weak with high volume. MACD moved from positive territory to negative territory as it crossed back below its signal line.
Click this chart for details...
READ MORE
MEMBERS ONLY

Evidence turns bearish
by Arthur Hill,
Chief Technical Strategist, TrendInvestorPro.com
I started this evidence table in September and the bulk of the evidence was net positive from September to January. Signs of weakness started appearing in the second half of January and the evidence turned net negative this week. To the model's credit, the evidence stayed net positive...
READ MORE
MEMBERS ONLY

SPY gaps and breaks support
by Arthur Hill,
Chief Technical Strategist, TrendInvestorPro.com
The S&P 500 ETF (SPY) failed at short-term resistance and broke medium-term support with a sharp decline on Thursday. A support zone around 108 held up for the prior six days, but wilted with a long red candlestick yesterday. Even though SPY remains above the last...
READ MORE
MEMBERS ONLY

SECTOR AND GLOBAL ROTATION VIEWS ARE PART OF MARKET ANALYSIS -- RECENT ROTATIONS AND MARKET SIGNALS HAVE WARNED OF GLOBAL CORRECTION -- DURING AN INTERMEDIATE DOWNSIDE CORRECTION, SHORT-TERM TRADERS SHOULD BE SELLING BOUNCES NOT BUYING THEM
by John Murphy,
Chief Technical Analyst, StockCharts.com
SECTOR ROTATION STRATEGIES ARE PART OF MARKET ANALYSIS... Given all of the warnings sounded by Arthur Hill and myself since mid-January, I was somewhat surprised at some e-mail messages I received today. One reader accused me of focusing too much on sector rotation strategies and ignoring the broader...
READ MORE
MEMBERS ONLY

SPAIN LEADS GLOBAL SELLOFF AS DEFAULT FEARS GROW IN EUROPE -- COMMODITIES ARE SELLING OFF HARD AS DOLLAR RALLIES -- SO ARE COMMODITY-RELATED STOCKS -- THE ONLY OTHER SAFE HAVENS ARE TREASURIES AND THE YEN
by John Murphy,
Chief Technical Analyst, StockCharts.com
SPAIN SHARES LEAD GLOBAL RETREAT IN STOCKS AND COMMODITIES... Growing fears that some European countries may have trouble financing their deficits is rattling global stock and commodity markets. Those fears started in Greece and have now spread to Spain and Portugal. Chart 1 shows Spain iShares (EWP) tumbling 7% to...
READ MORE
MEMBERS ONLY
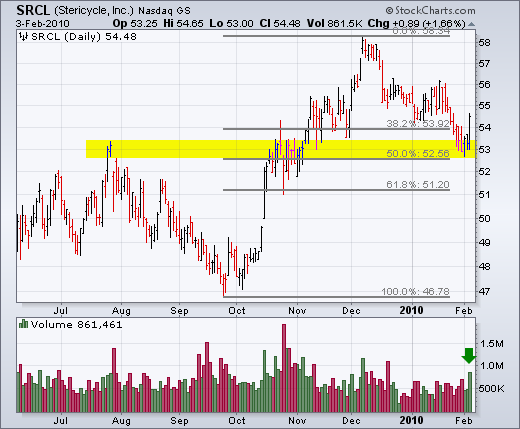
Stericycle bounces off broken resistance
by Arthur Hill,
Chief Technical Strategist, TrendInvestorPro.com
Stericycle (SRCL) broke resistance with a surge last year and returned to broken resistance this year. It looks like broken resistance is turning into support as the stock surged with good volume on Wednesday. Also notice that the Dec-Jan decline retraced 50% of the prior advance.
Click this chart...
READ MORE
MEMBERS ONLY
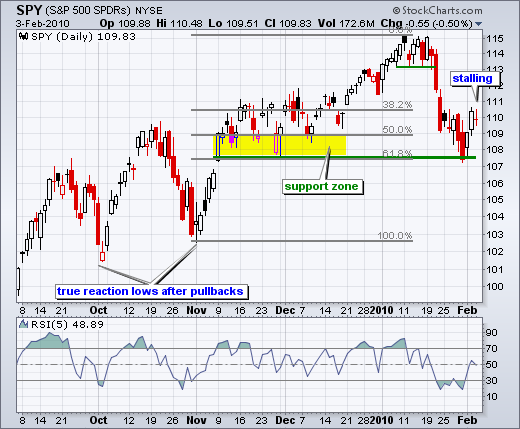
SPY stalls at short-term resistance
by Arthur Hill,
Chief Technical Strategist, TrendInvestorPro.com
SPY surged off support with two good gains on Monday-Tuesday, but ran into short-term resistance on Wednesday and stalled with a doji. The doji looks like a big plus sign (+). With little change from open to close, the horizontal portion is small or just a line. Vertical lines...
READ MORE
