MEMBERS ONLY
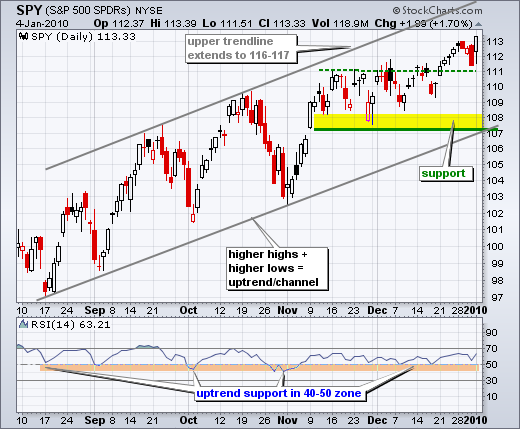
A new high for SPY

by Arthur Hill,
Chief Technical Strategist, TrendInvestorPro.com
With another new 52-week high, SPY affirmed the underlying uptrend. The ETF broke resistance around 111 in late December and this breakout held the first day of 2010. A rising price channel has taken shape over the last five months. I am using the upper trendline extension for an...
READ MORE
MEMBERS ONLY
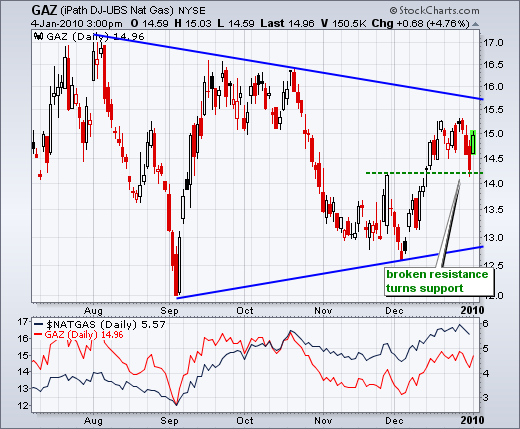
Cold weather lifts Gaz
by Arthur Hill,
Chief Technical Strategist, TrendInvestorPro.com
The iPath Natural Gas ETF ($GAZ) surged over 4% after a cold front slammed the Northeast. On the chart below, notice that GAZ broke resistance in mid December and broken resistance then turned into support.
Click this image for a live chart....
READ MORE
MEMBERS ONLY

BULLS RING IN THE NEW YEAR - DOLLAR HITS RESISTANCE - RISING RATES BOOST THE DOLLAR - GOLD HITS SUPPORT ZONE - OIL SURGES - XLE AND OIH BREAK WEDGE TRENDLINES

by John Murphy,
Chief Technical Analyst, StockCharts.com
BULLS RING IN THE NEW YEAR... Link for todays video. The New Year started the same way the old year ended: bullish. The bulls were out in force early on the first trading day of the year. In early afternoon trading, the broad market indices were all up over 1%...
READ MORE
MEMBERS ONLY
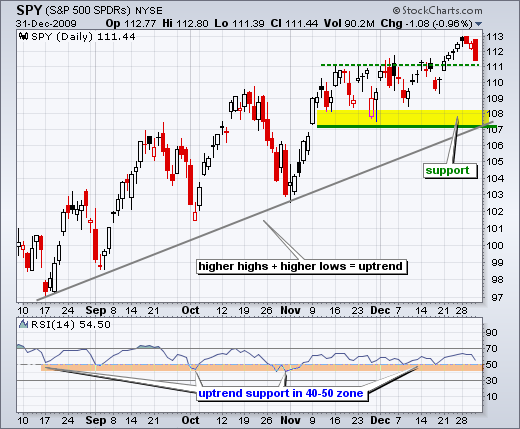
SPY hits first support zone
by Arthur Hill,
Chief Technical Strategist, TrendInvestorPro.com
SPY affirmed its uptrend with a break above consolidation resistance at 111 just before Christmas and a new 52-week high last week. The ETF was holding above 112 on New Year's Eve, but late selling pressure pushed SPY below 111.5 by the close. Even though a...
READ MORE
MEMBERS ONLY
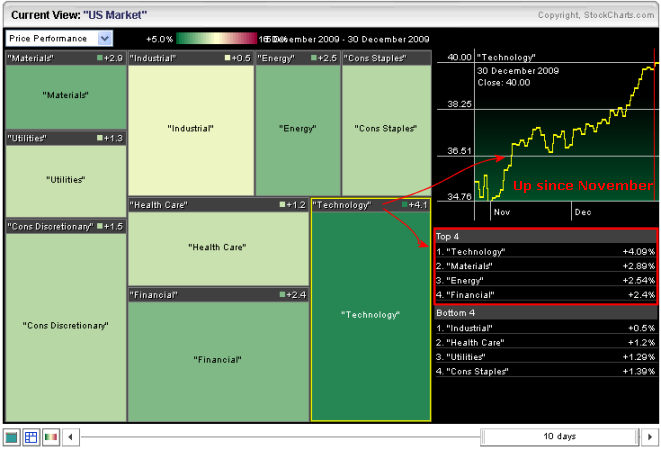
Techs lead the way
by Arthur Hill,
Chief Technical Strategist, TrendInvestorPro.com
The technology sector has led the market higher over the last 10 days. Using the slider at the bottom, the Sector Market Carpet is set to show price performance over the last 10 days. Technology is the greenest of the nine sectors - followed by materials, energy and financials.
Click this...
READ MORE
MEMBERS ONLY
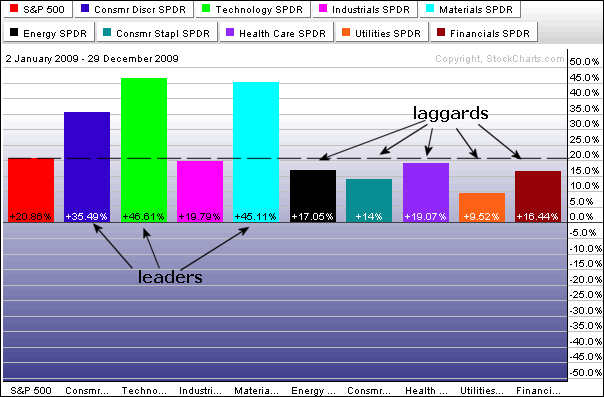
Sector winners for 2009
by Arthur Hill,
Chief Technical Strategist, TrendInvestorPro.com
All sectors were up for the year, but some were up more than others. In fact, of the nine sectors, only three outperformed the S&P 500 over the last 12 months: consumer discretionary, technology and materials. The remaining six sectors were up less than the S&P...
READ MORE
MEMBERS ONLY

3 ITEMS TO WATCH IN 2010 - EMERGING MARKETS AND REITS LEAD 2009 - COMMODITIES DEPENDENT ON THE DOLLAR AND EMERGING MARKETS - RATES SET TO RISE IN 2010 - SHANGHAI COMPOSITE COULD BE LEADING THE S&P 500 - HAPPY NEW YEAR
by John Murphy,
Chief Technical Analyst, StockCharts.com
ITEMS TO WATCH IN 2010... Link for todays video. Todays commentary will feature a few items to watch in 2010. First, I am showing a PerfChart with seven different ETFs representing five different asset classes. This is a good way to watch the intermarket picture unfold as well as the...
READ MORE
MEMBERS ONLY
SPY stalls after 5-day surge
by Arthur Hill,
Chief Technical Strategist, TrendInvestorPro.com
After a five day surge from 110 to 113, the S&P 500 ETF (SPY) took a breather on Tuesday with a small decline. SPY was trading in positive territory in the afternoon, but got hit with a late sell-off that pushed prices into negative territory. A small...
READ MORE
MEMBERS ONLY

DEFINING SANTA CLAUS RALLY -- BEST THREE MONTH SPAN ENDS IN JANUARY -- SECTOR SEASONALITY FAVORS ENERGY -- SEVERAL SECTORS END SEASONAL RUNS DURING JANUARY
by John Murphy,
Chief Technical Analyst, StockCharts.com
WE'RE IN SANTA TIME ... We're right in the middle of the Santa Claus rally and two-thirds of the way through the strongest period of the year for stocks. According to the Stock Traders Almanac, the Santa Claus rally encompasses the last five trading days of...
READ MORE
MEMBERS ONLY

Evidence remains bullish
by Arthur Hill,
Chief Technical Strategist, TrendInvestorPro.com
As the market summary table shows, the bulk of the evidence is firmly bullish. In fact, the Nasdaq AD Line is the only negative out there right now and the table is almost all green. The weight of the evidence has favored the bulls since inception (September). At +11, the...
READ MORE
MEMBERS ONLY
Tuesday video features...
by Arthur Hill,
Chief Technical Strategist, TrendInvestorPro.com
-Evidence remains bullish
-Net New Highs expand in December
-NYSE AD Line hits 52-week high
-Nasdaq AD Volume Line hits 52-week high
-McClellan Oscillators surge above 50
-Bullish Percent Indices move higher
-Volatility indices move to new lows
-Trend and momentum are bullish
-Offensive sectors show strength overall...
READ MORE
MEMBERS ONLY

December is for Dollars
by Arthur Hill,
Chief Technical Strategist, TrendInvestorPro.com
The Perfchart below shows the DB Dollar Bullish ETF (UUP) with nine other currency ETFs. Even though the Dollar is still down for the year, it is up around 4% for December. The Euro and Yen, which represent our two biggest trading partners, are down the most.
Click this chart...
READ MORE
MEMBERS ONLY

Not many sellers out there
by Arthur Hill,
Chief Technical Strategist, TrendInvestorPro.com
There is no change in SPY as the ETF edged higher on Monday. Trading remains thin, but there are still more buyers than sellers out there. Even though low volume levels, overbought conditions and sustainability may be a concern, there can be no turn until selling pressure overcomes buying pressure....
READ MORE
MEMBERS ONLY

Shanghai leading at yearend
by Arthur Hill,
Chief Technical Strategist, TrendInvestorPro.com
Even though year has a few days left, the Shanghai Composite ($SSEC) is one of the top performing indices in 2009. The Perfchart below compares the performance of this Chinese index against six other major indices. The Australian All Ords Index ($AORD) is a distant second and the S&...
READ MORE
MEMBERS ONLY

Intermarket Update: dollar, gold, oil, bonds
by Arthur Hill,
Chief Technical Strategist, TrendInvestorPro.com
-Bonds breakdown as stocks hit new high
-Dollar getting short-term overbought
-Gold finds support near broken resistance
-Oil recovers after early December drop
-Bonds break support with sharp decline
*****************************************************************
Dollar getting short-term overbought
After a big surge the last four weeks, the US Dollar Index ($USD) is short-...
READ MORE
MEMBERS ONLY

A 52-week high for SPY
by Arthur Hill,
Chief Technical Strategist, TrendInvestorPro.com
Stocks moved higher with a classic Santa Claus rally last week and the bulls remain in control. Techs and small-caps led the rally as QQQQ and IWM advanced around 5% in the last five trading days. Though not as strong, the S&P 500 ETF (SPY) advanced over...
READ MORE
MEMBERS ONLY

Glancing at the sectors
by Arthur Hill,
Chief Technical Strategist, TrendInvestorPro.com
The CandleGlance sector page provides an easy means to see all eight Sector SPDRs on one page. One can identify sectors hitting new highs (leading) and sector trading below their prior highs (lagging). CandleGlance groups are also good candlestick spotting.
Click this chart for details...
READ MORE
MEMBERS ONLY

BREADTH LINES HIT NEW HIGHS - BULLISH% STILL FAVORS THE BULLS - NASDAQ OUTPERFORMS NY COMPOSITE - QQQQ FORGES P&F BREAKOUT - SPY ESTABLISHES SUPPORT ON P&F CHART - HAPPY HOLIDAYS!
by John Murphy,
Chief Technical Analyst, StockCharts.com
BREADTH LINES HIT NEW HIGHS... Link for todays video.The Nasdaq AD Volume Line and the NYSE AD Line hit new 52-week highs on Tuesday. New 52-week highs in these breadth stats are bullish for the market overall. Chart 1 shows the Nasdaq AD Volume Line exceeding its...
READ MORE
MEMBERS ONLY

10 Most Active Perfchart
by Arthur Hill,
Chief Technical Strategist, TrendInvestorPro.com
The Free Charting Tools page shows the most active lists on the left side. There is a Perfchart link at the bottom of each list that will show the 10 most actives together. Over the last 200-day days, Ford (F) is the big winner with a gain in excess...
READ MORE
MEMBERS ONLY

Happy Holidays!
by Arthur Hill,
Chief Technical Strategist, TrendInvestorPro.com
There is no change in the short-term or medium-term picture. Updated charts are shown below. The next commentary will be on Monday, December 28th. Happy Holidays!...
READ MORE
MEMBERS ONLY

HOUSING STOCKS JUMP ON STRONG HOME SALES -- HOME DEPOT TESTS 2008 HIGH -- EARLY JANUARY EFFECT PUSHES SMALL CAPS TO NEW HIGHS -- ENERGY, BIOTECH, AND REIT ETFS TURN UP -- SEASONAL FACTORS FAVOR STOCKS THROUGH JANUARY -- VIX HITS NEW 2009 LOW
by John Murphy,
Chief Technical Analyst, StockCharts.com
HOMEBUILDER ETF TURNS BACK UP ... Today's report that November existing home sales exceeded expectations is having a bullish on housing stocks. Chart 1 shows the Homebuilders SPDR (XHB) breaking through a three-month down trendline. The ability of the XHB to stay above its 2009 up trendline is...
READ MORE
MEMBERS ONLY

Dynamic yield curve remains steep
by Arthur Hill,
Chief Technical Strategist, TrendInvestorPro.com
As the dynamic yield curve shows, the Treasury yield curve remains inordinately steep. The 3-month T-Bill Rate ($IRX) is around .50% and the 30-year Treasury Yield ($TYX) is currently around 4.6%. Long-term rates are nine times higher than short-term rates. This means monetary policy...
READ MORE
MEMBERS ONLY
Tuesday video features...
by Arthur Hill,
Chief Technical Strategist, TrendInvestorPro.com
-Six weeks and seven gaps
-Homebuilders on the hot seat
-Retail SPDR breaks triangle
-Oil Service HOLDRs hits resistance
-Charts of Interest
BOOM, CERN, EBAY, EP, GE , GERN, HCBK, ISIL, LSI, QCOM, SVNT
- Click here for the video page...
READ MORE
MEMBERS ONLY
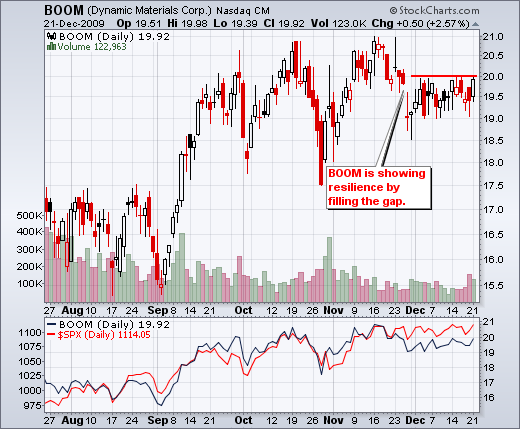
Charts of Interest
by Arthur Hill,
Chief Technical Strategist, TrendInvestorPro.com
boom, cern, ebay, ep, ge , gern, hcbk, isil, lsi, qcom, svnt...
READ MORE
MEMBERS ONLY
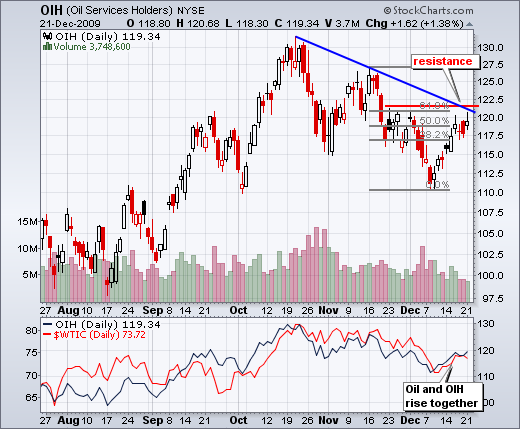
OIH hits resistance
by Arthur Hill,
Chief Technical Strategist, TrendInvestorPro.com
After a rally the last two weeks, the Oil Service HOLDRs (OIH) is bumping up against resistance from the October trendline and the late November highs. Also notice that this bounce retraced around 62% of the decline from mid November to early December. With the ETF starting to stall, traders...
READ MORE
MEMBERS ONLY
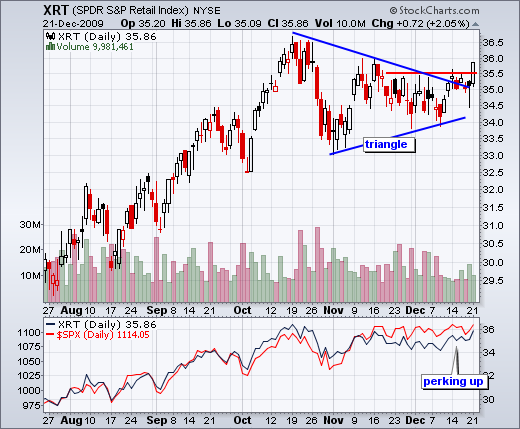
XRT breaks triangle resistance
by Arthur Hill,
Chief Technical Strategist, TrendInvestorPro.com
The Retail SPDR (XRT) is getting into the holiday spirit with a triangle breakout on Monday. The ETF has been lagging the broader market over the last two months. Notice that the S&P 500 is trading near a 52-week high, but XRT remains below its mid October...
READ MORE
MEMBERS ONLY
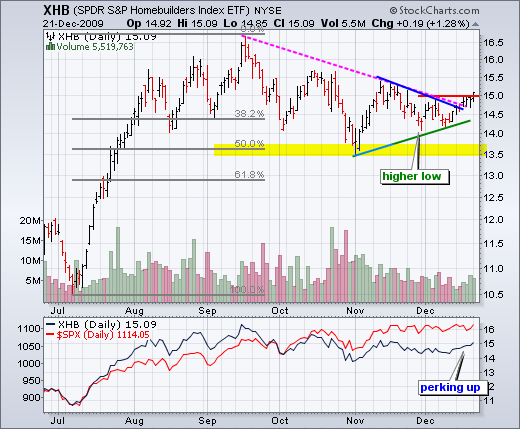
Homebuilders in the spotlight
by Arthur Hill,
Chief Technical Strategist, TrendInvestorPro.com
Homebuilding stocks will be in the spotlight with two upcoming reports. Existing Home Sales will be reported on Tuesday (10 AM ET) and New Home Sales will be released on Wednesday at 10 AM ET). The homebuilding ETFs have been lagging the broader market over the last three months, but...
READ MORE
MEMBERS ONLY
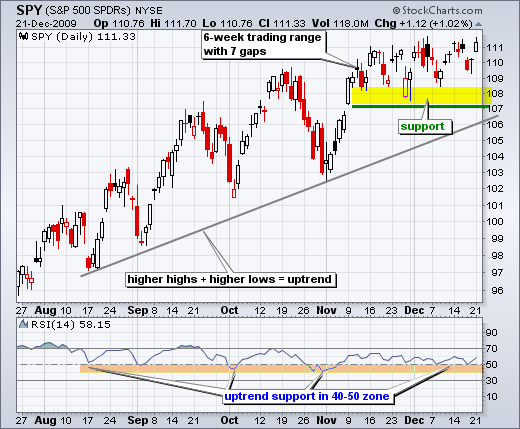
Six weeks and seven gaps
by Arthur Hill,
Chief Technical Strategist, TrendInvestorPro.com
"6 Weeks and 7 Gaps" sounds like the title for a movie with Harrison Ford. SPY moved back to the top of its trading range with a gap up on Monday. Needless to say, there is no change in the medium-term trend (up). With yesterday's...
READ MORE
MEMBERS ONLY

BOND YIELDS SURGE ON GROWTH AND INFLATION FEARS AS INVESTORS FLEE TREASURIES -- BOUNCING DOLLAR KEEPS GOLD AND OIL ON THE DEFENSIVE -- INDUSTRIAL METAL SHARES, HOWEVER, HAVE A STRONG DAY -- SEMICONDUCTORS LEAD NASDAQ MARKET TO NEW HIGH
by John Murphy,
Chief Technical Analyst, StockCharts.com
RECORD YIELD CURVE ... Today's stock buying is coming at the expense of Treasury bonds. Chart 1 shows the T-Bond ETF (TLT) tumbling to the lowest level since August. Chart 2 shows the 10-Year T-Note Yield closing at the highest level since August. [The two charts...
READ MORE
MEMBERS ONLY

Semis lead Nasdaq higher
by Arthur Hill,
Chief Technical Strategist, TrendInvestorPro.com
The Santa Claus rally got off to a good start with the Semiconductors HOLDRS (SMH) leading the way higher. SMH broke flag resistance with a surge over the last two days. Also notice that semis are outperforming the broader market as the price relative moved higher in December.
Click this...
READ MORE
MEMBERS ONLY

Dollar and stocks change it up
by Arthur Hill,
Chief Technical Strategist, TrendInvestorPro.com
-Dollar surges and stocks hold their gains
-Dollar Index hits first resistance zone
-Gold hits trendline and retracement support
-Oil nears resistance from broken support
-Bonds tests very important support zone
The relationship between the Dollar and stock is changing. From March to November, there was a clear inverse relationship...
READ MORE
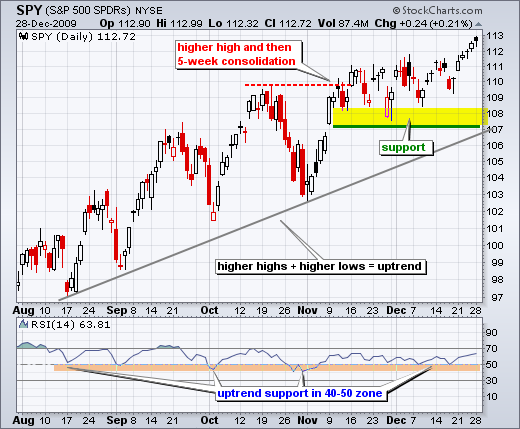
MEMBERS ONLY
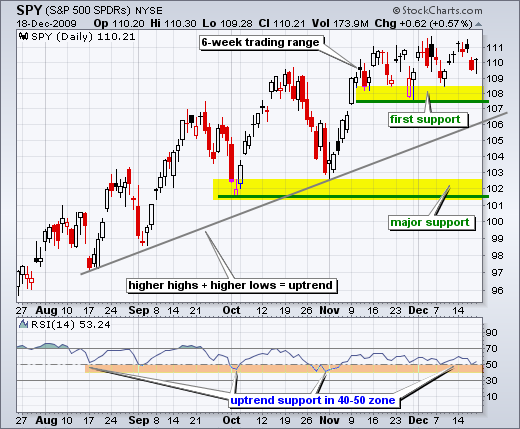
SPY holds range support
by Arthur Hill,
Chief Technical Strategist, TrendInvestorPro.com
Despite a gap down and sharp decline on Thursday, the S&P 500 ETF (SPY) firmed on Friday and remains in the middle of its 6-week trading range. This means there is no change in the medium-term trend (up). SPY moved to a new reaction high in...
READ MORE
MEMBERS ONLY
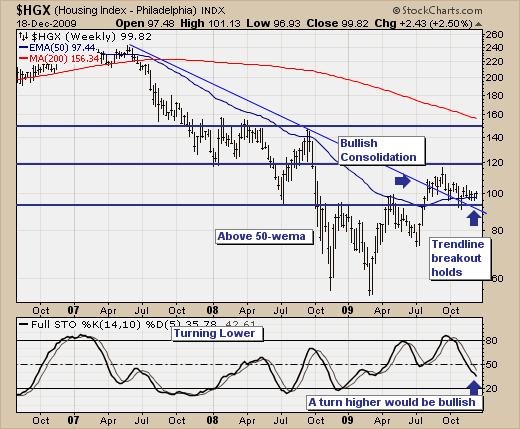
ANOTHER RALLY IN $HGX FUTURE?

by Richard Rhodes,
Founder and President, Rhodes Capital Management and Rhodes Trading Group
We'll be the first to admit that we are bearish on the housing market; and we are bullish on 10-year not yields that will ultimately have a negative impact upon mortgage rates and hence home sales. However, our fundamental backdrop really doesn't square well with...
READ MORE
MEMBERS ONLY
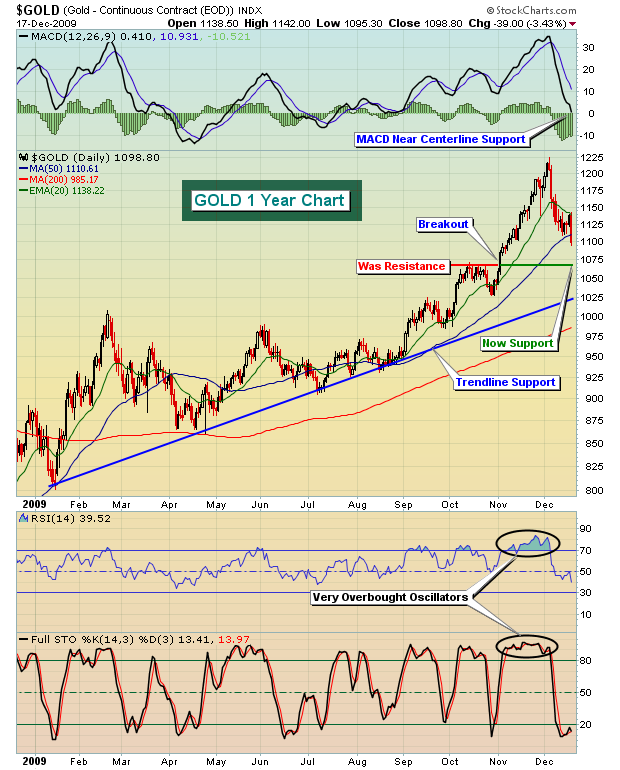
Natural Gas Rising, Gold Falling

by Tom Bowley,
Chief Market Strategist, EarningsBeats.com
In my last article I wrote about the recent disconnect between crude oil and oil services stocks. On a relative basis, oil services stocks had severely underperformed the S&P 500 from mid-October to early December despite crude oil prices trading flat to slightly lower. Since that article,...
READ MORE
MEMBERS ONLY
2009 - THE STOCKCHARTS YEAR IN REVIEW
Happy Holidays Fellow ChartWatchers!
Here we are, once again, at the final ChartWatchers of the year - of the decade(!) in this case. An awful lot has happened at StockCharts.com this year and I wanted to take a moment and review with you all of the changes and improvements that...
READ MORE
MEMBERS ONLY
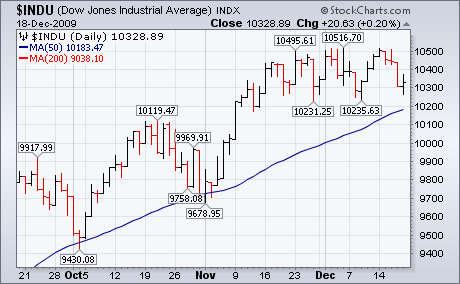
UPTREND IS STILL INTACT
by John Murphy,
Chief Technical Analyst, StockCharts.com
A Friday stock bounce kept major stock indexes stuck in a two-month trading range. Prices also remain above their 50-day averages which keeps the intermediate uptrend intact. Prices, however, remain below long-term resistance barriers near 10,500 in the Dow, 1120 in the S&P 500,...
READ MORE
MEMBERS ONLY
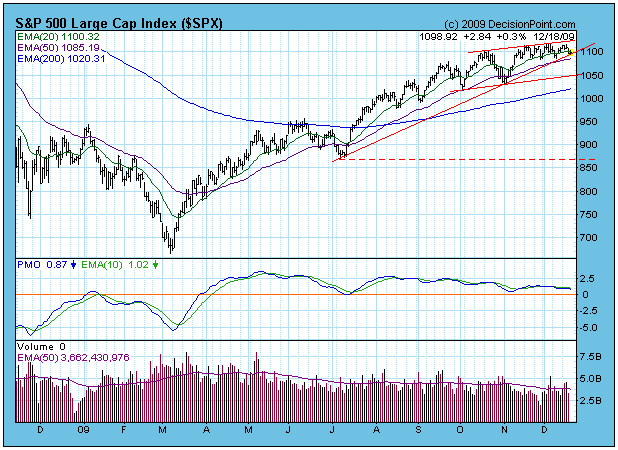
ANALYSIS OF THREE TIME FRAMES

by Carl Swenlin,
President and Founder, DecisionPoint.com
Since this will be our last article for 2009, I thought it would be appropriate to do an analysis of the short-, medium-, and long-term charts and synthesize a broad outlook for the market.
In my December 4 article I said we should expect an upside breakout, but the...
READ MORE
MEMBERS ONLY
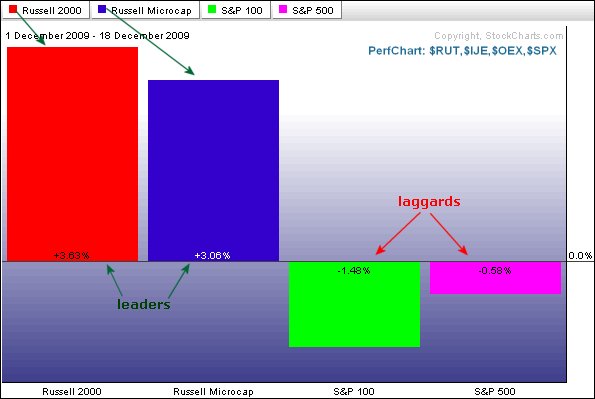
The January effect starts early
by Arthur Hill,
Chief Technical Strategist, TrendInvestorPro.com
According to the Stock Trader's Almanac, the January effect is the historical tendency of small-caps to outperform large-caps from mid December until April. Notice that this period coincides with the bullish six month cycle that extends from November to April. Historically, the strongest period of small-...
READ MORE
MEMBERS ONLY

STOCKS REMAIN IN SHORT-TERM TRADING RANGE -- EURO BOUNCE HELPS STABILIZE GOLD AND OIL -- SEASONAL TRENDS MAY SUPPORT STOCKS THROUGH YEAREND -- TREASURIES LOSE GROUND ON FEARS OF HIGHER RATES IN NEW YEAR
by John Murphy,
Chief Technical Analyst, StockCharts.com
UPTREND IS STILL INTACT ... A Friday stock bounce kept major stock indexes stuck in a two-month trading range. Prices also remain above their 50-day averages which keeps the intermediate uptrend intact. Prices, however, remain below long-term resistance barriers near 10,500 in the Dow, 1120 in the...
READ MORE
MEMBERS ONLY

10-Year Treasury Yield hits resistance
by Arthur Hill,
Chief Technical Strategist, TrendInvestorPro.com
The 10-Year Treasury Yield ($TNX) broke above the August trendline with a surge in December. Because bonds moving opposite of yields, this corresponds to a sharp decline in US Treasury Bonds. The 10-Year Treasury Yield is now meeting resistance from the Sep-Oct-Nov highs and a breakout...
READ MORE
