MEMBERS ONLY
SPY stalls near resistance

by Arthur Hill,
Chief Technical Strategist, TrendInvestorPro.com
The medium-term trend remains up for SPY, but the going is getting tough around 110. The S&P 500 ETF (SPY) first moved above 110 on November 11th, eleven trading days ago. Since first moving above 110, the ETF has seesawed above and below this level at least...
READ MORE
MEMBERS ONLY
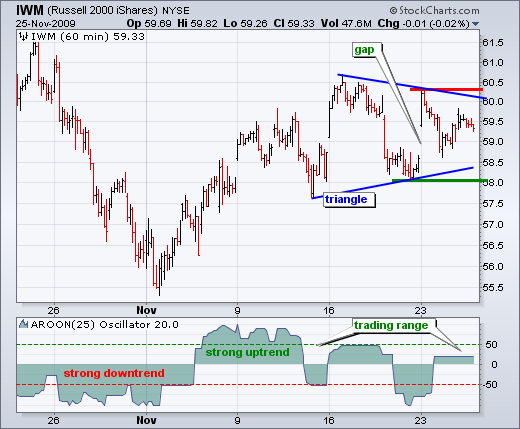
IWM traces out symmetrical triangle
by Arthur Hill,
Chief Technical Strategist, TrendInvestorPro.com
The Russell 2000 ETF (IWM) is stalling with a symmetrical triangle over the last two weeks. Because the prior move was up, there is still a bullish bias overall. However, the ensuing break will determine the next directional signal for IWM. A move above this week's high would...
READ MORE
MEMBERS ONLY
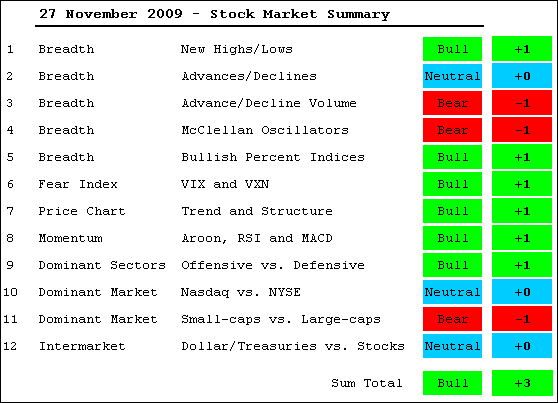
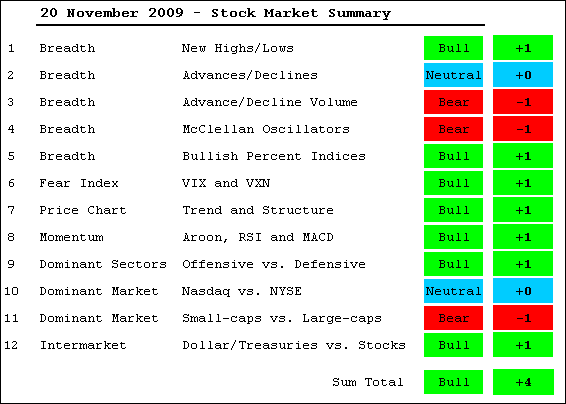
MT Evidence Remains Bullish
by Arthur Hill,
Chief Technical Strategist, TrendInvestorPro.com
Note that current evidence does not include Friday's trading. The S&P 500 is down around 3% in pre-market trading. This move could be an overreaction in thin trading or more. I will review the table and indicators on Monday as well. Despite some bearish indicators...
READ MORE
MEMBERS ONLY
Breadth charts updated
by Arthur Hill,
Chief Technical Strategist, TrendInvestorPro.com
-Nasdaq AD Line forms a bearish flag
-Nasdaq AD Volume Line forms lower high in November (bearish divergence)
-Nasdaq Net New Highs remain positive, but there were fewer in November
-NYSE AD Line remains in bull mode and above support
-NYSE AD Volume Line forms lower high in November (bearish...
READ MORE
MEMBERS ONLY
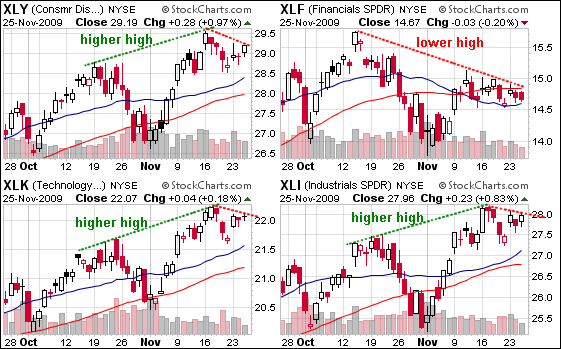
Defensive sectors perking up
by Arthur Hill,
Chief Technical Strategist, TrendInvestorPro.com
The next two Candleglance groups show the four offensive sectors (technology, finance, industrials, technology) and the three defensive sectors (healthcare, utilities, consumer staples). Three of the four offensive sectors moved to new reaction highs in mid November. Only the Financials SPDR failed to exceed its October high and show relative...
READ MORE
MEMBERS ONLY
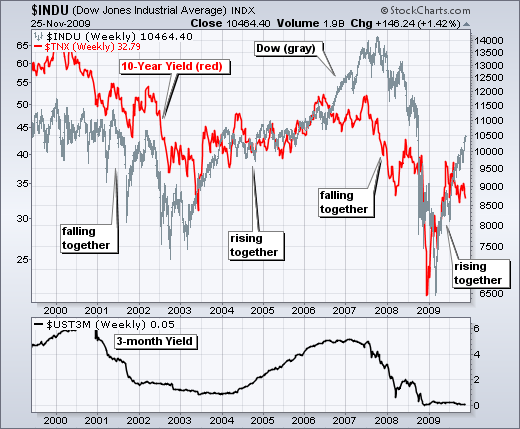
Interest rates and the Dow
by Arthur Hill,
Chief Technical Strategist, TrendInvestorPro.com
Over the last ten years, there is generally a positive correlation between long-term interest rates and the Dow Industrials. The 10-Year Treasury Yield ($TNX) and the Dow fell from 2000 to 2003, rose from 2003 to 2007, fell from 2007 to 2008 and rose in 2009. Falling interest...
READ MORE
MEMBERS ONLY

Bond ETF holds breakout
by Arthur Hill,
Chief Technical Strategist, TrendInvestorPro.com
The 20+ Year Treasury ETF (TLT) continues to exhibit strength with a wedge breakout. Notice that the ETF broke resistance with a gap above 94. More importantly, notice that this gap is holding and TLT moved higher the last two days. With higher lows in July and November, the bigger...
READ MORE
MEMBERS ONLY

FINANCE SECTOR REMAINS A DRAG - BIG BANKS UNDER PRESSURE (JPM, GS, WFC, C, BAC) - EURO HITS A NEW HIGH FOR THE YEAR - GOLD ACCELERATES HIGHER - TIPS MOVING STEP-FOR-STEP WITH GOLD

by John Murphy,
Chief Technical Analyst, StockCharts.com
FINANCE SECTOR REMAINS A DRAG... Link for todays video.While the S&P 500 moved higher the last two weeks, the Financials SPDR (XLF) has remained range bound and continues to underperform the broFinance sector remains a dragader market. Chart 1 shows XLF bouncing off support in early November,...
READ MORE
MEMBERS ONLY

Dollar weakness not helping oil
by Arthur Hill,
Chief Technical Strategist, TrendInvestorPro.com
Despite strength in stocks and weakness in the Dollar, the US Oil Fund ETF (USO) is down for the month of November. It is not much, but it is still surprising and merits attention. Strength in stocks points to strength in the economy, which should increase demand for oil. Commodities...
READ MORE
MEMBERS ONLY

FLR Fails - CIEN Firms
by Arthur Hill,
Chief Technical Strategist, TrendInvestorPro.com
Based on the November 16th close, Fluor (FLR) was featured after the stock bounced on good volume. Even though FLR was still in a downtrend, it was at retracement support and the bounce occurred on good volume. This bounce has now failed. First, follow through was weak the next two...
READ MORE
MEMBERS ONLY

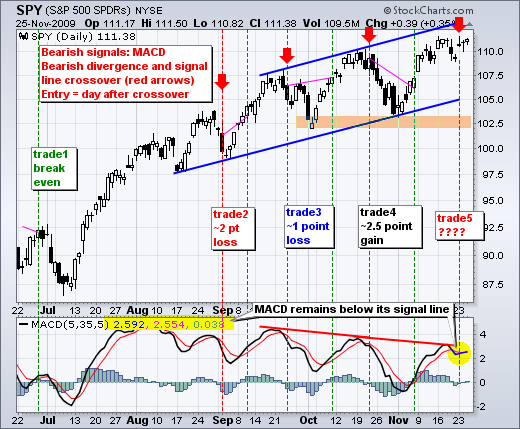
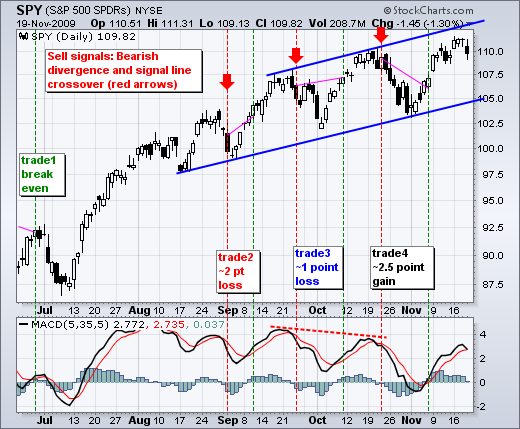
SPY: Upswing within trading range
by Arthur Hill,
Chief Technical Strategist, TrendInvestorPro.com
I am showing three charts for the S&P 500 ETF (SPY) today. The first shows daily candlesticks with MACD(5,35,5). SPY is trending up with higher highs and higher lows, but MACD(5,35,5) is trending down with lower highs and lower lows. Even though...
READ MORE
MEMBERS ONLY

TELECOM HOLDERS BREAKOUT IN MOVE TO DIVIDEND PAYING STOCKS -- AT&T AND VERIZON NEAR BULLISH BREAKOUTS -- ADD TELECOM TO DEFENSIVE FAVORITES ALONG WITH CONSUMER STAPLES AND HEALTHCARE
by John Murphy,
Chief Technical Analyst, StockCharts.com
ANOTHER DEFENSIVE PLAY... One of the main themes I've been showing over the last few weeks has been the rotation toward large-cap stocks in traditionally defensive areas, mainly consumer staples and healthcare. Yesterday, I wrote about a list of top dividend payers (from a weekend Barron'...
READ MORE
MEMBERS ONLY

Energy lagging in November
by Arthur Hill,
Chief Technical Strategist, TrendInvestorPro.com
The sector PerfChart from 30-Oct to 23-Nov shows energy as the weakest of the nine sectors. The shaded S&P 500 tab means performance is measured relative to the S&P 500. The percentage changes are not absolute, but rather over or under performance relative to...
READ MORE
MEMBERS ONLY
Video analysis for Tuesday
by Arthur Hill,
Chief Technical Strategist, TrendInvestorPro.com
-SPY gaps off support
-MACD(5,35,5) crossover signal for SPY
-T-Bill rate near zero again
-Financials SPDR lags overall market
-3 key banks to watch (GS,JPM,STT)
-Gold gets frothy on the daily chart
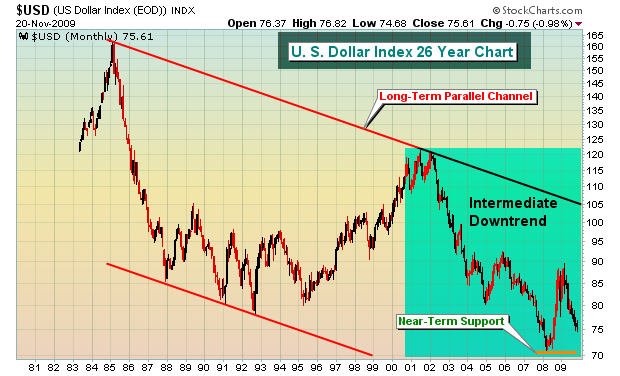
-US Dollar Index remains in downtrend
-Bullish flag in oil extends
-30-...
READ MORE
MEMBERS ONLY
Intermarket chart page updated
by Arthur Hill,
Chief Technical Strategist, TrendInvestorPro.com
Intermarket highlights include:
-Gold continues to lead the intermarket group
-Gold is looking frothy on the daily chart
-Look for a break above 76 to show strength in the Dollar.
-Oil remains with extended flag consolidation
-The long bond broke resistance with a gap-surge
- Click here for intermarket chart...
READ MORE
MEMBERS ONLY
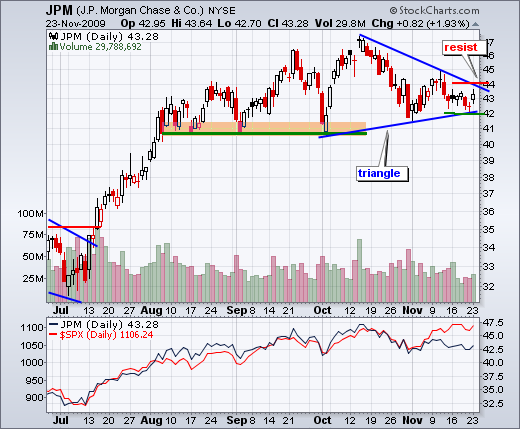
3 Key Banks (GS, JPM, STT)
by Arthur Hill,
Chief Technical Strategist, TrendInvestorPro.com
JP Morgan Chase (JPM) is the biggest holding (12.08%) in the Financials SPDR (XLF). As with XLF, JPM is showing relative weakness as it trades well below its October high. The stock is currently testing support from the triangle trendline extending up from the October low. Trading has been...
READ MORE
MEMBERS ONLY
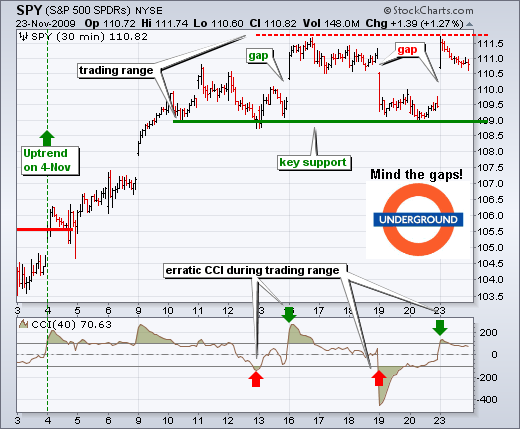
Mind the Gaps
by Arthur Hill,
Chief Technical Strategist, TrendInvestorPro.com
With another gap-surge on Monday, SPY has gapped up the last four Mondays (November 4, 9, 16 and 23). The first three gaps were part of an uptrend, but the fourth occurred within a trading range. Also notice that SPY gapped up-down-up over the last six trading...
READ MORE
MEMBERS ONLY

Why are Tbill rates near zero again?
by Arthur Hill,
Chief Technical Strategist, TrendInvestorPro.com
I featured the 3-month T-Bill Rate ($IRX) near zero last Wednesday and Mark Hulbert wrote about this phenomenon in is commentary for Tuesday. Based on my analysis, low short-term rates reflect Fed policy and put downward pressure on the Dollar. Chicago Fed President Evans suggested no-change...
READ MORE
MEMBERS ONLY

XLF Continues to Lag
by Arthur Hill,
Chief Technical Strategist, TrendInvestorPro.com
While the Dow and S&P 500 moved to new reaction highs in November, the Financials SPDR (XLF) remains well below its October high. XLF is clearly not keeping pace with the broader market. Such relative weakness can foreshadow absolute weakness and a potential break down. XLF surged above...
READ MORE
MEMBERS ONLY

ANOTHER MONDAY JUMP IN STOCKS AND COMMODITIES -- CHEVRON AND EXXON MOBIL SHOW NEW ENERGY LEADERSHIP -- MONEY IS FLOWING INTO LARGE DIVIDEND STOCKS -- VERIZON IS ONE OF THE CHEAPER DIVIDEND PAYERS -- GOLD STOCKS NEAR 2008 HIGH AND MAY BE DUE FOR A BREATHER
by John Murphy,
Chief Technical Analyst, StockCharts.com
EURO UPTREND SUPPORTS STOCKS AND COMMODITIES... As you know, stocks and commodities have been rising most of the year as the U.S. dollar has been dropping. Foreign currencies have also been rising. As a result, a strong positive correlation has existed between the Euro (which has the biggest impact...
READ MORE
MEMBERS ONLY

Wells Fargo shows relative weakness
by Arthur Hill,
Chief Technical Strategist, TrendInvestorPro.com
Even though the S&P 500 is up sharply over the last four weeks, Wells Fargo (WFC) is just flat and shows relative weakness. After a surge the first few days of November, WFC traded flat with a small triangle. Watch this neutral pattern for clues on the future....
READ MORE
MEMBERS ONLY

Flags breaks and MACD crosses
by Arthur Hill,
Chief Technical Strategist, TrendInvestorPro.com
With a little weakness on Friday, SPY broke below flag support on the 30-minute chart and MACD(5,35,5) moved below its signal line on the daily chart. First, let's look at the daily chart. For the fifth time since June, MACD formed a bearish divergence...
READ MORE
MEMBERS ONLY

Holiday Special Starts and Announcing our New Loyalty Rewards Program
Hello Fellow ChartWatchers!
I have two big announcements for you this time around:
OUR HOLIDAY SPECIAL IS NOW ON!
With the holiday season just around the corner, we've fired up our Holiday Special. It's a great way for you to join up or extend your StockCharts....
READ MORE
MEMBERS ONLY
Gold and Silver Bull Market Rages On

by Tom Bowley,
Chief Market Strategist, EarningsBeats.com
While there are lots of questions surrounding the sustainability of the stock market advance, there seems to be little resistance ahead for commodities, specifically gold and silver. The U.S. dollar is the primary variable. As you can see from the charts below, gold and silver seem to have no...
READ MORE
MEMBERS ONLY
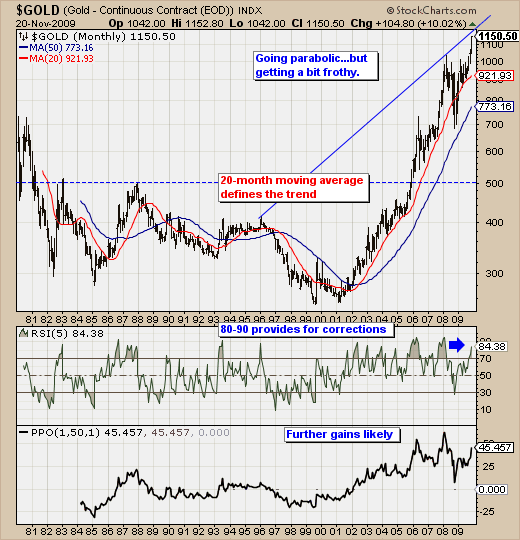
LARGER CORRECTION LOOMING FOR GOLD?

by Richard Rhodes,
Founder and President, Rhodes Capital Management and Rhodes Trading Group
Gold prices are obviously rising, and they are rising rapidly. However, given the move has begun to go parabolic in its 8-year of rally - we have to question how much higher gold prices can go in both the short and intermediate-term. To this end, the monthly charts adds...
READ MORE
MEMBERS ONLY
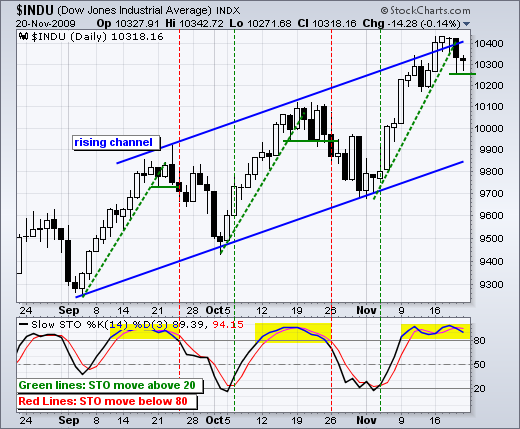
Dow Hits Top of Channel
by Arthur Hill,
Chief Technical Strategist, TrendInvestorPro.com
The Dow has been moving higher the last three months with surges early in the month and pullbacks later in the month. Notice how the Dow bottomed in early September, early October and early November. Also notice how the Dow peaked in mid September and mid October. Here we are...
READ MORE
MEMBERS ONLY
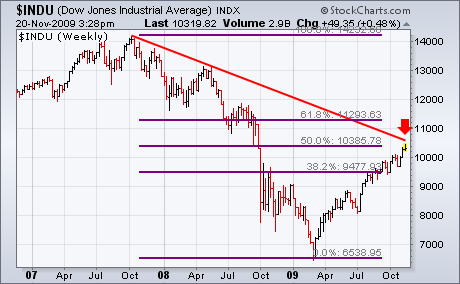
TRENDLINES AND 50% RETRACEMENTS REACHED
by John Murphy,
Chief Technical Analyst, StockCharts.com
The following three charts show the three major U.S. stock indexes having reached formidable overhead resistance barriers. Charts 1 and 2 show the Dow Industrials and the S&P 500 having retraced 50% of their bear market declines. More importantly, both indexes are testing major down trendlines drawn...
READ MORE
MEMBERS ONLY
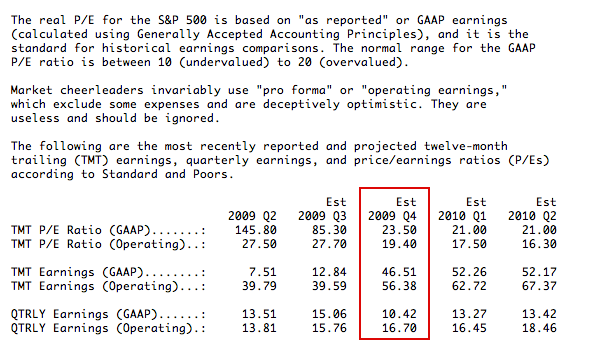
STOCKS STILL OVERVALUED

by Carl Swenlin,
President and Founder, DecisionPoint.com
Stocks have been in the overvalued end of the normal P/E range since the early-1990s, and this condition shows no sign of abating. Below is an excerpt from our daily earnings summary that will offer readers a better perspective. I have outlined the 2009 Q4 results because that...
READ MORE
MEMBERS ONLY

STOCK INDEXES REACH MAJOR RESISTANCE BARRIERS -- SMALL CAPS, FINANCIALS, CHIPS, AND HOMEBUILDERS SHOW RELATIVE WEAKNESS -- LEADERSHIP HAS SWITCHED TO DEFENSIVE CONSUMER STAPLES AND HEALTHCARE
by John Murphy,
Chief Technical Analyst, StockCharts.com
TRENDLINES AND 50% RETRACEMENTS REACHED... The next three charts show the three major U.S. stock indexes having reached formidable overhead resistance barriers. Charts 1 and 2 show the Dow Industrials and the S&P 500 having retraced 50% of their bear market declines. More importantly, both indexes are...
READ MORE
MEMBERS ONLY
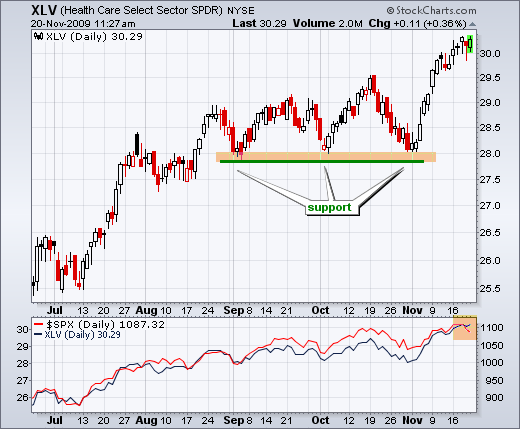
Healthcare showing relative strength
by Arthur Hill,
Chief Technical Strategist, TrendInvestorPro.com
The Healthcare SPDR (XLV) broke above its October high two weeks ago and continued above 30 this week. Even though stocks were weak across the board on Thursday, healthcare managed to show relative strength with a smaller loss. Eight of the nine sectors were down in early trading Friday, but...
READ MORE
MEMBERS ONLY
Video analysis for Friday includes...
by Arthur Hill,
Chief Technical Strategist, TrendInvestorPro.com
-Performance anxiety and seasonality
-The split-month pattern in SPY
-Bear flags on the 30-minute charts
-Medium-term Evidence Remains Bullish
-Breadth is mixed overall
-Bullish% for consumer discretionary sector lags
-VIX forms inverse head-and-shoulders
-SPY momentum remains bullish
-Small-caps continue to lag large-caps
-Short-...
READ MORE
MEMBERS ONLY
Performance anxiety and seasonality
by Arthur Hill,
Chief Technical Strategist, TrendInvestorPro.com
Tops are complicated beasts that usually take time to evolve. Bottoms, on the other hand, form quicker and often feature some sort of quick "V" reversal. Stocks are well off their March lows after a powerful rally the last nine months. The Dow, S&P 500 and...
READ MORE
MEMBERS ONLY
Medium-term evidence remains bullish
by Arthur Hill,
Chief Technical Strategist, TrendInvestorPro.com
The warnings signs continue, but the bulk of the medium-term evidence remains bullish. On the negative side, breadth has been deteriorating the last few weeks. Small-caps and the finance sector have been relatively week since October. Bonds surged this week in what could be a flight to quality...
READ MORE
MEMBERS ONLY
Breadth charts updated
by Arthur Hill,
Chief Technical Strategist, TrendInvestorPro.com
-Nasdaq AD Line forms bear flag and hits resistance
-Nasdaq AD Volume failed to confirm new reaction high in the Nasdaq
-Nasdaq Net New Highs were weaker in November, but still positive overall
-NYSE AD Line bounced off support and remains in bull mode
-NYSE AD Volume line failed to...
READ MORE
MEMBERS ONLY
The split-month pattern in SPY
by Arthur Hill,
Chief Technical Strategist, TrendInvestorPro.com
There is an interesting pattern taking shape on the daily charts of the major index ETFs. In September and October, notice how SPY advanced in the first half of the month and fell in the second half of the month. This is also the case for DIA, IWM and QQQQ....
READ MORE
MEMBERS ONLY

Bear flags on the 30-minute charts
by Arthur Hill,
Chief Technical Strategist, TrendInvestorPro.com
Stocks gapped down and pretty much stayed down on Thursday. After gapping up on Monday, SPY traded flat for three days and then gapped down on Thursday. A little consolidation after Monday's gap is normal, but giving it all back with such a sharp decline is not normal...
READ MORE
MEMBERS ONLY

RUSSELL 2000 TESTS IMPORTANT SUPPORT LEVEL - SEMIS GET HIT WITH DOWNGRADE - INTC AND TXN LEAD SEMIS LOWER -ENERGY PACES SECTORS LOWER - WALMART POWERS RETAIL HOLDRS - RETAIL SPDR FAILS TO EXCEED OCTOBER HIGH
by John Murphy,
Chief Technical Analyst, StockCharts.com
RUSSELL 2000 DECLINES TO IMPORTANT SUPPORT LEVEL... Link for todays video. Small-caps are still lagging the broader market. The Russell 2000 first showed relative weakness as the first of the major index ETFs to break below its early October low. RUT again showed relative weakness in the November rally...
READ MORE
MEMBERS ONLY

An island reversal in MDY
by Arthur Hill,
Chief Technical Strategist, TrendInvestorPro.com
With a gap up on Monday and a gap down on Thursday morning, the S&P 400 MidCap ETF (MDY) has an island reversal working on the 30-minute chart. There were no trades around 127.6, which creates a floating island around 128. Even though this gap is...
READ MORE
MEMBERS ONLY

SPY: Overbought AND Bullish
by Arthur Hill,
Chief Technical Strategist, TrendInvestorPro.com
SPY gapped up and moved above its October high on Monday to affirm the medium-term uptrend with a higher high. The gap is holding as SPY trades comfortably above 110. In addition, the Stochastic Oscillator remains above 80 for the second week. This makes SPY both overbought and bullish....
READ MORE
MEMBERS ONLY

SEASONAL PATTERNS FAVOR THE BULLS - DOW HITS CHANNEL RESISTANCE - SHORT-TERM RATES REMAIN WAY DOWN - LONG-TERM RATES RECOVER - A STEEPER YIELD CURVE - REGIONAL BANKS LAGGING BIG BANKS
by John Murphy,
Chief Technical Analyst, StockCharts.com
SEASONAL PATTERNS FAVOR THE BULLS ... Link for todays video. According to the Stock Traders Almanac, the best six months of the year are from November 1st to April 30th. The Almanac provides a performance table going back to 1950. Being long stock indices for these six months and switching to...
READ MORE
