MEMBERS ONLY

SANDISK SELLOFF WEAKENS CHIP AND TECHNOLOGY STOCKS AND SINKS MARKET'S ATTEMPT TO CLOSE OVER 200-DAY AVERAGE -- SMALL CAPS MAY BE ROLLING OVER AT CHART RESISTANCE -- LOWER BOND YIELDS SUGGEST SOME MONEY MAY START FLOWING BACK INTO BONDS AND GOLD

by John Murphy,
Chief Technical Analyst, StockCharts.com
SANDISK DROP UNDERMINES CHIP ... A big afternoon drop in SanDisk undermined a morning rally in semiconductors. Chip selling spread to the Nasdaq and the rest of the market by the close. Chart 1 shows SanDisk falling -7.5% today on the heaviest volume in a month. By day's...
READ MORE
MEMBERS ONLY
LOOKING A LITTLE TOPPY
I've been bullish since my earlier bottom call in January. There were several reasons for the call, but in particular there were contrarian indicators moving off the charts in the bearish direction. That suggested that the next move in the market would be higher - and it was. After...
READ MORE
MEMBERS ONLY
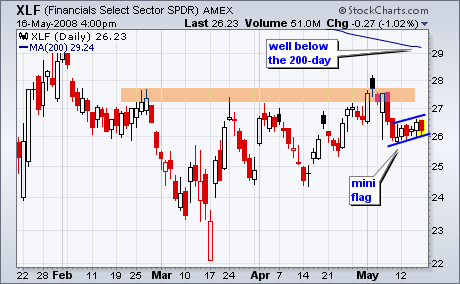
FINANCE AND HEALTHCARE LAG
Money may be moving into Technology, but it is avoiding Finance and Healthcare. While the Dow Industrials ETF and S&P 500 ETF both touched their 200-day moving averages in May, the Finance SPDR (XLF) and the Healthcare SPDR (XLV) fell well short of their 200-day lines....
READ MORE
MEMBERS ONLY
LOOKING BULLISH BUT OVERBOUGHT
Our long-term model remains on a sell signal, so we have to assume that we are still in a bear market; however, the rally from the March lows has taken prices far enough to cause important bullish signs to appear: (1) The intermediate-term model for the S&...
READ MORE
MEMBERS ONLY
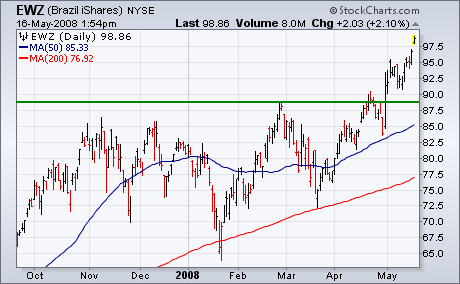
COMMODITY COUNTRIES HIT NEW HIGHS
On Monday, I wrote about three foreign stock markets that were at or close to new record highs. Those three markets are Brazil, Canada, and Russia. What all three have in common was that they are producers and exporters of commodities. By the end of the week, all three markets...
READ MORE
MEMBERS ONLY
ON THE DANGERS OF WEB ACCELERATORS
Last week, we started getting disturbing reports from several users about seeing the wrong name at the top of the page after they logged in to StockCharts.com. That set off HUGE RED WARNING LIGHTS here. We have numerous safeguards in place to make sure that people only see their...
READ MORE
MEMBERS ONLY

BASIC MATERIAL AND ENERGY STOCKS HAVE STRONG DAY AS COMMODITIES RISE -- GOLD ALSO TURNS UP -- COMMODITY EXPORTING COUNTRIES REACH NEW RECORDS -- CONSUMER DISCRETIONARY SPDR IS DAY'S WEAKEST SECTOR AND BACKS OFF FROM 200-DAY LINE
by John Murphy,
Chief Technical Analyst, StockCharts.com
COMMODITY COUNTRIES HIT NEW HIGHS... On Monday, I wrote about three foreign stock markets that were at or close to new record highs. Those three markets are Brazil, Canada, and Russia. What all three have in common was that they are producers and exporters of commodities. By the end of...
READ MORE
MEMBERS ONLY

SEASONAL ADJUSTING DISTORTS APRIL INFLATION NUMBERS -- RISING US RATES ARE STARTING TO BOOST AN OVERSOLD DOLLAR -- THAT COULD CAUSE PROFIT-TAKING IN OVERBOUGHT COMMODITIES
by John Murphy,
Chief Technical Analyst, StockCharts.com
ASK FOR SEASONALLY ADJUSTED GASOLINE ... It seems every central bank in the world is concerned about inflation except ours. I was struck by two conflicting headlines in today's paper. One says "British Bank Chief Expects No Relief From Inflation". The other reads "Price Data Suggests...
READ MORE
MEMBERS ONLY

TECHS GIVE BACK EARLY GAINS -- QQQQ AND MDY LEAD SINCE MARCH -- FINANCE SHOWS RELATIVE WEAKNESS -- SOUTHWEST AIRLINES BUCKS THE TREND -- THE VIX HITS SUPPORT ZONE
by John Murphy,
Chief Technical Analyst, StockCharts.com
TECHS LEAD AFTERNOON RETREAT ... Today's Market Message was written by Arthur Hill. John Murphy will return tomorrow. - Editor
Spurred by a tame reading in the Consumer Price Index (CPI), stocks moved higher in early trading with techs leading the charge. However, a wave of selling pressure hit in...
READ MORE
MEMBERS ONLY

BOND YIELDS CONTINUE TO REBOUND -- RISING INFLATIONARY TRENDS IN ASIA COULD BE SIGNALLING A MAJOR SHIFT TO HIGHER INTEREST RATES
by John Murphy,
Chief Technical Analyst, StockCharts.com
BOND YIELDS ARE CLIMBING ... A few weeks ago I suggested that bond yields could be bottoming. Chart 1 shows that could still be the case. After forming a potential "double bottom" during January and March, the 10-Year T-Note yield is now testing its February high. It&...
READ MORE
MEMBERS ONLY

AUSTRALIA AND CANADA USUALLY BENEFIT FROM RISING COMMODITIES -- THE CANADIAN CASH MARKET IS NEAR A RECORD HIGH -- A WEAK CANADIAN DOLLAR IS CAUSING THE EWC TO LAG BEHIND THE CASH MARKET
by John Murphy,
Chief Technical Analyst, StockCharts.com
CANADA SHARES NEAR OLD HIGH... My earlier Market Message dealing with emerging markets showed two commodity producers -- Brazil and Russia- acting as global leaders (thanks to rising commodities). Two developed countries that also benefit from rising commodities are Australia and Canada. Chart 1 shows the Toronto Index (TSE) nearing a...
READ MORE
MEMBERS ONLY

BIG EMERGING MARKETS AREN'T TRENDING IN THE SAME DIRECTION -- BRAZIL AND RUSSIA ARE RISING WHILE CHINA AND INDIA REMAIN WEAK
by John Murphy,
Chief Technical Analyst, StockCharts.com
EMERGING MARKET ISHARES ARE DOING BETTER... One of our readers asked for a look at how emerging are doing. In general, the answer is okay. Chart 1 shows the MSCI Emerging Markets iShares (EEM) having recently cleared its February high and in a short-term uptrend. The solid line is...
READ MORE
MEMBERS ONLY

FCX NEARS RECORD HIGH -- ALCOA APPEARS TO BE BREAKING OUT -- MATERIALS SPDR NEARS RECORD HIGH ON RISING COMMODITIES-- COMMODITY ETF HITS NEW RECORD WHILE OVERSOLD GOLD IS BOUNCING -- RETAILERS ARE ROLLING OVER
by John Murphy,
Chief Technical Analyst, StockCharts.com
MATERIALS SPDR NEARS RECORD HIGH ... Thanks to the ongoing bull market in commodities, material stocks remain in a leadership role. Today's 1.6% gain has made materials the day's strongest market sector. Chart 1 shows the Materials Sector SPDR (XLB) having recently broken above a neckline...
READ MORE
MEMBERS ONLY

FINANCIALS DRAG DOW DOWN -- QQQQ PULLS BACK FROM RESISTANCE -- HOMEBUILDER ETF SHOWS RELATIVE WEAKNESS -- PULTE LEADS LOWER -- USING STOCHRSI WITH THE MARKET CARPET
by John Murphy,
Chief Technical Analyst, StockCharts.com
FINANCE SECTOR LEADS MARKET LOWER... Today's Market Message was written by Arthur Hill. John Murphy will return tomorrow. - Editor
Led by weakness in technology and financials, the stock market moved sharply lower on Wednesday. All of the major indices were down well over 1% with the Dow dropping...
READ MORE
MEMBERS ONLY

THE DOW AND NYSE COMPOSITE INDEXES ARE BACKING OFF FROM 200-DAY AVERAGES -- SO ARE SOME KEY GROUP INDEXES -- RISING COMMODITIES MAY LIMIT PROFIT POTENTIAL IN BONDS
by John Murphy,
Chief Technical Analyst, StockCharts.com
FINANCIALS AND RETAILERS IN PARTICULAR... During the recent market rally, one of the resistance lines that we've been watching especially closely is the 200-day moving average. While that long-term line is a support line during bull markets, it's usually a resistance barrier during bear...
READ MORE
MEMBERS ONLY

PRECIOUS METALS ARE OVERSOLD AND BOUNCING -- STOCKS ARE TESTING SOME IMPORTANT RESISTANCE BARRIERS -- ANY SELLING FROM HERE COULD BOOST BONDS, WEAKEN THE DOLLAR, AND HELP GOLD
by John Murphy,
Chief Technical Analyst, StockCharts.com
OVERSOLD PRECIOUS METALS STARTING TO BOUNCE ... Precious metals are starting to bounce from an oversold condition and potential chart support. Chart 1 shows the streetTracks Gold ETF (GLD) starting to bounce off potential chart support along its November 2007 high (horizontal line). Its 9-day RSI line (bottom of chart)...
READ MORE
MEMBERS ONLY
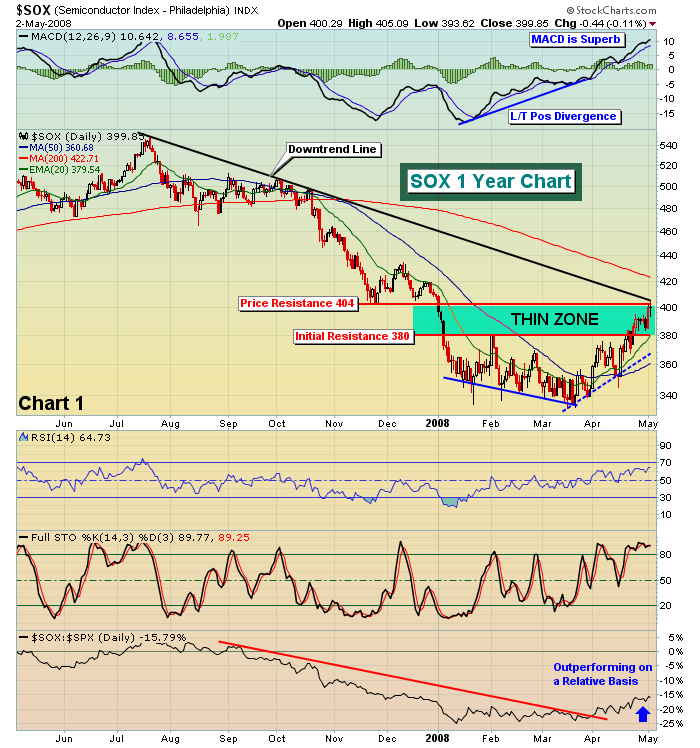
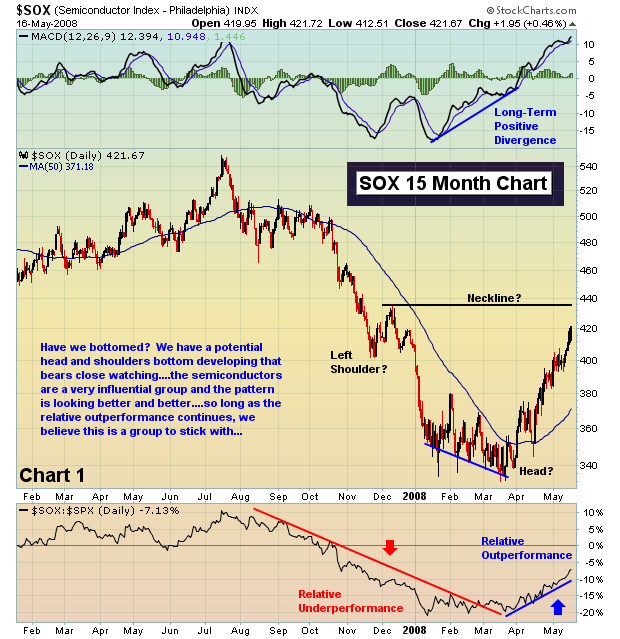
SEMICONDUCTORS AND FINANCIALS HELPING TO LEAD TURNAROUND
It's been a long time since we've spoken about semiconductors or financials in a positive light. But times have changed and so have the charts for these two influential groups. Semiconductors are showing clear relative outperformance, but have now reached a critical resistance area. Check out...
READ MORE
MEMBERS ONLY
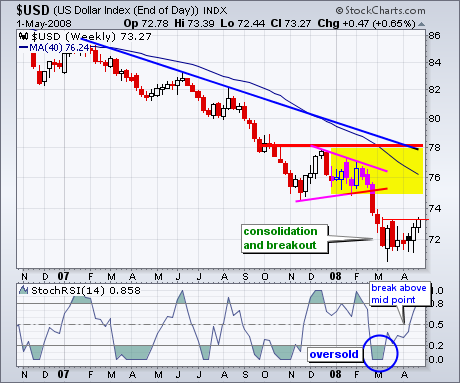
U.S. DOLLAR INDEX GETS A BOUNCE
The U.S. Dollar Index ($USD) remains in a long-term downtrend, but the index is showing signs of strength with a consolidation breakout this week. After becoming oversold in March, the index firmed for 6-7 weeks and surged above its mid March highs this week. StochRSI moved below...
READ MORE
MEMBERS ONLY
SIX-MONTH UNFAVORABLE SEASONALITY PERIOD BEGINS
Something you will be hearing a lot about for a while is that for the next six months the market will be carrying extra drag caused by negative seasonality. Research published by Yale Hirsch in the "Trader's Almanac" shows that the market year is broken into...
READ MORE
MEMBERS ONLY
"ROLLING CORRECTIONS" BENEATH THE SURFACE
It is rather clear there are ongoing "rolling corrections" beneath the surface in today's markets. In terms of performance, whether one is bullish or bearish on the broader market hasn't made as much of a difference as we would have thought. But understanding where...
READ MORE
MEMBERS ONLY
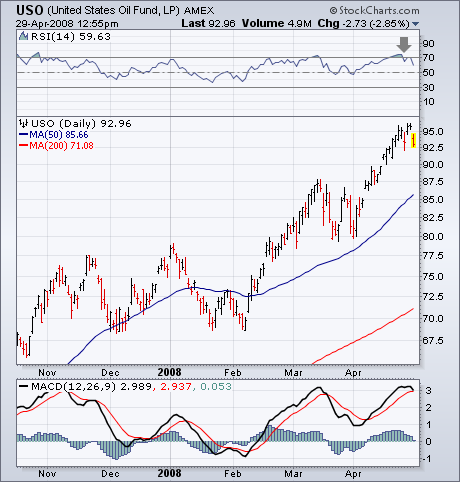
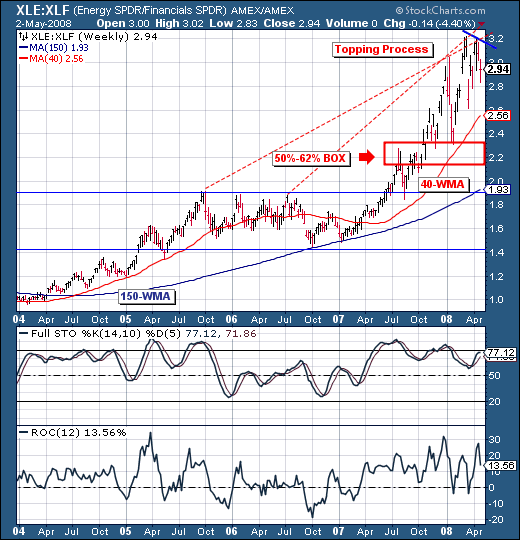
CRUDE AND NATURAL GAS LOOK OVERBOUGHT
When only one commodity group is hitting new highs, that's usually a sign that it's out of step with the others. That seems to be the case with energy. I still believe that the energy complex is due for some profit-taking. Chart 1 shows the...
READ MORE
MEMBERS ONLY
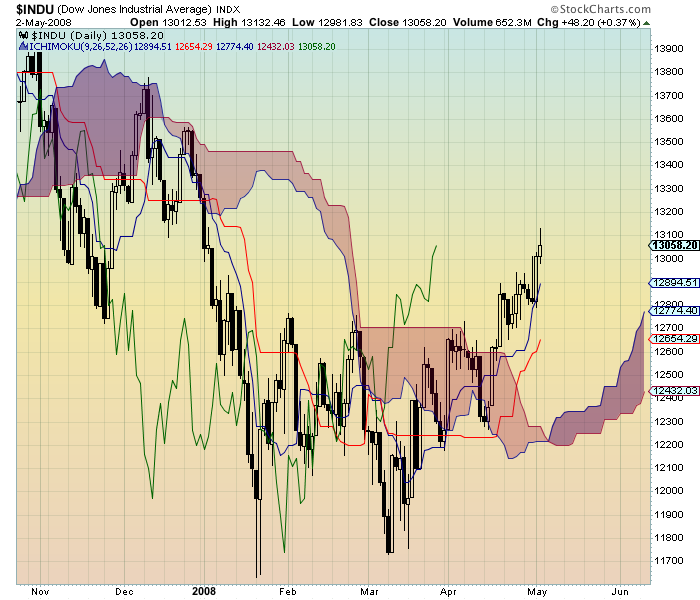
CLOUDS GATHERING ON THE HORIZON
Clouds are gathering on your charting radar - can you see them? No, no - I'm not talking about the recent bad news on the US economy or the price of oil or any of that stuff. I'm talking about another new kind of chart that StockCharts.com...
READ MORE
MEMBERS ONLY

COMMODITY MONEY FLOWS INTO CONSUMER DISCRETIONARY STOCKS, FINANCIALS, AND TECHS -- S&P 500 HITS THREE-MONTH HIGH
by John Murphy,
Chief Technical Analyst, StockCharts.com
COMMODITY CORRECTION CONTINUES ... The combination of a rising stock market and a bouncing dollar is continuing the recent rotation out of an overbought commodity group. The streetTracks Gold Trust (GLD) hit a four-month low and appears headed toward its 200-day moving averagae (Chart 1). Most other commodities sold...
READ MORE
MEMBERS ONLY

BONDS SURGE ON FED STATMENT -- STOCKS GIVE BACK EARLY GAINS -- DIA HITS RESISTANCE -- CONSUMER DISCRETIONARY SPDR FORMS BEARISH ENGLUFING -- USING STOCHRSI -- ENERGY SPDR BECOMES OVERSOLD
by John Murphy,
Chief Technical Analyst, StockCharts.com
FED CUTS RATES ... Today's Market Message was written by Arthur Hill. John Murphy will return tomorrow. - Editor
The Fed cut the federal funds rate and the discount rate by 0.25% each. This is the seventh cut in the federal funds rate since September. At 2%, this key...
READ MORE
MEMBERS ONLY

COMMODITY CORRRECTION CONTINUES -- EVEN ENERGY LOOKS DUE FOR A PULLBACK -- AGRICULTURAL STOCKS LOSE GROUND -- COMMODITIES MAY BE ANTICIPATING FED SHIFT BACK TO FIGHTING INFLATION
by John Murphy,
Chief Technical Analyst, StockCharts.com
MOST COMMODITIES ARE IN CORRECTIONS... Last Thursday I showed most of the charts shown below to make the point that, outside of energy, most other commodity markets have entered downside corrections. I attributed the reasons for that to be rising U.S. rates, a bouncing dollar, and economic slowing. Here&...
READ MORE
MEMBERS ONLY

MAJOR MARKET INDEXES ARE STILL BELOW THEIR 80-WEEK (OR 400-DAY) MOVING AVERAGE -- THAT MAKES THIS A BEAR MARKET BOUNCE -- MICROSOFT WEIGHS ON OVERBOUGHT NASDAQ 100 INDEX
by John Murphy,
Chief Technical Analyst, StockCharts.com
WHERE IS 80-WEEK AVERAGE ... One of our readers asked where the 80-week moving average was located on the major market indexes. Charts 1 through 4 show where its daily version (400-day average) is located. The Dow and the NYSE Composite Indexes are right up against that major...
READ MORE
MEMBERS ONLY

RISING BOND YIELDS GIVE DOLLAR A BOOST -- MOST COMMODITIES ARE ALREADY IN DOWNSIDE CORRECTIONS -- OIL MAY BE NEXT -- SEMICONDUCTORS RESUME 2008 UPTURN -- DOW AND NASDAQ 100 NEAR TEST OF 200-DAY AVERAGE
by John Murphy,
Chief Technical Analyst, StockCharts.com
DOLLAR STARTS TO BOUNCE ... On Tuesday, I showed that the pullback in gold started in mid-March just as bond yields (and the stock market) were starting to bounce. There are three reasons why gold is pulling back at this point. One is that money has been flowing back into...
READ MORE
MEMBERS ONLY

MONTHLY CANDLES FOR THE S&P 500 -- LONG-TERM BREADTH REMAINS BEARISH -- DEFINING A COUNTER TREND RALLY -- AMAZON AND APPLE REACH KEY RETRACEMENTS
by John Murphy,
Chief Technical Analyst, StockCharts.com
LONG-TERM OUTLOOK FOR THE S&P 500 ... Today's Market Message was written by Arthur Hill. John Murphy will return tomorrow. - Editor
In yesterday's commentary, John Murphy showed how the difference between two long-term moving averages can help determine the long-term trend. I...
READ MORE
MEMBERS ONLY

UNTIL PROVEN OTHERWISE, THIS IS STILL A BEAR MARKET BOUNCE -- RISING BOND YIELDS AND STOCKS HAVE PULLED SOME MONEY OUT OF GOLD
by John Murphy,
Chief Technical Analyst, StockCharts.com
STILL A BEAR MARKET BOUNCE... I've been surprised at the number of questions asking whether the recent stock rebound is the start of a new bull market or just a bear market rebound. In my view, this is still a bear market rebound. The only question in my...
READ MORE
MEMBERS ONLY

SMALL CAPS LEAD MARKET DROP -- BONDS BOUNCE AS STOCKS PULLBACK FROM TOP OF TRADING RANGE -- TEXAS INSTRUMENTS WEIGHTS ON SEMICONDUCTOR HOLDERS -- OIL AND OIL STOCKS STILL RALLYING
by John Murphy,
Chief Technical Analyst, StockCharts.com
RUSSELL 2000 SHOWS RELATIVE WEAKNESS... One of the factors aiding the recent market rebound was a simultaneous rebound in small cap stocks. That small cap support appears to be diminishing. Chart 1 shows the Russell 2000 Small Cap Index (RUT) backing off from the top of its three-month trading...
READ MORE
MEMBERS ONLY
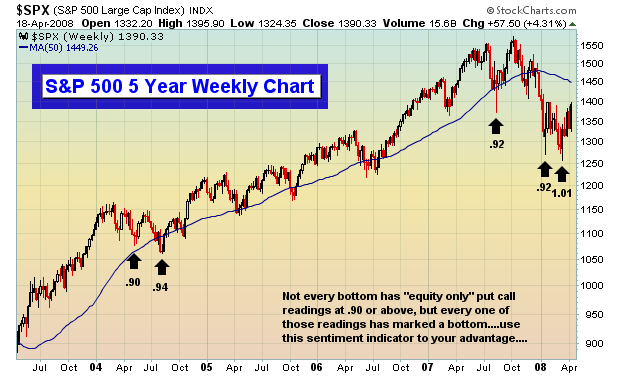
THE GAME HAS CHANGED
In the February 3rd edition of ChartWatchers, I made a bold prediction that the market had bottomed with the January lows. I did so because of the extreme pessimism in the options world. If you go back to 1995, the year that the Chicago Board Options Exchange began providing investors...
READ MORE
MEMBERS ONLY
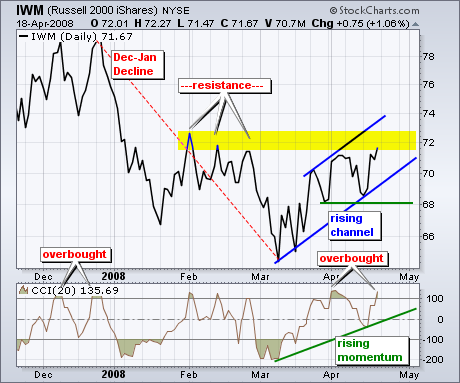
IMW VENTURES INTO RESISTANCE ZONE
Despite a big advance over the last few weeks, the Russell 2000 ETF (IWM) entered a resistance zone and has become overbought. There are two reasons to expect resistance around 72. First, the three February highs mark resistance in this area. Second, a 50% retracement of the December-January decline...
READ MORE
MEMBERS ONLY
SUSPICIOUS GAPS
On Wednesday and Friday of this week the market opened up with large gaps from the previous closing price, and I think this activity is suspicious, possibly contrived. It is, after all, options expiration week, and weird market action can be expected. This week it is likely that the big...
READ MORE
MEMBERS ONLY
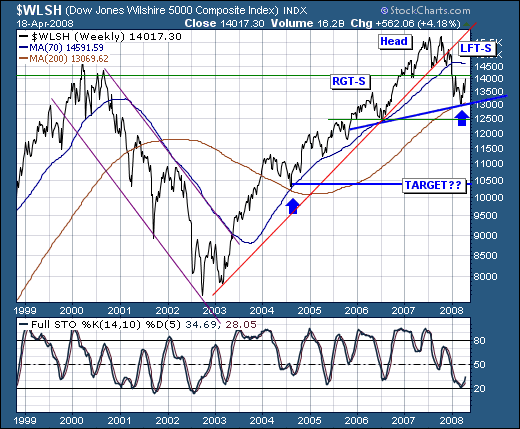
STORM ON THE HORIZON
The intermediate-term broader market technical condition is improving; however, we believe that this "improvement" is nothing more than a respite before the larger storm develops. First, let's note that the Wilshire 5000 has broken its bull market trendline off its 2003-2006 lows, and remains...
READ MORE
MEMBERS ONLY
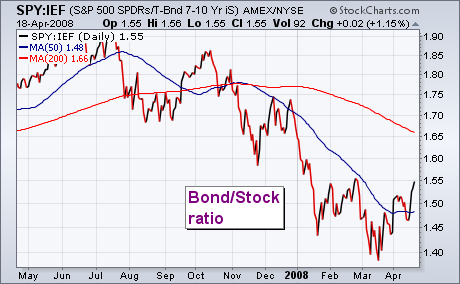
PENDULUM SWINGS BACK TO STOCKS
This week's market action has been characterized by stock buying and bond selling. The change in the relationship between those two markets is shown in the chart below which plots a ratio of the 7-10 Year Treasury Bond Fund (IEF) by the S&P 500 SPDRS...
READ MORE
MEMBERS ONLY
KAGI AND RENKO CHARTS COME TO TOWN
StockCharts.com is pleased to announce that we have just added Kagi and Renko charting formats to our site. Go. Check em out.
Hmmm... Why are you still here? Oh, right. Not everyone knows what Kagi and Renko charts are. Well, lemme show you what a Kagi chart looks like...
READ MORE
MEMBERS ONLY

RAILS RIDE THE AGRICULATURAL TRAIN -- ALL FOUR RAIL STOCKS ARE TRADING AT RECORD HIGHS -- INVESTORS ROTATE FROM BONDS TO STOCKS -- S&P 500 TESTS TOP OF THREE-MONTH TRADING RANGE
by John Murphy,
Chief Technical Analyst, StockCharts.com
DOW TRANSPORTS HIT EIGHT-MONTH HIGH ... We've pointed several times the relatively strong performance in transportation stocks. Today's 2% gain pushed the Dow Transports to the highest level since last August (Chart 1). The relative strength ratio (below chart) has been rising strongly since January. That...
READ MORE
MEMBERS ONLY

STOCK INDEXES CHALLENGE TOP OF THREE-MONTH TRADING RANGE -- FRIDAY RALLY LED BY FINANCIALS AND TECHNOLOGY -- RISING BOND YIELDS BOOST DOLLAR AS COMMODITIES SLIDE
by John Murphy,
Chief Technical Analyst, StockCharts.com
GOOGLE SPARKS INTERNET BREAKOUT... The major market indexes are testing the top of their three-month trading range (Chart 1). Today's stock gains are being led by financial and technology stocks. A 17% jump in Google is pushing the Interactive Internet Index to a three-month high (Chart...
READ MORE
MEMBERS ONLY

BOND YIELDS ARE BOUNCING -- SOME MONEY MOVING OUT OF BONDS IS FLOWING BACK INTO STOCKS -- S&P 500 NEARS TOP OF TRADING RANGE -- VIX DOWNTURN GIVES STOCKS A BOOST -- IBM CLEARS 2002 PEAK
by John Murphy,
Chief Technical Analyst, StockCharts.com
RISING YIELDS MAY DRIVE SOME MONEY BACK TO STOCKS ... On Tuesday, I wrote about bond yields being in oversold territory and near chart support at their 2003 lows. I also showed that the 10-Year T-Note price was overbought and up against resistance at its 2003 peak. I suggested...
READ MORE
MEMBERS ONLY

NASDAQ SURGES HIGHER -- NY COMPOSITE HOLDS APRIL BREAKOUT -- MATERIALS SECTOR LEADS THE WAY -- ENERGY SECTOR HITS NEW HIGH -- US STEEL, FREEPORT MCMORAN, DUPONT AND MONSANTO SHOW STRENGTH
by John Murphy,
Chief Technical Analyst, StockCharts.com
BROAD RALLY LIFTS WALL STREET ... Today's Market Message was written by Arthur Hill. John Murphy will return tomorrow. - Editor
Spurred by positive news from Intel (INTC), JP Morgan (JPM) and Wells Fargo (WFC), stocks surged on Wednesday. The NY Composite and the Nasdaq were both up over 2....
READ MORE
