MEMBERS ONLY
TRANSPORTS FALL FROM RESISTANCE
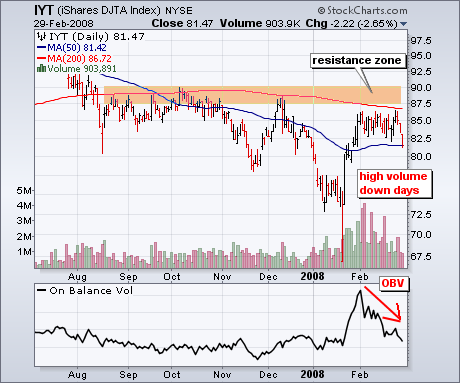
The Transport iShares (IYT) is an ETF designed to match the performance of the Dow Jones Transportation Average. The key industry groups include airlines, railroads, truckers and air freight, all of which are quite sensitive to the overall economy.
After surging in January, the ETF met stiff resistance in February...
READ MORE
MEMBERS ONLY
WHIPSAW!
All mechanical models have weaknesses, and our Thrust/Trend Model is no exception - it is vulnerable to whipsaw. Whipsaw occurs when the market moves just enough in one direction to trip the signal triggers in the model, then it reverses direction and moves just far enough to trigger a reverse...
READ MORE
MEMBERS ONLY

US CLEARLY IN BEAR MARKET
As the credit crisis continues to unfold in rather negative fashion; many believe that the US economy will not enter into a recession, and many believe that if we do enter into a recession - that it is likely to be short-lived and shallow. We'd beg to differ...
READ MORE
MEMBERS ONLY
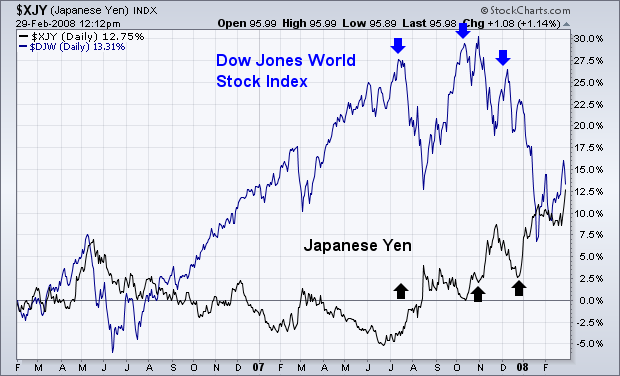
WHY A RISING YEN ISN'T GOOD FOR STOCKS
I first started writing about the danger posed to global stocks last summer when the yen first started rising. I also wrote that was because a rising yen was part of the unwinding of the so-called "yen carry trade". Over the last few years, global traders had...
READ MORE
MEMBERS ONLY
BLOOD ON THE CARPETS
Hello Fellow ChartWatchers!
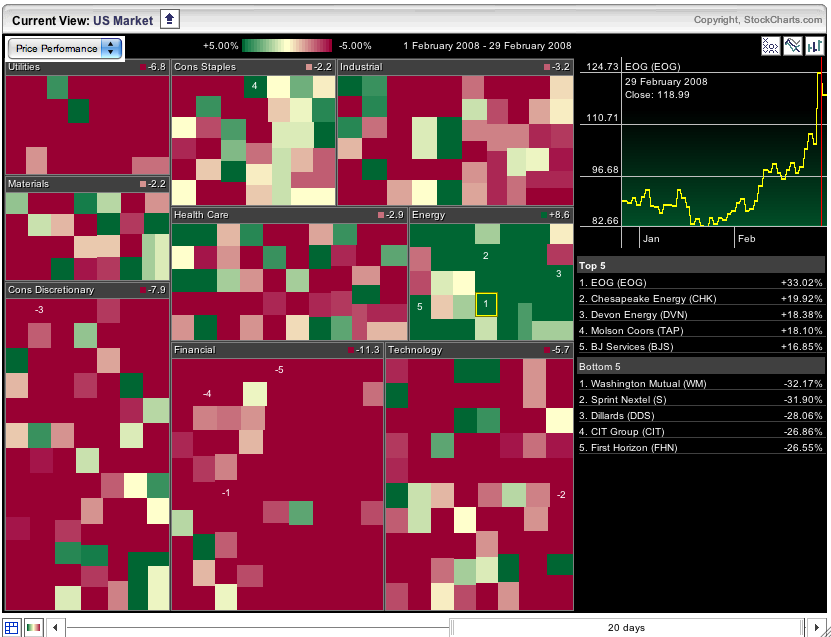
Sorry for the ghastly title to this article, but the charts are rather ghastly as the moment and - as the image below shows - the damage is widespread:
That is a snapshot of our S&P Sector Market Carpet right now. Each stock in the carpet is...
READ MORE
MEMBERS ONLY

MARKET DOWNTREND APPEARS TO BE RESUMING -- NEXT DOWNSIDE S&P TARGET IS LOW FORMED DURING SUMMER OF 2006 -- TIPS LEAD STRONG BOND RALLY -- YEN ETF OFFERS PROFIT PROTECTION AGAINST A FALLING DOLLAR AND FALLING STOCKS

by John Murphy,
Chief Technical Analyst, StockCharts.com
MARKET DROPS ON EXPANDING VOLUME ... I suggested on Thursday that this was a logical spot for the market rally to fail and fail it did. The fact that Friday's big selloff came on expanding volume (and bad market breadth) just added to the degree of short-term damage...
READ MORE
MEMBERS ONLY

JAPANESE YEN IS EMERGING AS ONE OF WORLD'S STRONGEST CURRENCIES -- THAT SUGGESTS FURTHER UNWINDING OF THE YEN CARRY TRADE AND IS HURTING GLOBAL STOCK MARKETS
by John Murphy,
Chief Technical Analyst, StockCharts.com
YEN MAY BE NEARING HUGE BULLISH BREAKOUT... One of the day's headlines is the Japanese yen hitting a new three-year high against the U.S. Dollar. Last summer, I started reporting on the emerging new uptrend in the Japanese currency. That uptrend may be about to get...
READ MORE
MEMBERS ONLY

WEAK ECONOMIC NEWS BOOSTS BONDS BUT SINKS STOCKS -- BOND/STOCK RATIO STILL FAVORS BONDS -- THE DOLLAR FALLS TO A RECORD LOW AS COMMODITIES HIT RECORD HIGH -- CONTINUED FED EASING SUGGESTS THOSE TWO TRENDS WILL CONTINUE
by John Murphy,
Chief Technical Analyst, StockCharts.com
BOND YIELDS FALL AS COMMODITIES RISE ... More bad news on the economy triggered a reasonably predictable intermarket script. Bond prices jumped sharply as yields fell. Chart 1 shows the 10-Year T-Note Yield failing a test of a resistance line drawn over its October/December highs. While that was...
READ MORE
MEMBERS ONLY

WEAK GDP FIGURE BOOSTS BONDS AND SINKS STOCKS -- DROP IN RATES PUSHES DOLLAR TO RECORD LOW AND COMMODITIES TO RECORD HIGH
by John Murphy,
Chief Technical Analyst, StockCharts.com
WEAK ECONOMIC NEWS FAVORS BONDS OVER STOCKS... On Tuesday, I wrote about the fact that bonds were pulling back to test their 50-day "support" line, while the Dow and S&P 500 were bouncing toward their 50-day "resistance" line. I also suggested that...
READ MORE
MEMBERS ONLY

TECHS LAGGING THE BROADER MARKET -- DOW STALLS AT RESISTANCE -- THREE DOW COMPONENTS HIT RESISTANCE -- DOLLAR GETS WHACKED AGAIN -- YEN AND CANADIAN DOLLAR SURGE
by John Murphy,
Chief Technical Analyst, StockCharts.com
NASDAQ LAGS NYSE... Today's Market Message was written by Arthur Hill. John Murphy will return tomorrow. - Editor
Investor appetite for risk remains weak as the Nasdaq continues to lag the NY Composite. With stricter listing requirements on the NYSE, the Nasdaq attracts more speculative (riskier) issues. This is...
READ MORE
MEMBERS ONLY

NASDAQ TESTS TOP OF TRIANGLE -- DOW AND S&P 500 TEST OVERHEAD RESISTANCE
by John Murphy,
Chief Technical Analyst, StockCharts.com
NASDAQ TESTS TOP OF TRIANGLE... I've received a lot of questions about the bearish triangle I recently described in the Nasdaq Composite Index. As you can see in Chart 1, it hasn't been resolved one way or the other. After surviving a test of its lower...
READ MORE
MEMBERS ONLY

DOLLAR TRIANGLE LOOKS READY TO BE RESOLVED ON DOWNSIDE -- EURO HITS NEW RECORD TODAY AGAINST DOLLAR -- GOLD STOCKS APPEAR READY TO RESUME THEIR BULL TREND
by John Murphy,
Chief Technical Analyst, StockCharts.com
DOLLAR TRIANGLE LOOKS BEARISH ... A few weeks back I wrote that the U.S. Dollar Index could be on the verge of an intermediate-term rebound. That's no longer the case. The daily bars in Chart 1 show that the USD has been forming a triangle since its...
READ MORE
MEMBERS ONLY

MORE ON YIELD CURVE'S IMPACT ON THE DOLLAR, COMMODITIES, BONDS, AND STOCKS -- BONDS PULLBACK WHILE STOCKS TEST OVERHEAD RESISTANCE
by John Murphy,
Chief Technical Analyst, StockCharts.com
WHY A STEEPENING YIELD CURVE HURTS THE DOLLAR AND HELPS COMMODITIES... One of our readers asked me to explain my statement that a steepening yield curve hurts the dollar. Chart 1 shows the track record since 1998. The red line is a ratio of the the 10-Year T-Note...
READ MORE
MEMBERS ONLY

NATURAL GAS BREAKS OUT -- NAT GAS STOCKS STILL LEAD ENERGY PATCH -- EOG HITS NEW RECORD -- APACHE MAY BE NEXT
by John Murphy,
Chief Technical Analyst, StockCharts.com
NATURAL GAS BREAKS OUT... I've written several articles lately about natural gas stocks taking over leadership in the energy patch. That's because the price of natural gas is starting to play catch-up with the rest of the energy complex. Last Wednesday, Arthur Hill wrote that...
READ MORE
MEMBERS ONLY

BOND/STOCK RATIO IS STILL IN UPTREND -- THE LONG BOND, HOWEVER, IS STARTING TO LAG BEHIND SHORTER MATURITIES AS INFLATION RISES AND YIELD CURVE STEEPENS -- TIPS OFFER A WAY TO SHORTEN BOND MATURITY WHILE OFFERING INFLATION PROTECTION
by John Murphy,
Chief Technical Analyst, StockCharts.com
BONDS ARE STILL ACTING BETTER THAN STOCKS... Last Friday I wrote about the different bond ETFs available to investors. I finished up with a few conclusions. One was that bonds are still a preferred investment over stocks. That's usually the case in the early stages of an economic...
READ MORE
MEMBERS ONLY

TODAY'S DROP KEEPS MARKET IN BEARISH CONSOLIDATION PHASE -- THE NASDAQ APPEARS READY TO RESOLVE BEARISH TRIANGLE TO THE DOWNSIDE
by John Murphy,
Chief Technical Analyst, StockCharts.com
MARKET STILL IN BEARISH TRIANGLE... Today's market drop has kept the market in what appears to be a bearish consolidation pattern. The first three daily charts show the Dow, the S&P 500, and the Nasdaq Composite still trading well below their 50-day averages and their...
READ MORE
MEMBERS ONLY

INFLATION HEATS UP -- COMMODITY ETFS ARE STRONG ACROSS THE BOARD -- GOLD BREAKS TRIANGLE RESISTANCE -- ANOTHER LOOK AT TIPS -- TLT HITS SUPPORT
by John Murphy,
Chief Technical Analyst, StockCharts.com
COMMODITY ETFS CONFIRM CPI REPORT... Today's Market Message was written by Arthur Hill. John Murphy will return tomorrow. - Editor
Before the bell this morning, the Labor Department reported that the Consumer Price Index (CPI) rose .4% in January. Core-CPI, which excludes energy and food, rose .3%. Both...
READ MORE
MEMBERS ONLY

ENERGY STOCKS RALLY AS CRUDE HITS $100 -- DEVON AND EOG JOIN NATURAL GAS LEADERS -- GOLD STOCKS ARE TRIANGULATING IN UPTREND -- COMMODITIES HAVE ANOTHER BIG DAY -- STOCK RALLY FADES
by John Murphy,
Chief Technical Analyst, StockCharts.com
MORE NATURAL GAS BREAKOUTS ... Last Tuesday, I wrote about new energy leadership coming from natural gas stocks. I showed two natural gas stocks that were hitting new record highs, including Chesapeake and XTO Energy. Both are hitting new records again today. Here are a couple more natural gas stocks to...
READ MORE
MEMBERS ONLY
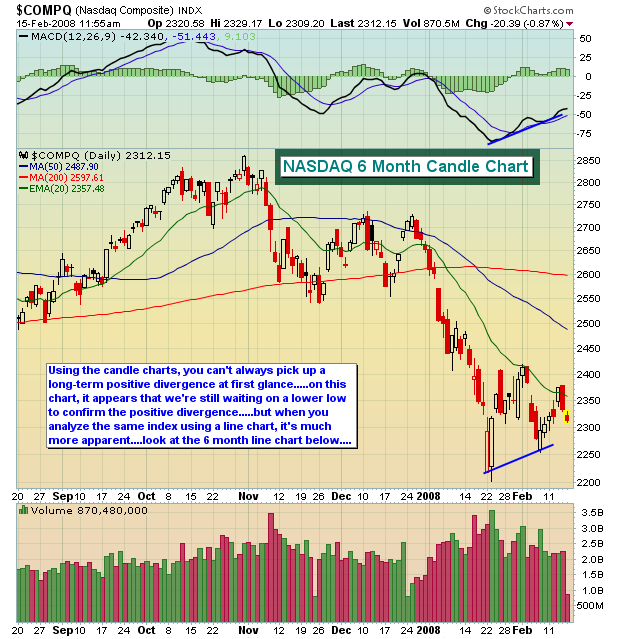
THE LINE CHART ADVANTAGE
This is a rarity. I am proposing that you use line charts - in one instance. A line chart simply connects one closing price to the next closing price. Intraday activity does not appear and is ignored. How in the world can line charts have an advantage over bar charts or...
READ MORE
MEMBERS ONLY

DIA FAILS AT BROKEN SUPPORT
In the 15-December issue of ChartWatchers, I pointed out the possibility of a head-and-shoulders top in the Dow Industrials ETF (DIA). The ETF formed a weekly bearish engulfing pattern that week and this marked the mid December high. Subsequently, DIA moved lower over the next several weeks...
READ MORE
MEMBERS ONLY
BOTTOM STILL NOT RESOLVED
When the market began to rally this week, it looked as if a successful retest of last month's lows had occurred and that another up leg had begun; however, what looked like the start of a new rising trend, has now morphed into a triangle formation with the...
READ MORE
MEMBERS ONLY
DOW JONES INDUSTRIALS CHANGING
Dow Jones announced last week that they are removing Altria and Honeywell from the index and adding Citibank and Chevron. The change takes effect at the start of trading on Tuesday.
MARKET HOLIDAY ON MONDAY - Don't forget that both the US and Canadian markets are closed on Monday....
READ MORE
MEMBERS ONLY
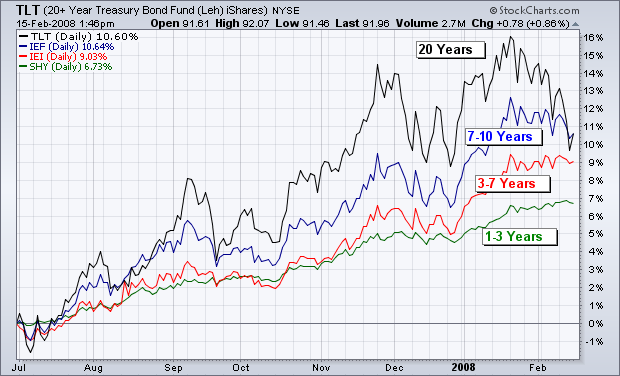
COMPARING BOND ETFs
The below chart compares the performance of four T-bond ETFs since last July, when money started to flow out of stocks and into bonds. The four ETFs represent different durations in the yield curve. Through the middle of January, the top performer was the 20 + Year Bond Fund (TLT)...
READ MORE
MEMBERS ONLY
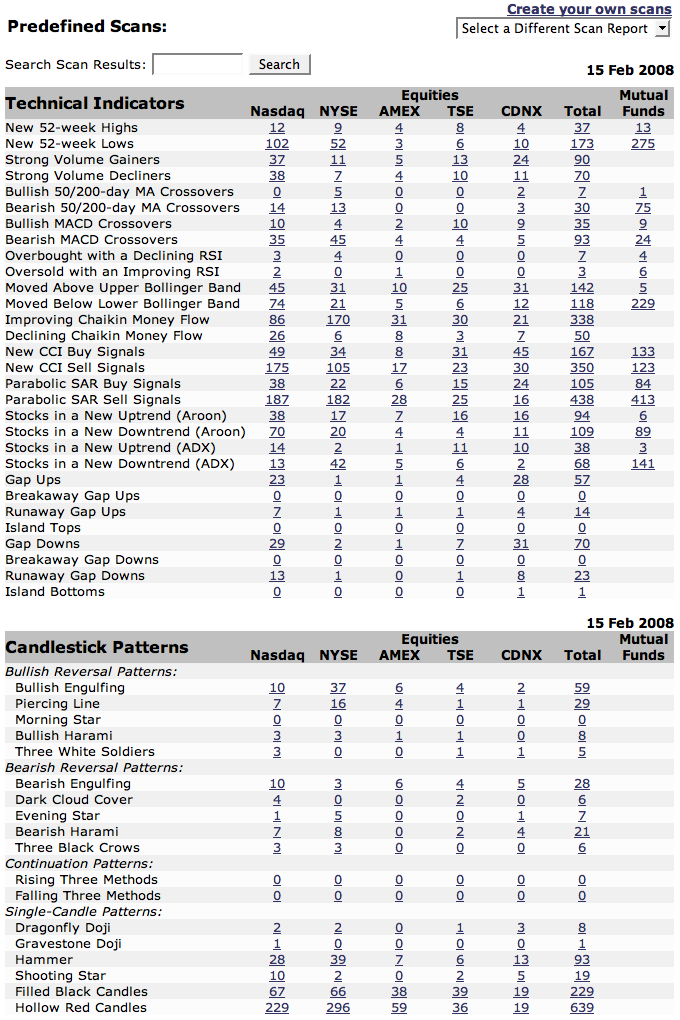
DIGGING INTO MARKET BREADTH
StockCharts.com has an extensive collection of Market Breadth indicators. Many of them can be found under the "Breadth Charts" link on the left side of our homepage. However, one of the best places for studying market breadth on our site is - surprisingly - our Predefined Scan Results page....
READ MORE
MEMBERS ONLY

YIELD CURVE CONTINUES TO STEEPEN -- SELLING IN LONG BOND ETF SUGGESTS SHORTER MATURITIES -- TIPS OFFER MORE INFLATION PROTECTION -- BOND/STOCK RATIO NOW FAVORS BONDS
by John Murphy,
Chief Technical Analyst, StockCharts.com
STEEPENING YIELD CURVE IMPLIES ECONOMIC WEAKENING ... I wrote an article on the steepening yield curve on January 31 and have been asked to revisit the question of bonds and bond yields. One question I received was how to create Chart 1. The "yield spread" usually refers to the...
READ MORE
MEMBERS ONLY

HOME DEPOT LEADS RETAIL GROUP LOWER -- YESTERDAY'S RETAIL LED BOUNCE SHOWS NO FOLLOW THROUGH -- MARKET APPEARS TO BE CONSOLIDATING IN DOWNTREND -- WAVE PATTERNS SUGGEST AT LEAST ONE MORE DOWNLEG
by John Murphy,
Chief Technical Analyst, StockCharts.com
HOME DEPOT LEADS RETAIL LOSSES ... A government report on retail spending sent that group higher yesterday. Arthur Hill pointed out, however, that the retail group is still in a downtrend. He also showed that while Wal Mart (the largest stock in the retail group) was doing much better than the...
READ MORE
MEMBERS ONLY

BROAD MARKET UP -- SECTORS MIXED -- NASDAQ AND RUSSELL 2000 LEAD THE WAY -- RETAIL HOLDRS BOUNCE -- WAL-MART CHARGES TO RESISTANCE -- CLARIFYING PERFCHART SETTINGS
by John Murphy,
Chief Technical Analyst, StockCharts.com
MARKET RALLIES WITH MIXED PARTICIPATION... Today's Market Message was written by Arthur Hill. John Murphy will return tomorrow. - Editor
The major indices moved higher on Wednesday, but participation was mixed. A run through the AMEX Select Sector SPDRs on the Market Summary page shows four sectors gaining ground...
READ MORE
MEMBERS ONLY

BUFFETT OFFER BUOYS FINANCIAL STOCKS -- NATURAL GAS STOCKS ARE NEW ENERGY LEADERS -- NAT GAS LEADERS ARE XTO, CHESAPEAKE, AND APACHE -- A COMPARISON OF COMMODITIES AND THE DOLLAR
by John Murphy,
Chief Technical Analyst, StockCharts.com
THIS IS CORRECT YEN CHART ... In last Friday's Market Message, I tried to show that the Japanese Yen was starting to rally against all of the world's major currencies (in addition to the U.S. Dollar). One of our sharp-eyed readers correctly pointed out that...
READ MORE
MEMBERS ONLY

RISING US DOLLAR PROFUND AND PROSHARES US DOLLAR INDEX BULLISH FUND ARE AVAILABLE -- RYDEX OFFERS EIGHT FOREIGN CURRENCY ETFS -- THE YEN HAS GONE FROM WORLD'S WEAKEST CURRENCY TO ONE OF THE STRONGEST
by John Murphy,
Chief Technical Analyst, StockCharts.com
RISING DOLLAR FUNDS... Following my article on the possibility of a dollar bottom yesterday, I received a number of questions on how to play a dollar rally. One simple way is to buy the Rising US Dollar ProFund (RDPIX). This mutual fund is designed to match the performance of the...
READ MORE
MEMBERS ONLY

EURO FALLS ON HINT ECB MAY BE READY TO LOWER RATES -- THAT SHOULD HELP THE DOLLAR WHICH IS IN A MAJOR OVERSOLD CONDITION -- A DOLLAR RALLY WOULD HELP MAKE US STOCKS A BETTER VALUE THAN FOREIGN STOCKS -- COMMODITIES MAY ALSO PULL BACK IN A DOLLAR RALLY
by John Murphy,
Chief Technical Analyst, StockCharts.com
EURO FALLS ON ECB WILLINGNESS TO LOWER RATES ... My article on Tuesday about the likelihood that the ECB would have to start lowering rates pretty soon elicited a lot of questions about the implications of such a move. I'll try to address some of them here. Two rate...
READ MORE
MEMBERS ONLY

STOCKS REMAIN ON DEFENSIVE -- CONSUMER STAPLES, UTILITIES AND HEALTHCARE SHOW RELATIVE STRENGTH -- QQQQ LAGS THE BROADER MARKET -- THE TECH TROIKA -- SLOWING ECONOMY MAY WEIGH ON CRUDE
by John Murphy,
Chief Technical Analyst, StockCharts.com
DEFENSIVE SECTORS SHINE... Today's Market Message was written by Arthur Hill. John Murphy will return tomorrow. - Editor
Taking their cue from the New York Giants, the defensive sectors are holding their ground. The first image shows the Amex Select Sector SPDRs within the Market Summary page. Eight of...
READ MORE
MEMBERS ONLY

FOREIGN STOCKS ARE FALLING FASTER THAN THE U.S. -- WHEN FOREIGN CENTRAL BANKERS START LOWERING RATES, FOREIGN STOCKS WILL LOSE DOLLAR TAILWIND -- GLOBAL STOCK DOWNTURN APPEARS TO BE RESUMING
by John Murphy,
Chief Technical Analyst, StockCharts.com
SAME BEAR SIGNALS APPLY TO FOREIGN STOCKS... One of our readers asked if the same bearish technical indicators that I've been showing for the U.S. market apply to foreign markets. The answer is "yes". Chart 1, for example, shows a monthly MACD signal on the...
READ MORE
MEMBERS ONLY

DAILY AND WEEKLY 13 AND 34 EMAS REMAIN NEGATIVE -- MONTHLY EMA SPREAD WEAKENS BY MOST IN FIVE YEARS -- WILSHIRE 5000 GIVES SAME SIGNALS
by John Murphy,
Chief Technical Analyst, StockCharts.com
CHECK YOUR AVERAGES ... One of our readers asked for an update on the 13 and 34 "weekly" EMAs (exponentially smoothed moving averages), which I've written about several times in the past as an excellent indicator of market trend. He asked why the EMAs for some of...
READ MORE
MEMBERS ONLY

BEAR MARKET BOUNCE APPEARS TO HAVE ENDED -- MONEY FLOWS INTO BONDS
by John Murphy,
Chief Technical Analyst, StockCharts.com
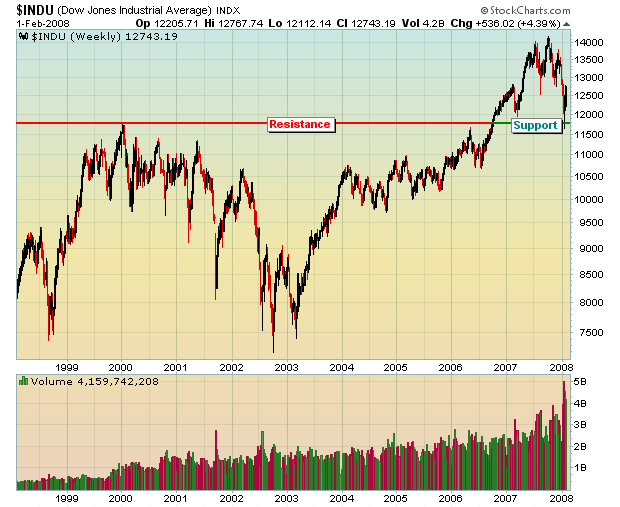
RALLY ATTEMPT APPEARS TO BE FAILING ... Last week we wrote about the likelihood of the bear market rally running into new selling near the November lows just above 1400 in the S&P 500. That number translates into 12750 in the Dow (Chart 2). The downturn over the past...
READ MORE
MEMBERS ONLY
THE MARKET HAS BOTTOMED
want to recap what was discussed in the last ChartWatchers newsletter. We were approaching significant long-term price support on the Dow and the lower trendline on the NASDAQ while pessimism was starting to ramp up. I discussed the possibility of a significant bottom approaching and to watch for the...
READ MORE
MEMBERS ONLY
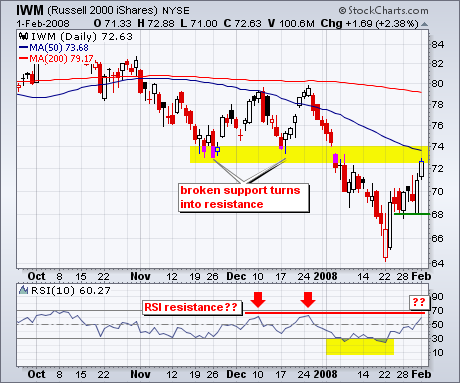
IWM NEARS RESISTANCE ZONE
With an oversold bounce over the last two weeks, the Russell 2000 ETF (IWM) is nearing a resistance zone from broken support and the 50-day moving average. Before going further, I should emphasize that the overall trend remains down for two reasons. First, the ETF broke down in January...
READ MORE
MEMBERS ONLY
RESISTANCE THREATENS RALLY
In my January 18 article I asserted that we had entered a bear market based upon long-term sell signals generated by downside moving average crossovers on the daily and weekly charts of the S&P 500. My bottom line summary was as follows: "Probability is very high...
READ MORE
MEMBERS ONLY
NO ONE IS IMMUNE
We recently noted the US had in our opinion entered into a bear market; hence we believe rallies are to be sold in the coming weeks/months as prices enter into resistance. However, we continue to hear how other world markets such as the European, Asian and Emerging markets will...
READ MORE
MEMBERS ONLY
DATAFEED MILESTONES
We hit two milestones with our Datafeed Upgrade project during the past week. First, the upgraded data connections for our older Thomson feed were installed on Friday. The problems we had last summer were because there was too much data to fit through our 3 megabit data connections. We now...
READ MORE
MEMBERS ONLY
JANUARY BAROMETER PREDICTS BAD YEAR
I haven't heard anyone in the media talking about the January Barometer, which is based on the view that "as January goes, so goes the year". That's probably because they only talk about it when the market has a strong January, which predicts a...
READ MORE
