MEMBERS ONLY
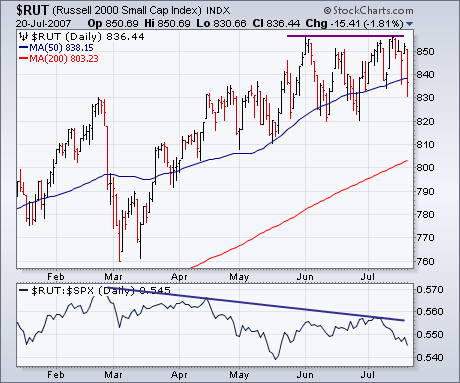
SMALL CAPS FAIL TO SET NEW HIGHS
I suggested Friday that part of the recent weakness in market breadth figures was most likely due to the fact that most of the recent buying has been in large cap stocks, and that small cap indexes had yet to hit new highs. That discrepancy is shown in the chart...
READ MORE
MEMBERS ONLY
SCANNING FOR DOLLARS
Recently, we've seen a big increase in the number of people sending in questions about our scanning feature. Here's an article that I wrote about creating and running scans waaaaay back in October of 2002. While the example scan's results and charts are out...
READ MORE
MEMBERS ONLY

NYSE BULLISH PERCENT INDEX SHOWS NEGATIVE DIVERGENCE -- BREADTH DETERIORATION IS SEEN IN FINANCIALS, HOUSING, REITS, AND SMALL CAPS -- BONDS JUMP AS STOCKS FALL -- GOLD JUMPS ON WEAK DOLLAR -- RISING YEN MAY WEAKEN CARRY TRADE

by John Murphy,
Chief Technical Analyst, StockCharts.com
NYSE BULLISH PERCENT INDEX ... I wrote yesterday about some short-term negative divergences appearing on some of our market breadth indicators. Here's another one. But first an explanation of what it is. The NYSE Bullish Percent Index ($BPNYA) is the percent of stocks in an index that are...
READ MORE
MEMBERS ONLY

BREADTH MEASURES SHOW SHORT-TERM DIVERGENCE -- IBM CONTINUES TO REFLECT NEW TECHNOLOGY BLUE CHIP DOMINANCE -- MICROSOFT HITS NEW 52-WEEK HIGH -- MORE PRECIOUS METAL INDEXES NEAR BULLISH BREAKOUTS -- BARRICK GOLD NEARS RECORD
by John Murphy,
Chief Technical Analyst, StockCharts.com
NYSE ADVANCE-DECLINE LINE SHOWS MINOR DIVERGENCE ... One of our readers asked me to comment on short-term negative divergences showing up on some of our market breadth measures. The main one, of course, is the NYSE Advance-Decline line ($NYAD). Chart 1 shows the divergence referred to. While the...
READ MORE
MEMBERS ONLY

FINANCE SECTOR DRAGS THE MARKET LOWER -- USING RSI TO DETERMINE THE TREND -- BANKS AND BROKERS REMAIN LAGGARDS -- MERRILL AND JP MORGAN GAP DOWN -- GOLD AND SILVER ATTRACT BUYERS -- ST JUDE MEDICAL HITS 52-WEEK HIGH
by John Murphy,
Chief Technical Analyst, StockCharts.com
FINANCE LEADS THE WAY LOWER... Today's Market Message was written by Arthur Hill. John Murphy will be back tomorrow. - Editor
Of the nine sector SPDRs, the Finance SPDR (XLF) lost the most on Wednesday and dragged the market lower. Continuing problems with sub-prime loans were to blame...
READ MORE
MEMBERS ONLY

CHEMICALS AND SEMICONDUCTORS LEAD MARKET HIGHER -- TAIWAN SEMICONDUCTOR KEEPS TAIWAN ETF IN NEW LEADERSHIP ROLE -- MICROSOFT CLEARS ITS 50-DAY AVERAGE
by John Murphy,
Chief Technical Analyst, StockCharts.com
CHEMICALS BOOST BASIC MATERIALS ... Basic materials have been one of the market's strongest groups this year. A lot of the reason for that has to go to strong buying in the chemical group. Chart 1 shows the Dow Jones US Chemicals Index ($DJUSCH) climbing 1.7% and hitting...
READ MORE
MEMBERS ONLY

GENERAL ELECTRIC SHOWS NEW LEADERSHIP -- FEDEX AND ALEXANDER & BALDWIN LEAD TRANSPORTS HIGHER -- PAYCHEX ACHIEVES BULLISH BREAKOUT ON NASDAQ -- US DOLLAR IS CLOSE TO A RECORD LOW -- THE PROFUNDS FALLING DOLLAR FUND EXCEEDS 2005 HIGHS
by John Murphy,
Chief Technical Analyst, StockCharts.com
GENERAL ELECTRIC IS STARTING TO LEAD ... Today's 2% jump in General Electric has pushed the stock to a new multi-year high as shown in Chart 1. As good as that "absolute" performance is, a bigger part of the GE story is the recent upturn in...
READ MORE
MEMBERS ONLY

ALCOA LEADS DOW TO NEW RECORD -- BARRICK GOLD HELPS XAU INDEX BREAK OUT -- CISCO AND INTEL LEAD TECHS HIGHER -- SEMICONDUCTOR HOLDERS ACHIEVE BULLISH BREAKOUT
by John Murphy,
Chief Technical Analyst, StockCharts.com
ALCOA BREAKS OUT TO A NEW RECORD ... Not only did the Dow Industrials hit a new record today, it was the biggest percentage gainer of the major market indexes. A big reason for that was a 6% gain in Alcoa. The monthly bars in Chart 2 show the aluminum giant...
READ MORE
MEMBERS ONLY

S&P 100 REMAINS RANGE BOUND -- RUSSELL 2000 FAILS AT RESISTANCE -- BROKERS SHOW RELATIVE WEAKNESS -- MERRILL LEADS BROKERS LOWER -- COAL STOCKS VERSUS CRUDE OIL -- CRB INDEX BREAKS RESISTANCE
by John Murphy,
Chief Technical Analyst, StockCharts.com
SMALL-CAPS AND LARGE-CAPS LAGGING... Today's Market Message was written by Arthur Hill. - Editor
While the Nasdaq ($COMPQ) and Nasdaq 100 ($NDX) moved to new highs in early July, the S&P 100 ($OEX) and Russell 2000 ($RUT) met resistance from their June highs and stalled...
READ MORE
MEMBERS ONLY

HOUSING AND FINANCIAL PROBLEMS TAKE CENTER STAGE -- EURO HITS NEW RECORD AGAINST THE DOLLAR -- MARKET INDEXES PULL BACK FROM TOP OF RECENT TRADING RANGE
by John Murphy,
Chief Technical Analyst, StockCharts.com
EURO HITS NEW RECORD VERSUS THE DOLLAR ... A sharp drop in U.S. bond yields today is causing heavy selling of the U.S. Dollar. Most of the major foreign currencies are gaining ground (including the yen). The most notable move, however, is in the Euro. The daily bars in...
READ MORE
MEMBERS ONLY

RISING TECHNOLOGY APPEARS TO BE WINNING BATTLE WITH WEAK FINANCIALS -- ALTERA IS ANOTHER SOX LEADER NEARING BULLISH BREAKOUT -- GOLD SHARES ARE STARTING TO PULL BULLION HIGHER -- FALLING DOLLAR BOOSTS COMMODITIES AND FOREIGN SHARES
by John Murphy,
Chief Technical Analyst, StockCharts.com
TECHNOLOGY OVERCOMES FINANCIAL WEAKNESS ... On Friday June 29, I wrote about a tug-of-war going on between a strong technology sector (which is good for the market) versus a weak financial sector (which is bad). So far, it looks like technology is winning the battle. The three lines in...
READ MORE
MEMBERS ONLY
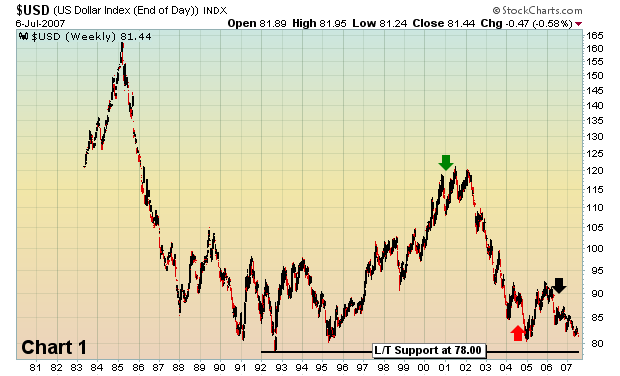
THE WEAK DOLLAR COULD STRENGTHEN YOUR PORTFOLIO
The U.S. Dollar Index is approaching levels not seen since 1992. The reasons are fairly obvious. Global interest rates are on the rise and our own interest rates have been on hold for 8 straight meetings. As foreign interest rates rise, foreign currencies generally strengthen, weakening the US dollar...
READ MORE
MEMBERS ONLY
20-WEEK CYCLE CRESTING
When performing market analysis it is best to first look at the long-term view of what is happening because it provides us with the relevant context for analysis of shorter-term market action. With this in mind, on the weekly bar chart we can see that the S&...
READ MORE
MEMBERS ONLY
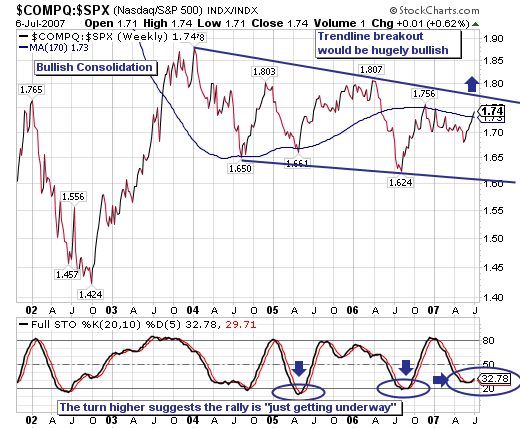
NASDAQ/S&P 500 RATIO
In November-2006, we noted that if one previewed the NASDAQ Composite/S&P 500 Ratio, one would find a very well pronounced and bullish consolidation forming. Well, its been 3 ½ years and the consolidation is still forming; however, there are emerging technical signs that a major breakout is...
READ MORE
MEMBERS ONLY
DATAFEED PROBLEMS CONTINUE
In case you've been under a rock, we have been having severe problems with our intraday datafeed during the past two weeks. We've created a detailed page explaining the problem and the current status of the solution. Click here to get the latest information....
READ MORE
MEMBERS ONLY

A TOUR OF OUR NEW DATACENTER
The Dow is poised to re-test the 13,700 level next week. If it is able to break above that level, it will be a very bullish development indeed. Given that the Dow has faltered just below that level twice in the previous two months, odds are it will...
READ MORE
MEMBERS ONLY

NASDAQ HITS 52-WEEK HIGH -- NYSE COMPOSITE RECAPTURES 10K -- A 10 YEAR LOOK AT THE NASDAQ -- AIRLINES TAKE OFF -- CONTINENTAL LEADS AIRLINES HIGHER -- APPLE BREAKS TRIANGLE RESISTANCE -- THE APPLE AFFECT -- GOLD MINERS ETF BOUNCES OFF RANGE SUPPORT
by John Murphy,
Chief Technical Analyst, StockCharts.com
STOCKS END HIGHER IN SHORT SESSION... Today's Market Message was written by Arthur Hill. - Editor
The stock exchanges closed early on Tuesday (1PM), but that did not deter the bulls and the major indices notched another gain before the 4th of July holiday. The gains across the board...
READ MORE
MEMBERS ONLY

STOCKS START THE SECOND HALF STRONG -- TECHS CONTINUE TO LEAD - GM AND FORD HIT 52-WEEK HIGHS -- US DOLLAR TUMBLES -- GOLD BOUNCES ON DOLLAR WEAKNESS
by John Murphy,
Chief Technical Analyst, StockCharts.com
GOOD NEWS BOOSTS STOCKS... Today's Market Message was written by Arthur Hill. - Editor
Good news brought out the bulls and stocks started the second half of the year on a strong note. The Institute for Supply Management (ISM) got things started with a report that their June manufacturing...
READ MORE
MEMBERS ONLY

MARKET TREND MAY DEPEND ON WHETHER TECHNOLOGY STRENGTH CAN OVERCOME FINANCIAL WEAKNESS -- SOME RECENT NASDAQ LEADERS -- DELL BREAKS OUT -- SHORT-TERM S&P 500 TREND CONTINUES TO WEAKEN
by John Murphy,
Chief Technical Analyst, StockCharts.com
TUG OF WAR GOING ON ... It seems to me that a tug of war is going on in the market between two opposing forces. On the positive side is the recent resurgence in technology shares. That's usually good for the market. On the negative side is recent selling...
READ MORE
MEMBERS ONLY

S&P 500 AND RUSSELL 2000 BOUNCE OFF SUPPORT -- NASDAQ SHOWS RELATIVE STRENGTH -- SEMIS LEAD TECHS HIGHER -- MXIM AND AMAT POWER THE SEMIS -- BIOGEN JOINS BUYBACK FEVER -- USING PRICE CHANNELS
by John Murphy,
Chief Technical Analyst, StockCharts.com
TESTING KEY SUPPORT AHEAD OF THE FED... Today's Market Message was written by Arthur Hill. John Murphy will be back tomorrow. - Editor
The Fed started its two day meeting today and an announcement is expected tomorrow afternoon. Stocks were weak leading up to the meeting, but managed to...
READ MORE
MEMBERS ONLY

DRUGS AND TOBACCO ATTRACT NEW BUYING -- COCA COLA ENTERPRISES ACHIEVES BULLISH BREAKOUT -- RISING BOND YIELDS MAY BE HURTING PRECIOUS METALS -- MARKET RALLY FADES AS VIX JUMPS TO THREE-MONTH HIGH
by John Murphy,
Chief Technical Analyst, StockCharts.com
OVERSOLD HEALTHCARE SECTOR BOUNCES ... It may be a sign that investors are turning a little more defensive, but some of this week's strongest groups have been in defensive areas like consumer staples and healthcare. Today's market reports show a housing sector that's continuing to...
READ MORE
MEMBERS ONLY

WEAK FINANCIALS PULL MARKET LOWER -- S&P 500 CLOSES BELOW 5O-DAY LINE FOR SECOND DAY -- JUNE LOW MAY BE RETESTED --BONDS BOUNCE ON FLIGHT TO QUALITY BUYING -- RISING VIX NEARS QUARTERLY HIGH
by John Murphy,
Chief Technical Analyst, StockCharts.com
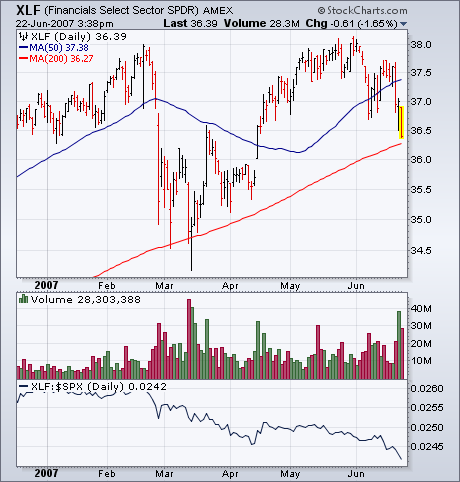
FINANCIALS SPDR FALLS BELOW 200-DAY LINE ... A mid-day market rally fell apart on more mortgage concerns and another sharp drop in financial shares. Chart 1 shows the Financials Select SPDR (XLF) ending the day beneath its 200-day moving average. Downside volume has been especially heavy over the...
READ MORE
MEMBERS ONLY
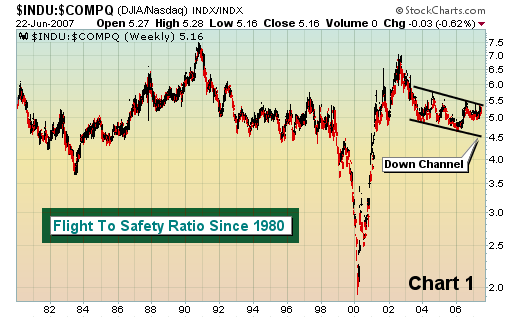
FLIGHT TO SAFETY RATIO
I discussed many months ago how the rotation from the tech-heavy NASDAQ to the safety of the Dow Jones evolves over time. As earnings disappoint and growth slows, money moves away from the high octane growth stocks to the more conservative components of the Dow. That's what...
READ MORE
MEMBERS ONLY
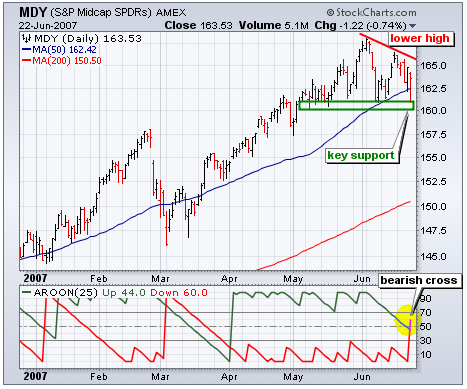
S&P MIDCAP ETF TESTS KEY SUPPORT
The S&P Midcap ETF (MDY) remains in an uptrend for now, but a lower high and waning upside momentum are cause for concern. The ETF established support around 160-161 with reaction lows in May and June. In addition, the rising 50-day moving average marks support in...
READ MORE
MEMBERS ONLY

BONDS CONTINUE TO WEAKEN
On our first chart, a daily bar chart, we can see that bonds have been weakening for several months, with the most dramatic decline occurring in the last month or so. The question that comes to mind is whether this weakness is a correction in a longer-term up trend...
READ MORE
MEMBERS ONLY
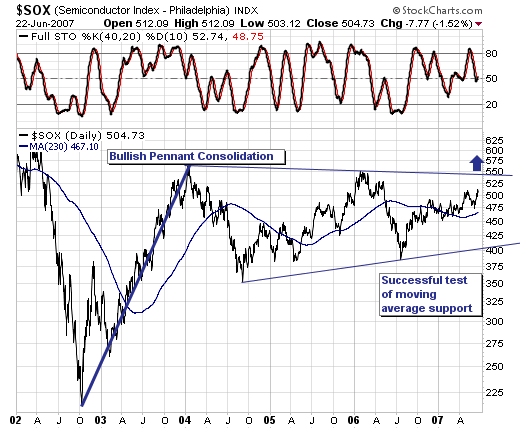
LOOKING AT THE SEMICONDUCTOR INDEX
Last week's stock market correction was rather "brutal" to be sure; however, we believe that the balance of evidence suggests at this time it is nothing more than a correction and more likely a consolidation to higher highs. If this is so, then we want to...
READ MORE
MEMBERS ONLY
SERVER ROOM MOVE COMPLETED!
It took w-a-y longer than it was supposed to but all of our servers are now fully moved into our new, cooler, more powerful datacenter. The new datacenter will allow us to continue adding newer, more powerful computers that will allow our site to run even faster.
CHART...
READ MORE
MEMBERS ONLY
SUBPRIME CONCERNS HURT BANKS AND BROKERS
Growing concerns about the fallout in the subprime mortgage market caused heavy selling in banks and brokers today. Today's selling more than wiped out yesterday's rebound in the financial group. Chart 1 shows the Financials Sector SPDR (XLF) undercutting yesterday's intra-day low. It&...
READ MORE
MEMBERS ONLY
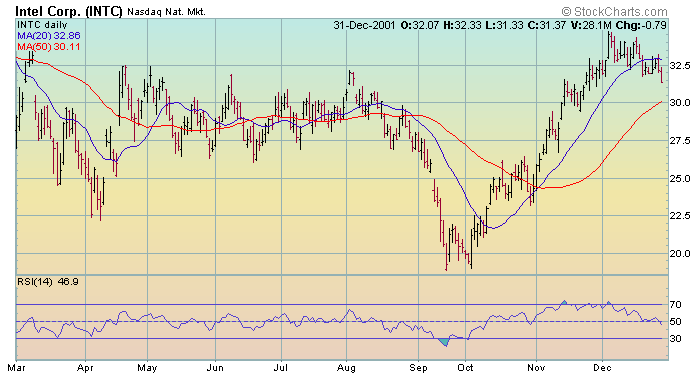
SIX SIMPLE STEPS FOR FINDING GREAT STOCKS
This week, I thought we'd revisit an article I wrote way back in November of 2001 about the "Six Steps" you can take at StockCharts.com to quickly guage the overall health of the market and find great stock opportunities. While the graphs are all out-...
READ MORE
MEMBERS ONLY

FINANCIAL STOCKS LEAD MARKET DECLINE -- SO DO UTILITIES -- RISING RATES ARE PART OF THE PROBLEM -- S&P 500 CLOSES BELOW 50-DAY AVERAGE ON HEAVY VOLUME
by John Murphy,
Chief Technical Analyst, StockCharts.com
SUBPRIME CONCERNS HURT BANKS AND BROKERS ... Growing concerns about the fallout in the subprime mortgage market caused heavy selling in banks and brokers today. Today's selling more than wiped out yesterday's rebound in the financial group. Chart 1 shows the Financials Sector SPDR (XLF) undercutting yesterday&...
READ MORE
MEMBERS ONLY

FINANCIAL SHARES RECOVER FROM EARLY SELLOFF WHILE SOX INDEX HITS 52-WEEK HIGH -- THOSE TWO FACTORS KEPT S&P 500 OVER ITS 50-DAY AVERAGE -- NASDAQ SHOWS NEW UPSIDE LEADERSHIP
by John Murphy,
Chief Technical Analyst, StockCharts.com
FINANCIALS REBOUND ON STRONG VOLUME ... An early selloff in financial stocks today turned into a positive day after all. Chart 1 shows the Financials Sector SPDR (XLF) closing higher. More importantly, volume was unsually heavy. That upside reversal day also kept the XLF above its 200-day moving average. The...
READ MORE
MEMBERS ONLY

SEMICONDUCTOR BUYING MAY BE TIED TO STRONGER ASIA -- TAIWAN SEMICONDUCTOR AND TERADYNE ACHIEVE BULLISH BREAKOUTS -- SO DOES SEMICONDUCTOR HOLDERS -- THAT'S HELPING PUT NASDAQ IN NEW LEADERSHIP ROLE
by John Murphy,
Chief Technical Analyst, StockCharts.com
NEW INTEREST IN CHIPS AND TAIWAN ... My June 14 story on new buying in semiconductors was greeted with some questions and some criticism. One reader suggested that I stop writing about the group because it had disappointed so many times in the past. Another asked how I could be positive...
READ MORE
MEMBERS ONLY

STOCKS REVERSE AFTER EARLY GAINS - ENERGY LEADS THE WAY LOWER - AIRLINES BOUNCE ON FALLING OIL PRICES - SOUTHWEST BREAKS MAY HIGH - RISING RATES HURT UTILITIES - NET NEW HIGHS REMAIN POSITIVE
by John Murphy,
Chief Technical Analyst, StockCharts.com
BEARISH ENGULFING PATTERNS ABOUND... Today's Market Message was written by Arthur Hill. John Murphy will be back tomorrow. - Editor
Stocks opened strong this morning, but selling pressure took over and the major indices finished the day weak. As a result, bearish engulfing patterns or outside reversals formed in...
READ MORE
MEMBERS ONLY

MORE ON HOW CURRENCIES IMPACT FOREIGN ETFS -- REITS AND HOMEBUILDING STOCKS SHOW NO SIGN OF BOTTOM -- DOW'S POINT & FIGURE TREND IS STILL UP
by John Murphy,
Chief Technical Analyst, StockCharts.com
MORE ON CURRENCY MOVES ... One of our readers complained that Chart 6 in last Friday's update made no sense. It had to do with why a weaker yen hurt the relative performance of Japan iShares (EWJ). I'll take another shot at it because it can be...
READ MORE
MEMBERS ONLY

FALLING YEN KEEPS CARRY TRADE ALIVE -- TAIWAN SEMICONDUCTOR IS RISING WITH CHIP STOCKS AND BOOSTS TAIWAN ETF -- OVERSOLD EURO IS BOUNCING ALONG WITH GOLD -- BOND YIELDS PULL BACK BELOW RESISTANCE AND HELP STEADY STOCK MARKET
by John Murphy,
Chief Technical Analyst, StockCharts.com
YEN BREAKS IMPORTANT CHART SUPPORT ... The Japanese yen resumed its long-term downtrend this week by falling to new lows against most major currencies. That includes the U.S. Dollar which is also one of the world's weakest currencies. Chart 1 shows the yen falling below its 2007...
READ MORE
MEMBERS ONLY

INTEL LEADS SEMICONDUCTORS HIGHER -- OTHER CHIP LEADERS ALSO INCLUDE KLAC, NSM, AND TXN -- NEW SOX BUYING IS HELPING BOOST NASDAQ -- COMMODITY ETF HITS NEW RECORD
by John Murphy,
Chief Technical Analyst, StockCharts.com
SEMICONDUCTORS ON THE REBOUND ... Semiconductors have been a frustrating market group. Every time it looks like the group is ready to join the bull market, it suffers a disappointing setback. A good example of that is seen in Chart 1. During April, the Semiconductor (SOX) Index broke out to a...
READ MORE
MEMBERS ONLY

FALLING RATES BOOST STOCKS -- BONDS FINALLY BOUNCE -- OIL SURGES OFF SUPPORT -- OIL SERVICES REMAIN STRONG -- SLB HITS 52-WEEK HIGH -- RSI SIGNALS FOR SPX
by John Murphy,
Chief Technical Analyst, StockCharts.com
RISING BONDS GIVE STOCKS A LIFT... Today's Market Message was written by Arthur Hill. John Murphy will be back tomorrow. - Editor
The stock market got a triple dose of good news today. First, the Fed released its Beige Book and the report was largely positive. Despite a few...
READ MORE
MEMBERS ONLY

BOND YIELDS REACH FIVE-YEAR HIGH -- REITS AND HOMEBUILDERS CRUMBLE -- MARKET INDEXES THREATEN 50-DAY AVERAGES
by John Murphy,
Chief Technical Analyst, StockCharts.com
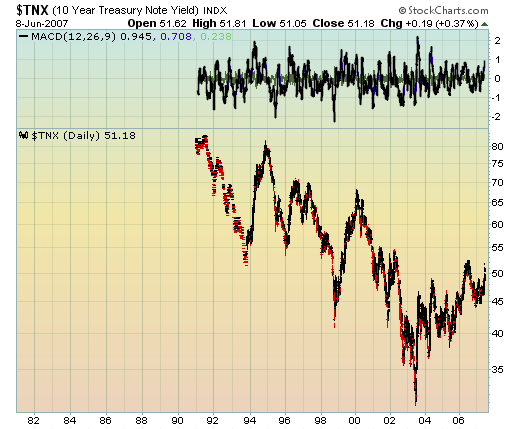
BOND YIELDS BREAKOUT ... The upward climb in bond yields continued again today. Both the 10-year and the 30-Year Treasury yields closed at the highest level in five years. Chart 1 shows the 10-Year Treasury Note Yield ending just above the high reached in the middle of last...
READ MORE
MEMBERS ONLY

MAJOR BULL MARKET IN BONDS MAY BE ENDING -- WHAT THAT MEANS FOR STOCKS -- JAPAN MAY HOLD KEY TO US BOND YIELDS
by John Murphy,
Chief Technical Analyst, StockCharts.com
TWENTY-FIVE YEAR BOND BULL MAY BE ENDING... Bill Gross stated last week that he had turned bearish on bond prices for the first time in more than twenty years. Given that he runs the world's biggest bond fund at Pimco, I thought I'd show you...
READ MORE
MEMBERS ONLY
A GOLDEN OPPORTUNITY
The market periodically finds reasons to selloff, even in bull markets. This past week it was all about interest rates. You could see it coming. Interest rates had been rising for the last month. The yield on the 10 year treasury bond increased from 4.61% on May 8th to...
READ MORE
