MEMBERS ONLY
SEMIS NEED HELP
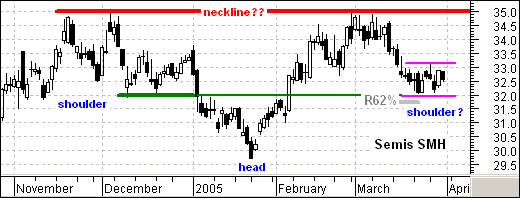
It remains a one horse race among the key Nasdaq industry groups. The Networking iShares (IGN), Software HOLDRS (SWH) and Internet HOLDRS (HHH) are weak and trading near their lows for the year (gray oval). However, the Semiconductor HOLDRS (SMH) are holding up the best and still well above their...
READ MORE
MEMBERS ONLY
CASH FLOW SENTIMENT GAGE
The Rydex Asset Ratio measures the amount of bullish and bearish sentiment by tracking and comparing the total assets in Rydex bull and bear funds. Decision Point also calculates the Rydex Cash Flow Ratio, an indicator we developed that accounts for the actual cash flowing into and out of the...
READ MORE
MEMBERS ONLY
WHAT YOU DIDN'T NOTICE LAST WEEK -
Did you know that our primary datafeed circuit went out last week? Betcha' didn't even notice. The reason is that our secondary circuit immediately kicked in and kept everything running smoothly. Prior to last fall's datafeed upgrade, that would not have happened and the site...
READ MORE
MEMBERS ONLY
BAD NEWS FOR ECONOMICS, DOW THREATENING LOW
THE ECONOMIC NEWS ISN'T GOOD ... It's interesting to see the media put a positive spin on recent economic reports. It was reported this week that fourth GDP growth was lower than expected while prices were higher than expected. That was described as good for the economy....
READ MORE
MEMBERS ONLY
Hello Fellow ChartWatchers!
With the Dow getting ready to test its January lows, things are really getting busy here at StockCharts. Our market commentators have all the market angles covered below, so I wanted to take a couple of minutes and update you on our progress with SharpCharts2 - our soon-to-be-released...
READ MORE
MEMBERS ONLY

FIRST QUARTER SECTOR RANKINGS PAINT NEGATIVE PICTURE -- RETAILERS LEAD MARKET LOWER -- DOW IS THREATENING ITS JANUARY LOW -- EXPECT LOWER PRICES

by John Murphy,
Chief Technical Analyst, StockCharts.com
FIRST QUARTER RANKINGS ... The sector rankings for the first quarter of the year carry an important message. Unfortunately, it's a negative message both for the stock market and the economy. The sector bars are plotted above and below the S&P 500 which is the zero line....
READ MORE
MEMBERS ONLY

ENERGY SURGE SHORT-CIRCUITS MARKET BOUNCE -- SOFTER DOLLAR BOOSTS COMMODITIES -- TIME TO RE-ENERGIZE
by John Murphy,
Chief Technical Analyst, StockCharts.com
ENERGY MARKETS SURGE ... The entire energy complex is rising sharply today -- paced by record highs in gasoline and heating oil. Crude is trading 1.64 higher at 55.63. Chart 1 shows that the uptrend in crude is still intact. The energy complex is leading a strong rally in the...
READ MORE
MEMBERS ONLY

MORE ON SECTOR ROTATIONS -- COMMODITY-RELATED STOCKS ARE SLIPPING -- AIRLINES ARE LEADING MARKET BOUNCE -- DOW AND S&P ARE DUE FOR OVERSOLD BOUNCE
by John Murphy,
Chief Technical Analyst, StockCharts.com
BASIC MATERIALS AND ENERGY ARE SLIPPPING... Basic materials and energy were among yesterday's weakest groups. The Materials Sector SPDR (XLB) and the Oil Service Holders (OIH) both closed beneath their 50-day moving averages. The month of March has also seen some slippage in their relative strength lines....
READ MORE
MEMBERS ONLY

RISING RATES HURT EMERGING MARKETS -- SMALL CAPS HAVE LOST MARKET LEADERSHIP
by John Murphy,
Chief Technical Analyst, StockCharts.com
EMERGING MARKETS ARE FALLING HARD ... Given the high correlation between global stock markets, it's no surprise to see most of them weakening along with the U.S. market. Emerging markets are getting hit especially hard. I believe that's due to the recent upturn in long-term...
READ MORE
MEMBERS ONLY

FALLING YEN HURTS JAPAN -- CANADIAN DOLLAR HELPS CANADA -- BASIC MATERIALS AND OIL SERVICE ETFS TEST 50-DAY LINES -- GOLD STOCKS ARE OVERSOLD
by John Murphy,
Chief Technical Analyst, StockCharts.com
JAPANESE YEN SLIPS UNDER 200-DAY LINE ... With the U.S. Dollar in a rally mode, most foreign currencies have been selling off of late. Among the major currencies, the Japanese yen has been hit the hardest. Chart 1 shows the yen falling under its 200-day average and testing...
READ MORE
MEMBERS ONLY

KEEP YOUR EYE ON THE LONG-TERM TREND WHICH CONTINUES TO WEAKEN -- DON'T BUY RALLIES -- SELL INTO THEM
by John Murphy,
Chief Technical Analyst, StockCharts.com
DON'T WORRY ABOUT THE SHORT-TERM ... I've been getting messages asking about my short-term market view. Partially in response, I wrote a message earlier today about the market being in a short-term oversold condition from which a short-term bounce could materialize. That'...
READ MORE
MEMBERS ONLY

SOX IS HELPING NASDAQ FIND SOME SUPPORT NEAR 2000 -- DOW IS OVERSOLD, BUT DON'T EXPECT TOO MUCH ON ANY BOUNCE
by John Murphy,
Chief Technical Analyst, StockCharts.com
NIBBLING AT NASDAQ 2000... The market is in an oversold condition from which a rebound is possible. That doesn't turn its chart bullish. But some bottom-fishers are starting to do some nibbling -- especially in the Nasdaq market. Chart 1 shows two reasons why. First, the Nasdaq Composite...
READ MORE
MEMBERS ONLY

THE LINK BETWEEN GOLD, THE DOLLAR, AND INTEREST RATES -- WHY RISING RATES ARE CAUSING SELLING IN CRB INDEX
by John Murphy,
Chief Technical Analyst, StockCharts.com
GOLD SELLING TIED TO RISING DOLLAR ... Some of you have asked why gold sold off this week in reaction to news of higher inflation. After all, commodities are leading indicators of inflation. Keep in mind that a big part of the commodity advance over the last three years has been...
READ MORE
MEMBERS ONLY

THE FED FINALLY ADMITS THERE'S INFLATION -- SURGING BOND YIELDS PUNISH STOCKS -- RATE-SENSITIVE STOCKS FALL THE HARDEST
by John Murphy,
Chief Technical Analyst, StockCharts.com
BOND YIELDS SURGE TO EIGHT-MONTH HIGH ... It's amazing to me how the media (and investors) hang on every word from the Fed. Veteran market watchers know that the Fed reacts to market events -- it doesn't anticipate them. Today's admission by the Fed that...
READ MORE
MEMBERS ONLY

SHORT AND LONG-TERM RATES USUALLY TREND IN THE SAME DIRECTION -- LONG-TERM RATES APPEAR TO HAVE TURNED UP -- THAT COULD BE BAD FOR STOCKS
by John Murphy,
Chief Technical Analyst, StockCharts.com
RELATIONSHIP BETWEEN SHORT AND LONG RATES ... With the Fed expected to keep raising short-term rates, a lot has been written about the relationship between short and long-term rates. The fact is that they usually trend in the same direction -- but not always to the same degree or at...
READ MORE
MEMBERS ONLY

VIX IS STARTING TO RISE -- BLUE CHIP AVERAGES SLIP FURTHER -- NASDAQ TESTING 200-DAY LINE -- DOLLAR BOUNCE HURTS GOLD
by John Murphy,
Chief Technical Analyst, StockCharts.com
DOW AND S&p 500 SLIP UNDER CHART SUPPORT... The blue chip averages continued to deteriorate today. Both the Dow and the S&P 500 closed below their late February lows. Financial stocks were among the day's biggest losers as long-term interest rates rose again....
READ MORE
MEMBERS ONLY

WATCH OUT FOR THE VIX -- VOLATILITY IS RISING FOR THE FIRST TIME IN TWO YEARS WHICH IS BEARISH FOR STOCKS
by John Murphy,
Chief Technical Analyst, StockCharts.com
THE VIX IS RALLYING ... The CBOE Volatility Index (VIX) is starting to climb. Chart 1 shows the VIX trading at a two month high and nearing a challenge of its 200-day moving average. A more important test will take place at its January high at 14.75. That'...
READ MORE
MEMBERS ONLY
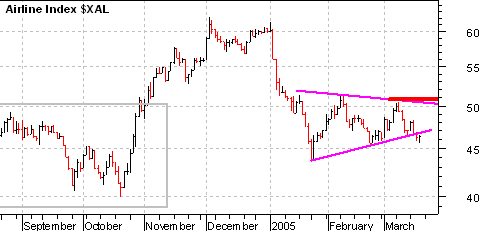
AIRLINES UNDER PRESSURE
With the surge in oil prices over the last three months, the Amex Airline Index (XAL) remains under pressure. After a sharp decline in January, the index consolidated with a symmetrical triangle. The recent break below the lower trendline is certainly negative and further weakness below the February low (45)...
READ MORE
MEMBERS ONLY
LOOKING FOR A CRB TOP
The title of this article, Looking for a CRB Top , has been my broken record for the last year or so, but it just hasn't happened so far.
I use the monthly price chart and PMO ( Price Momentum Oscillator ) to determine when long-term price reversals may be...
READ MORE
MEMBERS ONLY
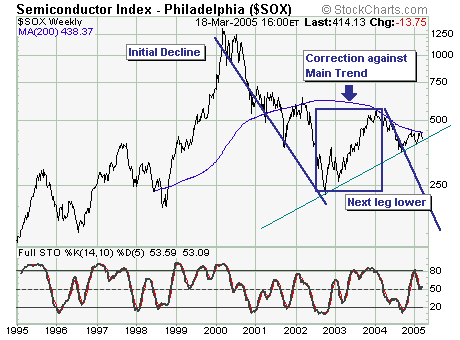
SHORTING THE SOX
Today we expand a bit with 2 charts; with our contention that selling short the Semiconductor Index ($SOX) and several individual names has a high probability of success in the months ahead.
Looking at the $SOX, it is trading within a not yet complete' decline that began in 2000,...
READ MORE
MEMBERS ONLY
SITE NEWS:
SHARPCHARTS2 BETA 6 - As Chip said above, we are focused on finishing up the work on SharpCharts2 as soon as possible. Check out his comments above for more details.
DECISIONPOINT.COM'S NEW LOOK - OK, OK, so it's not news about StockCharts.com. Still, it is interesting...
READ MORE
MEMBERS ONLY
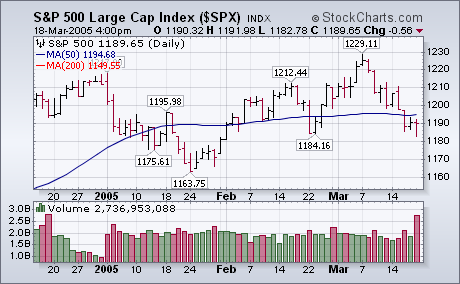
DON'T MIND THE BIG VOLUME
Most of the major market averages closed in the red today, but only marginally. After trading down most of the day, the S&P 500 closed with a loss of less than a point. The S&P also held at its late February low at 1184. While the...
READ MORE
MEMBERS ONLY
Hello Fellow ChartWatchers!
Things are jumping here at StockCharts. With the upcoming release of the next version of our main charting tool, I've been way too busy to watch the market closely. Fortunately, our crack team of market commentators has been on the case and you can find their bi-weekly...
READ MORE
MEMBERS ONLY

SECTOR ROTATIONS IN 2005 SHOW DEFENSIVE MARKET -- FINANCIALS BREAKDOWN -- HOW TO COMPARE PRICE CHARTS -- NO SURPRISES HERE
by John Murphy,
Chief Technical Analyst, StockCharts.com
SECTOR PERFORMANCE CHART ... Most weeks in "John's Latest Performance Chart" I show the relative rankings of the nine AMEX Sector SPDRs relative to the S&P 500. Chart 1 shows those sector rankings since the start of the year. I've arranged the sector...
READ MORE
MEMBERS ONLY

GETTING FAMILIAR WITH SHARPCHARTS 2 -- HOW TO OVERLAY INDICATORS ON PRICE CHARTS AND WHY YOU SHOULD DO THAT
by John Murphy,
Chief Technical Analyst, StockCharts.com
SHARPCHARTS 2 IS ON THE WAY ... The March 12 Chartwatchers Newsletter discussed the latest "Beta" version of Stockchart.com's up-and-coming new charting tool -- SharpCharts 2. This new charting version has been in the works for almost two years and it's almost ready....
READ MORE
MEMBERS ONLY

RECORD HIGH IN CRUDE OIL CONTRIBUTES TO STOCK BREAKDOWN -- DOW AND S&P BREAK 50-DAY AVERAGES -- NASDAQ 100 IS THREATENING 200-DAY LINE -- HISTORY SHOWS THAT NASDAQ UNDERPERMANCE IS DANGEROUS
by John Murphy,
Chief Technical Analyst, StockCharts.com
CRUDE OIL ACHIEVES NEW RECORD ... Crude oil jumped $1.40 today to break through its previous record set in late October. That puts oil in uncharted territory. While that helped energy stocks today, it had a very negative impact on the rest of the stock market. That wasn't...
READ MORE
MEMBERS ONLY

MY MARKET VIEWS AND RECOMMENDATIONS ARE ALL IN THE MARKET MESSAGE ARCHIVES
by John Murphy,
Chief Technical Analyst, StockCharts.com
WHAT TO DO?... With the stock market starting to look toppy, I've been surprised at the number of messages I've received asking what to do in an environment of a weak dollar, rising commodities, rising interest rates, and a peaking stock market. Surprised because that'...
READ MORE
MEMBERS ONLY

MARKET CONTINUES TO FALL ON RISING VOLUME -- HOW TO SPOT NEGATIVE DIVERGENCE WITH OVERLAY CHARTS
by John Murphy,
Chief Technical Analyst, StockCharts.com
HEAVIER TRADING ON DOWN DAYS ... One of the market's problems is the fact that the volume pattern has turned negative. The previous week's upside breakout to new highs by the S&P 500 took place on light volume. Last week's downturn came on...
READ MORE
MEMBERS ONLY

WEEKLY INDICATORS ARE ROLLING OVER -- WHY THE FOUR-YEAR CYCLE MAY BE PEAKING -- SIMILARITIES TO THE 1970S
by John Murphy,
Chief Technical Analyst, StockCharts.com
WATCH OUT FOR DIVERGENCES IN WAVE FIVE ... Last Friday I expressed my belief that the cyclical bull market that began in October 2002 had probably ended. That belief was based partially on my Elliott wave view that the fifth and final upwave that started last summer had ended. I also...
READ MORE
MEMBERS ONLY

TRADE DEFICIT HURTS DOLLAR AND PUSHES COMMODITIES HIGHER -- BOND YIELDS SURGE AGAIN -- MATERIALS ARE STRONG WHILE FINANCIALS ARE WEAK -- INTEL FALL HURTS CHIPS -- IT LOOKS LIKE ANOTHER MARCH TOP
by John Murphy,
Chief Technical Analyst, StockCharts.com
BOND YIELDS BREAKOUT ... With each passing day the headlines get worse for the dollar, bonds, and stocks while supporting rising commodities and stocks tied to those commodities. That's an intermarket recipe for building inflation pressures with higher interest rates, which may have already ended the cyclical bull market...
READ MORE
MEMBERS ONLY

UPSIDE BREAKOUT IN BOND YIELDS RATTLES MARKET -- RATE SENSITIVE STOCKS LEAD DECLINE -- EVEN ENERGY WEAKENS
by John Murphy,
Chief Technical Analyst, StockCharts.com
TEN-YEAR T-NOTE YIELD BREAKS THROUGH DECEMBER HIGH ... With all of the leading indicators of inflation pointing upward, it was just a matter of time before long-term rates started to rise as well. They did it today in a big way. Chart 1 shows the ten-year T-...
READ MORE
MEMBERS ONLY

RISING RATES ARE ALREADY HURTING FINANCIALS WHICH ARE USUALLY THE FIRST STOCKS TO PEAK -- THE SCALE HAS TIPPED IN FAVOR OF INFLATION
by John Murphy,
Chief Technical Analyst, StockCharts.com
THEY'RE USUALLY THE FIRST TO PEAK ... From an intermarket perspective, there are three things that have historically led to market tops. The first two are a falling dollar and rising commodities. We've had those two for some time. The third thing is an upturn in long-...
READ MORE
MEMBERS ONLY

BREAKOUT IN BOND YIELDS HURTS REITS WHICH HAVE BEEN FALLING SINCE THE START OF 2005 -- JAPANESE MARKETS ARE RISING
by John Murphy,
Chief Technical Analyst, StockCharts.com
TEN-YEAR T-NOTE YIELD HITS SEVEN-MONTH HIGH ... It may have been the recent rise in commodity prices to 24-year highs and weakness in the dollar. Or it may have been economists' raising their 2005 forecast for economic growth. It may even be the fact that the...
READ MORE
MEMBERS ONLY

CRUDE OIL TESTS RECORD HIGH NEAR $55 -- NASDAQ DOESN'T BUILD ON YESTERDAY'S RALLY -- S&P 500 BREAKOUT LACKS VOLUME
by John Murphy,
Chief Technical Analyst, StockCharts.com
CRUDE OIL TESTING OCTOBER HIGH ... Earlier today I wrote about how another drop in the U.S. Dollar was giving a big boost to gold and most other commodities. Gold closed $5 higher along with rising gold stocks. Both have achieved short-term bullish breakouts. The CRB Index climbed over...
READ MORE
MEMBERS ONLY

GOLD STOCKS RISE AS DOLLAR FALLS -- EURO HITS TWO MONTH HIGH -- CANADIAN ISHARES EXCEED 2000 PEAK AND RISE ALONG WITH COMMODITIES
by John Murphy,
Chief Technical Analyst, StockCharts.com
GOLD SHARES RISE ALONG WITH THE EURO... More dollar selling is boosting gold prices more than $3 higher today (Chart 1). The Gold/Silver (XAU) Index has already broken out to a new three-month high. Since gold stocks usually rise faster than bullion, an upside breakout in the yellow...
READ MORE
MEMBERS ONLY

TECHNOLOGY FINALLY SHOWS SOME BOUNCE -- NASDAQ INDEXES CLEAR 50-DAY AVERAGE -- INTEL BREAKS OUT WHILE CISCO AND ORACLE ADVANCE -- PROFIT-TAKING IN ENERGY
by John Murphy,
Chief Technical Analyst, StockCharts.com
PROFIT-TAKING IN ENERGY ... Last week I wrote about the fact the Oil Service Holders (OIH) were in an overbought condition and up against chart resistance formed during 2000 at the 100 level. Prices backed off from that level last Monday. After a low-volume retest of that level again...
READ MORE
MEMBERS ONLY
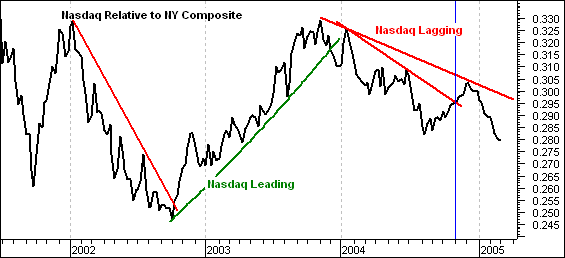
NASDAQ VERSUS NEW YORK
This chart shows the performance of the Nasdaq relative to the NYSE Composite. The market as a whole usually does better when the Nasdaq leads (green trendlines) and worse when the Nasdaq lags (red trendlines). Even though the NYSE Composite is performing well in the face of Nasdaq weakness, it...
READ MORE
MEMBERS ONLY
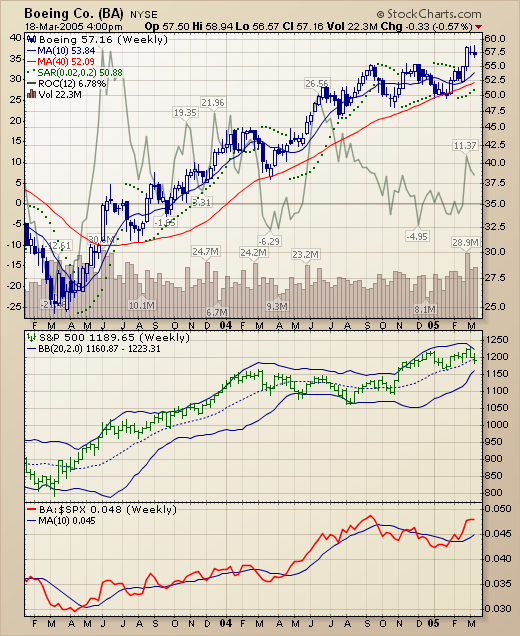
DVY: DIVIDEND-PAYING ETF
Many ETFs (Exchange Traded Funds) pay dividends, but only one is devoted to dividend-paying stocks -- the Dow Jones Select Dividend Index Fund (DVY). As the name implies, this ETF is derived from the Dow Jones Select Dividend Index ($DJDVY), an index constructed and maintained by Dow Jones.
The Index...
READ MORE
MEMBERS ONLY

LONG TERM WEDGE PATTERN LOOMING
The recent rally to new yearly highs hasn't materialized in all the major indices. In fact, the Nasdaq Composite has lagged rather badly; thus it is either 'poised to catch up' or it will become the leaders once the cyclical bull market ends. We dont know...
READ MORE
MEMBERS ONLY
SHARPCHARTS 2 ROAD MAP
- We are getting close to the final release of our new charting engine called SharpCharts2. But before we make SharpCharts2 the "official" charting engine on our website, we have to make sure that it is rock solid. To do that, we've been releasing better and better...
READ MORE
