MEMBERS ONLY

DNA WEIGHS ON BIOTECHS -- BUT NO SERIOUS CHART DAMAGE HAS BEEN DONE YET

by John Murphy,
Chief Technical Analyst, StockCharts.com
DNA DISAPPOINTS ... Yesterday I showed Genentech (DNA) testing chart resistance along its autumn high near 55. After the close, the big biotech company reported strong earnings but apparently not enough to impress the market. As a result, the stock has gapped down 4.4% today. The downside action has prevented...
READ MORE
MEMBERS ONLY

BIOTECHS ARE HAVING ANOTHER STRONG DAY
by John Murphy,
Chief Technical Analyst, StockCharts.com
BIOTECH INDEX NEARS ANOTHER UPSIDE BREAKOUT... After retesting its 50-day average last week, the Biotech Index is nearing another upside breakout. It's within a couple of points of its December peak near 550. Its relative strength line also looks encouraging. It bottomed during August (see first arrow)...
READ MORE
MEMBERS ONLY

OIL JUMP ATTRACTS BUYING INTO ENERGY PATCH -- GOLD STOCKS ARE IN SUPPORT AND OVERSOLD
by John Murphy,
Chief Technical Analyst, StockCharts.com
MAY MAY BE TURNING HIGHER... In my last article on energy, I wrote that I thought crude oil would find a floor above $40. So far, that new floor has held. After a successful retest of its early December low, crude oil traded over $47 today and is trying to...
READ MORE
MEMBERS ONLY

MARKET TRYING TO STABILIZE AT TRENDLINE AND MOVING AVERAGE SUPPORT
by John Murphy,
Chief Technical Analyst, StockCharts.com
DOW AND S&P 500 BOUNCING OFF 50-DAY LINES... The major stock indexes are trying to stabilize at initial moving average and trendline support. The Dow is holding above its 50-day average, while the S&P 500 is bouncing off that support line. I wrote on...
READ MORE
MEMBERS ONLY
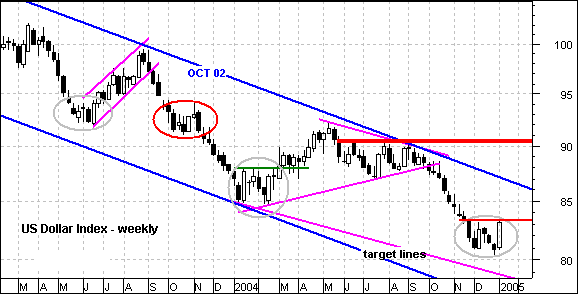
US DOLLAR
The Dollar may be giving us something to talk about.... and possibly even worthy of a short-term play. The US Dollar Index has consolidated for 4-5 weeks and formed long white candlesticks twice. These show strong buying pressure and, at the very least, reinforce support just above 80....
READ MORE
MEMBERS ONLY
SENTIMENT: A SUDDEN ATTITUDE ADJUSTMENT
There has been a lot of concern among analysts that sentiment has been too bullish; however, the recent correction has done a lot to alleviate that condition.
The American Association of Individual Investors (AAII) performs an electronic sentiment poll every week. The cutoff is Wednesday and the results are published...
READ MORE
MEMBERS ONLY
OUTPERFORMING THE INDICES IN 2005
Last week's stock market correction was significant in our opinion; for the technical patterns suggest the correction will continue in the weeks ahead. But more significant in the fact that if the correction extends sufficiently below certain levelsthen the entire rally cycle off the October-2002 is complete....
READ MORE
MEMBERS ONLY
S&P GIVES FIRST WEEK WARNING
The S&P 500 ended the week with a loss of nearly 30 points (-2.4%). According to the historical record since 1950, a down close during the first week of January by the S&P 500 has resulted in a down year 45% of the time. A...
READ MORE
MEMBERS ONLY
Hello Fellow ChartWatchers!
Our first issue of 2005 kicks off with a great summary of the recent S&P action by John Murphy. Richard Rhodes then looks at last week's correction. Carl Swenlin examines the recent change in investor sentiment and Arthur Hill wraps things up with a look at...
READ MORE
MEMBERS ONLY

DOWN MARKET DURING FIRST WEEK OF JANUARY IS AN EARLY WARNING -- WALGREEN AND GENERAL MILLS LEAD CONSUMER STAPLES HIGHER -- WHY THE BEST BUY MAY BE CASH
by John Murphy,
Chief Technical Analyst, StockCharts.com
CONSUMER STAPLES ARE TOP SECTOR FOR THE WEEK ... While all of the other market sectors lost ground this week, consumer staples suffered the least damage and even eked out a minor gain. It was also Friday's biggest gainer in the face of another losing day. That makes sense...
READ MORE
MEMBERS ONLY

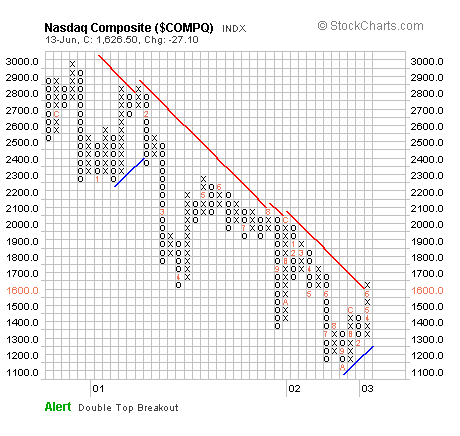
SUPPORT LEVELS FOR THE NASDAQ COMPOSITE AND RUSSELL 2000 SMALL CAP INDEX
by John Murphy,
Chief Technical Analyst, StockCharts.com
NASDAQ COMPOSITE SUPPORT... Yesterday I showed support levels for the Dow, the S&P 500, and the Nasdaq 100. So far, none of those support levels have been broken in today's trading. I've been asked to give a few more and here they are. The...
READ MORE
MEMBERS ONLY

WHY A LOSING FIRST WEEK OF YEAR ISN'T GOOD -- A STUDY OF JANUARY'S PREDICTIVE VALUE -- YEARS ENDING IN FIVE ARE USUALLY GOOD -- BUT FIRST YEARS OF PRESIDENTIAL CYCLES AREN'T -- WHY JANUARY IS THE BEST MONTH TO TAKE PROFITS
by John Murphy,
Chief Technical Analyst, StockCharts.com
THE JANUARY BAROMETER... You're going to be hearing a lot over the next few days and weeks about the importance of the month of January in determining stock market trends for the rest of the year. There are two January signals that I'd like to explain...
READ MORE
MEMBERS ONLY

SUPPORT LEVELS FOR MAJOR STOCK INDEXES
by John Murphy,
Chief Technical Analyst, StockCharts.com
DOW SUPPORT LEVELS... I've been asked to show where underlying support levels are located for the major stock indexes. I'm using daily bars and point & figure charts to identify where the support levels are found. Chart 1 shows the 50-day average for the Dow...
READ MORE
MEMBERS ONLY

WILSHIRE 5000 HAS RETRACED 62% OF BEAR MARKET AND MAY BE AT OR NEAR MAJOR TOP
by John Murphy,
Chief Technical Analyst, StockCharts.com
WILSHIRE 5000 HAS RETRACED 62% OF BEAR TREND... One of the problems with doing a chart analysis of the "market" is knowing which market index to use. No one stock index speaks for the entire market. There is one, however, that a number of readers have asked about...
READ MORE
MEMBERS ONLY

ROTATION OUT OF FORMER LEADERS CONTINUES -- BIOTECHS ARE DAY'S TOP GROUP -- INTERNET AND RETAILERS BREAK 50-DAY AVERAGES
by John Murphy,
Chief Technical Analyst, StockCharts.com
BIOTECHS ARE BOUNCING AGAIN... After pulling back to its 50-day average, the Biotechnology Index (BTK) is bouncing again. So much so that it's the day's top group. Early last week, I showed the BTK breaking through resistance near 540. It's dipped back below...
READ MORE
MEMBERS ONLY

REITS FALL ON FEAR OF RISING RATES -- SMALL CAPS AND NASDAQ LOSE LEADERSHIP ROLE -- JANUARY IS A GOOD TIME TO RAISE CASH WHICH ISN'T TRASH ANYMORE
by John Murphy,
Chief Technical Analyst, StockCharts.com
INDIVIDUAL REITS ARE FALLING ON VOLUME... Earlier today, I showed the Morgan Stanley REIT Index (RMS) and a leading REIT ETF breaking their 50-day day moving averages on rising volume. Here's a closer look at where most of the selling is coming from. The first three charts...
READ MORE
MEMBERS ONLY

AIRLINES AND REITS TUMBLE
by John Murphy,
Chief Technical Analyst, StockCharts.com
DELTA SLASHES FARES... Delta's announcement of a 50% rate cut in domestic airline fares is killing the airlines today. The Airline Index (XAL) is tumbling 7% today as the entire group is being sold heavily. Chart 1 shows the Airline Index crashing through its 50-day moving average...
READ MORE
MEMBERS ONLY

THE VIX IS STARTING TO RISE -- CONTRARY TO POPULAR OPINION, IT'S DONE A GOOD JOB SO FAR
by John Murphy,
Chief Technical Analyst, StockCharts.com
VIX REACHES TWO-MONTH HIGH... It's been a long time since I've written about the CBOE Volatility (VIX) Index. A lot of people have dismissed it as no longer having any forecasting value. That may explain why we haven't heard much about its recent...
READ MORE
MEMBERS ONLY

CHIP BREAKDOWN AND FALLING SUNW PULL NASDAQ LOWER -- QQQQ TESTING SUPPORT
by John Murphy,
Chief Technical Analyst, StockCharts.com
SEMICONDUCTORS BREAK DOWN ... Semiconductor stocks are having a very bad chart day. Chart 1 shows the Semiconductor (SOX) Index shattering its 50-day moving average and a rising support line drawn under its September/October lows. The recent failed attempt by the SOX to stay over its 200-day moving...
READ MORE
MEMBERS ONLY

DOLLAR RALLY CAUSES SELLING OF BASIC MATERIALS AND CANADA AS COMMODITIES DROP
by John Murphy,
Chief Technical Analyst, StockCharts.com
MORE DOLLAR BUYING ... As the dollar continues the new year rally, foreign currencies continue to weaken. The Euro is moving down for a test of its December low and its 50-day average. Its daily MACD lines have issued a short-term sell signal (Chart 1). The Japanese yen is...
READ MORE
MEMBERS ONLY

WHILE WORLD STOCK MARKETS ARE OVERBOUGHT, JAPAN PROVIDES GLOBAL VALUE
by John Murphy,
Chief Technical Analyst, StockCharts.com
WORLD INDEX IS OVERBOUGHT ... The Dow Jones World Index is now in overbought territory. Chart 1 compares the 14-week RSI oscillator to the Index since 1998. An overbought reading occurs when the RSI is over 70. A oversold reading occurs when it's under 30. The weekly RSI...
READ MORE
MEMBERS ONLY

DOLLAR BOUNCE CAUSES GOLD AND OIL SELLING -- WALGREEN LEADS RETAIL ADVANCE
by John Murphy,
Chief Technical Analyst, StockCharts.com
DOLLAR RALLIES... The first day of trading in the new year is witnessing a bounce in the dollar and selling in foreign currencies. The Euro has been the only major foreign currency to reach a new high during December. But that move to a new high hasn't been...
READ MORE
MEMBERS ONLY

WHY I DON'T THINK THE S&P HAS COMPLETED A HEAD AND SHOULDERS BOTTOM -- BUT CHART WORK DEALS WITH PROBABILITIES NOT CERTAINTIES -- HAPPY NEW YEAR
by John Murphy,
Chief Technical Analyst, StockCharts.com
AN ALTERNATE VIEW ... I've written many times over the last few months about my view that the cyclical bull market in stocks has entered a fifth (and final) upleg. That's based on the Elliott Wave approach that holds that bull markets take place in five waves...
READ MORE
MEMBERS ONLY

RECENT GOLD SELLING MAY BE HINTING AT INTERIM DOLLAR BOTTOM IN NEW YEAR
by John Murphy,
Chief Technical Analyst, StockCharts.com
REVUE OF NOVEMBER 24 MESSAGE... A number of readers have asked about the recent action in gold and the dollar -- especially after yesterday's $8.00 drop in bullion. Some wondered if the pullback in gold was warning of a bounce in the dollar. The answer is probably yes....
READ MORE
MEMBERS ONLY

AEROSPACE/DEFENSE STOCKS COME UNDER PRESSURE -- LOCKHEED MARTIN IS BIGGEST LOSER -- HOW TO PLOT RELATIVE STRENGTH RATIOS
by John Murphy,
Chief Technical Analyst, StockCharts.com
LOCKHEED MARTIN LEADS DEFENSE STOCKS LOWER... Aerospace/defense stocks ave been among the year's top performers. Not anymore. The group has been losing ground lately, but is being hit especially hard today. The biggest loser is Lockheed Martin. Chart 1 shows the stock gapping down to a two-...
READ MORE
MEMBERS ONLY

FEAR OF YEAREND JAPANESE YEN SELLING BOOSTS DOLLAR AND CAUSES SELLING OF GOLD
by John Murphy,
Chief Technical Analyst, StockCharts.com
FEAR OF JAPANESE SELLING ... The Japanese yen is falling today. Rumors that the Japanese central bank may use the thinly-traded week to do some yearend intervening has caused nervous selling by currency traders. The yen has fallen to the lowest level in a year against the Euro. Chart 1...
READ MORE
MEMBERS ONLY

AMAZON SURGES -- SCHERING PLOUGH, GENERAL MILLS, AND USF CORP NEAR BULLISH BREAKOUTS -- TRANSPORTS TEST 1999 HIGH
by John Murphy,
Chief Technical Analyst, StockCharts.com
AMAZON BREAKS OUT ON GOOD VOLUME... Amazon.com is today's standout stock performer on the Nasdaq market. News of a strong holiday season is pushing the stock through two important resistance barriers -- its September peak and its 200-day moving average. The two big volume bars reflect heavy...
READ MORE
MEMBERS ONLY

BIOTECHS ARE BREAKING OUT
by John Murphy,
Chief Technical Analyst, StockCharts.com
BIOTECH INDEX COMPLETES BULLISH TRIANGLE... The last time I looked at the Biotech Index, I described it as a potential "ascending triangle" as shown in Chart 1. That pattern is identified by two converging trendlines with the upper line flat and the lower line rising -- and is usually...
READ MORE
MEMBERS ONLY

DOW STARTING TO SHOW LEADERSHIP -- NEW DOW LEADERS ARE CITIGROUP, DUPONT, AND 3M -- DOW IS NOW IN FIFTH WAVE ADVANCE
by John Murphy,
Chief Technical Analyst, StockCharts.com
DOW STARTING TO OUTPERFORM NASDAQ ... I mentioned yesterday that the Dow Industrials were starting to catch up with the rest of the market after reaching a three-year high on Tuesday. Actually there's more to it than that. If the Dow is starting to do better than the...
READ MORE
MEMBERS ONLY

BIG DROP IN OIL BOOSTS AIRLINES AND MARKET -- PHARMA HOLDERS ARE TOP ETF -- INTEL PULLS SOX HIGHER -- MAY LEADS RETAIL BOUNCE -- DOW HITS THREE-YEAR HIGH
by John Murphy,
Chief Technical Analyst, StockCharts.com
DRUGS ARE LEADING MARKET HIGHER... In a continuation of yesterday's rebound in the big drug stocks, the Pharm Holders are the day's top sector ETF. Chart 1 shows them rebounding smartly off their 50-day moving average. Pfizer continues to lead the rebound with others that...
READ MORE
MEMBERS ONLY

REVIEW OF NBR CONSUMER STAPLE AND DRUG STOCK PICKS -- SHORT TERM OVERBOUGHT BUT LONGER TERM BULLISH
by John Murphy,
Chief Technical Analyst, StockCharts.com
ABBOTT LABS IS SHORT-TERM OVERBOUGHT ... During my TV appearance on the Nightly Business Report last Friday evening, I gave five stock recommendations. All five were in the consumer staple and drug groups and had been shown here over the previous week. As I was mentioning the stocks, NBR showed...
READ MORE
MEMBERS ONLY

SANTA CLAUS RALLY MAY BE STARTING -- PFIZER BOUNCE HELPS THE DRUGS AND THE DOW -- INTEL REBOUND SHOULD HELP THE SOX
by John Murphy,
Chief Technical Analyst, StockCharts.com
LAST FIVE DAYS OF THE YEAR... The traditional Santa Claus rally may be starting. According to the Stock Traders Almanac, the Santa Claus rally is a "short, sweet, respectable rally within the last five (trading) days of the year and the first two in January". The Almanac points...
READ MORE
MEMBERS ONLY

EARLY VOLUME SURGE
It is shaping up to be a banner month for December volume. On this chart, the vertical black line shows the beginning of December, the red line the end of December (D) and the green line the end of January (J). Over the last three years, there was strong volume...
READ MORE
MEMBERS ONLY

DOLLAR TRYING TO BOTTOM
The daily chart of the US Dollar Index shows that the dollar is trying to put in a bottom. The encouraging signs are that the 9-year low earlier this month survived a sharp retest this week, the index has broken above the short-term declining tops line, and there...
READ MORE
MEMBERS ONLY

Long-term Oil vs. Gold
Today we take a very long-term look at the relative valuation of integrated oil-related shares in comparison to gold shares ($XOI/$HUI). After the very long rise in gold shares in both absolute and relative terms; we find the present time is opportune to prune back long gold...
READ MORE
MEMBERS ONLY

RATES SHOULD BE MOVING HIGHER
This time last year I wrote about my expectation for long-term interest rates to start moving higher during 2004. I got it only half right. They moved higher during the first half, but then fell back during the second half. It looks like bond yields will end the year...
READ MORE
MEMBERS ONLY
Hello Fellow ChartWatchers!
Chip's personal message goes here, talking about what John Murphy, Richard Rhodes, Carl Swenlin and the rest of the gang have to say in this issue. This segment should be limited to a couple sentences... we want to keep people engaged with concise text that is valuable and...
READ MORE
MEMBERS ONLY

NBR INTERVIEW TONIGHT -- DOW AND NASDAQ ARE TESTING OIL HIGHS -- BE CAREFUL HERE
by John Murphy,
Chief Technical Analyst, StockCharts.com
TV INTERVIEW TONIGHT ON CHANNEL 13 ... I'll be doing an interview with Paul Kangas on the Nightly Business Report this evening. The shows airs on Channel 13 and runs from 6:30 to 7:00 pm (NYT). The guest is usually interviewed in the second half of the...
READ MORE
MEMBERS ONLY

WHY BOND YIELDS HAVE STAYED SO LOW FOR SO LONG -- AND WHY THEY SHOULD START RISING -- RISING RATES AND OIL COULD CAUSE MARKET PROBLEMS IN THE NEW YEAR
by John Murphy,
Chief Technical Analyst, StockCharts.com
RATES SHOULD BE MOVING HIGHER... This time last year I wrote about my expectation for long-term interest rates to start moving higher during 2004. I got it only half right. They moved higher during the first half, but then fell back during the second half. It looks like bond...
READ MORE
MEMBERS ONLY

PLUNGE IN PFIZER UNSETTLES DRUG ETFS -- BUT MOST DRUG LEADERS ARE HOLDING UP OK
by John Murphy,
Chief Technical Analyst, StockCharts.com
PFIZER PLUNGES 14%... Today's news that Pfizer's drug Celebrex may increase the risk of heart attacks took the stock -- and the drug group -- completely by surprise this morning. Chart 1 shows today's plunge to a new low by Pfizer. Several other drug stocks are...
READ MORE
