MEMBERS ONLY
Hello Fellow ChartWatchers!
All-in-all, last week was a down week for the major market averages. While the Dow managed to eek out a tiny gain, the other indices fell with the Nasdaq (-2.79%) leading the way. So far this year, the energy-heavy Amex Composite (+5.64%) and the Russell...
READ MORE
MEMBERS ONLY

ROTATION OUT OF FINANCIALS AND INTO DRUGS -- AMD AND INTEL PULL SOX LOWER -- RISING DRG/SOX RATIO SIGNALS DEFENSIVE MARKET MOOD

by John Murphy,
Chief Technical Analyst, StockCharts.com
BUYING DRUGS WITH BANK MONEY... The impact of rising interest rates continues to cause rotations between stock market groups. One need only to look at today's strongest and weakest Dow stocks to see what's happening. Citigroup was the Dow's biggest percentage loser and fell...
READ MORE
MEMBERS ONLY

DEFENSIVE MONEY IS MOVING TO DRUGS
by John Murphy,
Chief Technical Analyst, StockCharts.com
PHARMA HOLDERS ARE UP... Pharmaceutcial stocks are rallying today in the face of a weak stock market. Among sector ETFs, the AMEX Pharm Holders are in the top spot. The daily bars in Chart 1 show the PPH breaking through its 50-day average on rising volume. Its relative strength...
READ MORE
MEMBERS ONLY

SURGE IN RATES PUNISHES STOCKS -- FINANCIALS, UTILITIES, AND GOLD ARE HARDEST HIT -- S&P 500 BREAKS 50-DAY AVERAGE
by John Murphy,
Chief Technical Analyst, StockCharts.com
STRONG RETAIL REPORT PUSHES YIELDS SHARPLY HIGHER... The market may have reached the point where good news is becoming bad news. We got a sample of that today. A 1.8% jump in March retail numbers was three times more than economists were expecting, and the biggest jump in a...
READ MORE
MEMBERS ONLY

SURGING BOND YIELDS HURT RATE-SENSITIVE UTILITIES AND FINANCIALS -- RISING DOLLAR HURTS GOLD -- MONEY STILL MOVING INTO ENERGY
by John Murphy,
Chief Technical Analyst, StockCharts.com
STRONGER-THAN-EXPECTED RETAIL SALES PUSHES RATES HIGHER... The main catalyst for this morning's jump in interest rates -- and selling in stocks -- was the U.S. March retail sales report which was the biggest in a year. That sign of economic strength had the immediate effect of pushing...
READ MORE
MEMBERS ONLY

MARKET RALLY REMAINS STALLED HEADING INTO EASTER WEEKEND -- WAL MART HURTS DOW WHILE YAHOO BOOSTS INTERNET -- BOND YIELDS HEADED HIGHER
by John Murphy,
Chief Technical Analyst, StockCharts.com
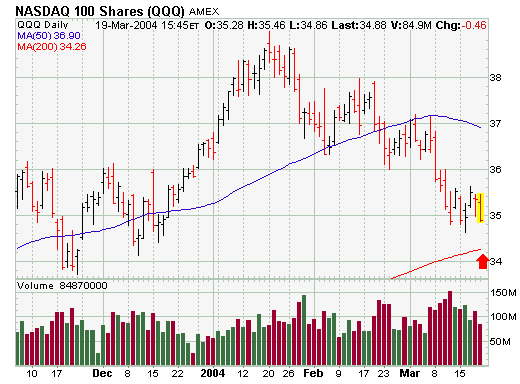
STILL IN OVERBOUGHT CONDITION... The stock market closed mixed on Thursday after opening higher. This is consistent with a market that's in a short-term overbought condition. On Wednesday, I showed the Nasdaq 100 in that condition. The S&P 500 looks pretty much the same. The...
READ MORE
MEMBERS ONLY

ALCOA AND SEAGATE FALL -- NASDAQ IS OVERBOUGHT -- OIL AND GOLD JUMP -- NOBLE BOUNCES -- BOND YIELDS TEST FOUR-YEAR TRENDLINE
by John Murphy,
Chief Technical Analyst, StockCharts.com
SEAGATE FALLS ON HEAVY VOLUME... Yesterday bad news from Nokia unsettled the technology sector. Today it was Seagate Technology. The stock opened sharply lower and fell to the lowest level in ten months. Volume was heavy. Although the stock closed near the top of its daily range, the heaviest volume...
READ MORE
MEMBERS ONLY

NIKKEI 225 TESTING 2002 HIGH NEAR 12K -- RAILS AND TRUCKS LEAD TRANSPORTS HIGHER -- SIMON PROPERTY LEADS REITS LOWER -- NOKIA TUMBLE PULLS TXN DOWN -- BDK, CMI, AND K HIT MULT-YEAR HIGHS --CONSUMER DISCRETIONARY ETF NEAR UPSIDE BREAKOUT
by John Murphy,
Chief Technical Analyst, StockCharts.com
DOW TRANSPORTS HIT TWO-MONTH HIGH... While the rest of the market saw some profit-taking, transportation stocks continued to rise. The Dow Transports rose above their February peak to reach the highest level since late January. Its relative strength continues to rise as well. Today's biggest push...
READ MORE
MEMBERS ONLY

BIOTECHS LEAD HEALTHCARE HIGHER -- EQUITY OFFICE PROP HURTS REITS
by John Murphy,
Chief Technical Analyst, StockCharts.com
REITS ARE DROPPING -- LED BY EQUITY OFFICE PROP... Since the start of the year, Real Estate Investment Trusts (REITs) have been one of the market's stongest groups. Until now. The slide in this rate-sensitive group started on Friday when bond yields surged on the strong jobs report....
READ MORE
MEMBERS ONLY

$XAU LAGGING GOLD BULLION
The Philadelphia Gold Index, $XAU, is usually a better predictor of gold than gold is of $XAU. The top chart shows $XAU relative to gold or the "price relative". Notice that XAU performs best when the price relative rises ($XAU outperforming gold) and the price relative can be...
READ MORE
MEMBERS ONLY
NEW DECISION POINT INDICATOR: PMM
Does the world really need another indicator? Well, this is one we have been collecting data on for years, but we just recently started charting it because we discovered it presents a good picture of internal market strength or weakness.
Our Price Momentum Model (PMM) is a simple but effective...
READ MORE
MEMBERS ONLY
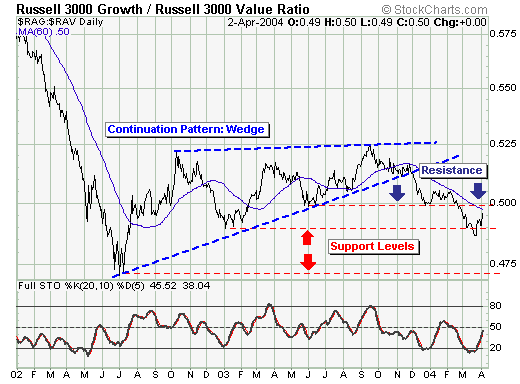
LOOKING AT THE RUSSELL 300 "GROWTH VS. VALUE" RATIO
In terms of gauging the current substantial rally, we should look at the relative performance of the "growth" and "value" components thereof. In effect, if we are bullish, then we want to be long that which is outperforming. This is fairly simple.
Thus, when we look...
READ MORE
MEMBERS ONLY
CALENDAR CONTROLLERS
CALENDAR CONTROLLERS ADDED TO SC3 BETA - We aren't rolling out lots of new features this week like we have in weeks past, however we did manage to add two very neat icons to the "User-Defined" Duration section of the SharpCharts2 Beta page. Clicking on either...
READ MORE
MEMBERS ONLY

RISING RATES HURTS BANKS AND HOMEBUILDERS
10-YEAR YIELDS SOAR OVER 4%... While today's surprisingly strong jobs report was good for stocks, it was very bad for bonds. Bond prices fell more than two full points. The 10-year T-note, which rises when prices fall, surged all the way to 4.14%. That...
READ MORE
MEMBERS ONLY
Hello Fellow ChartWatchers!
The markets are rebounding strongly right now and trying to put the declines from February and March behind them. Most of the major averages moved back above their 50-day Moving Average on Friday (not the Dow though...). Smart ChartWatchers will be watching closely this week to see if this...
READ MORE
MEMBERS ONLY

JUMP IN RATES HURTS FINANCIALS AND HOMEBUILDERs -- ADP AND SUNW LEAD S&P 500 HIGHER -- CHIP VS. BOND ETFs
by John Murphy,
Chief Technical Analyst, StockCharts.com
RATE-SENSITIVE STOCKS DROP... With interest rates jumping sharply today, rate-sensitive stocks are being sold. Chart 1 shows the Financials Select Sector SPDR falling beneath its 50-day line. Financials are the day's weakest group. Banks and brokers are being sold. So are stocks tied to housing....
READ MORE
MEMBERS ONLY

STRONG JOBS REPORT PUSHES STOCKS SHARPLY HIGHER -- BOND YIELDS JUMP OVER 4% -- STRONG DOLLAR PUSHES GOLD DOWN -- STRONG CHIP SALES BOOST SOX
by John Murphy,
Chief Technical Analyst, StockCharts.com
NASDAQ AND S&P 500 BREAK 50-DAY LINES -- SOX LEADS MARKET HIGHER... The economy created 308,000 new jobs during March which is the biggest monthly jump in four years and three times what economists were expecting. The intermarket reactions are dramatic, but not unexpected. Stocks are opening...
READ MORE
MEMBERS ONLY

TRANSPORTATION INDEX BREAKS 50-DAY AVERAGE -- RYDER REACHES NEW RECORD -- AMR BACK OVER 200-DAY AVERAGAE
by John Murphy,
Chief Technical Analyst, StockCharts.com
DOW TRANSPORTS TURNS UP... Last Friday I talked about how the drop in oil was giving a boost to the Dow Jones Transportation Average and was helping it bounce off its 200-day moving average. Earlier in the week, I showed the Transports testing their 50-day moving average. Chart...
READ MORE
MEMBERS ONLY

STRONG JOBS REPORT PUSHES MARKET HIGHER -- SOX LEADERSHIP CONTINUES -- JUMP IN TRANSPORTS BOOSTS INDUSTRIALS -- RISING RATES HURTS BANKS AND HOMEBUILDERS
by John Murphy,
Chief Technical Analyst, StockCharts.com
SOX PULLS NASDAQ HIGHER... A stunning jobs report today turned stocks sharply higher. The creation of 308,000 new jobs in March was the highest in four years and three times what economists were expecting. The intermarket reactions were predicable. Stocks jumped sharply while bonds fell. Rising rates pushed the...
READ MORE
MEMBERS ONLY

ENERGY SHARES DROP WITH CRUDE OIL --INTERNET LEADERSHIP CONTINUES -- EBAY HITS RECORD HIGH -- S&P 500 TESTS 50-DAY AVERAGE
by John Murphy,
Chief Technical Analyst, StockCharts.com
ENERGY SHARES DROP WITH CRUDE OIL... Crude oil fell another $1.46 today (-4%%) to drop to the lowest level in more than a month. That had a depressing effect on the Energy sector which was the day's weakest group. Chart 2 shows the Energy Select Sector SPDR...
READ MORE
MEMBERS ONLY

CHIPS LEADING MARKET HIGHER -- S&P 500 TESTING 50-DAY AVERAGE -- AMD AND TERADYNE ARE LEADERS
by John Murphy,
Chief Technical Analyst, StockCharts.com
SEMICONDUCTOR ISHARES TESTING 50-DAY AVERAGE... As it did last week, the semiconductor group is leading the Nasdaq (and the rest of the market) higher again. Chart 1 shows the day's strongest ETF -- the Semiconductor iShares -- challenging their 50-day moving average. A decisive close over that resistance...
READ MORE
MEMBERS ONLY

ENERGY SHARES RISE DESPITE OIL DROP -- PRECIOUS METALS GET HELP FROM RISING YEN -- FIRST QUARTER LEADERS WERE SMALL CAPS, ENERGY, AND COMMODITIES
by John Murphy,
Chief Technical Analyst, StockCharts.com
OIL PRICES SOFTEN -- PRECIOUS METALS RISE... OPEC announced plans to cut one million barrels a day from production. At the same time, the government announced a big jump in crude oil stockpiles in the week ending March 26. When all was said and done, crude oil prices fell 50 cents...
READ MORE
MEMBERS ONLY

INTERNET ETF EXCEEDS 50-DAY AVERAGE LED BY EBAY AND YAHOO -- OIL BOUNCES ON EVE OF OPEC MEETING -- NEWMONT MINING BREAKS OUT -- YEN MAY BE ON VERGE OF BREAKOUT
by John Murphy,
Chief Technical Analyst, StockCharts.com
INTERNET INDEXES SHOW NASDAQ LEADERSHIP... One of the ways to detect group leadership in an emerging uptrend is to see which groups rise above their 50-day moving averages first. Earlier today I showed the mid and small cap indexes doing just that, which puts them in a leadership role....
READ MORE
MEMBERS ONLY

SMALL CAPS SHOWING LEADERSHIP -- CHIP/ENERGY RATIO MAY DETERMINE MARKET DIRECTION -- SO WILL THE TRANSPORTS
by John Murphy,
Chief Technical Analyst, StockCharts.com
SMALL CAPS HIT THREE-WEEK HIGH... New signs of leadership by small and midsize stocks may hold good news for large-cap stocks. Chart 1 shows the S&P 600 Small Cap Index rising to a new three-week high after clearing its 50-day moving average. [The Russell...
READ MORE
MEMBERS ONLY

NASDAQ 100 LEADS MONDAY BOUNCE -- HEWLETT PACKARD LEADS DOW BOUNCE -- ROTATION FROM BONDS TO STOCKS
by John Murphy,
Chief Technical Analyst, StockCharts.com
QQQS CLEAR 20-DAY AVERAGE... As it did last week, the Nasdaq 100 is leading the rest of the market higher in Monday trading. Nasdaq leadership is a positive sign for the market. Chart 1 shows a number of positive short-term chart developments. The QQQs are rising over their...
READ MORE
MEMBERS ONLY

JAPANESE STOCKS RESUME UPTREND -- RISING YEN BOOSTS GOLD -- EUROPEAN STOCKS BOUNCE OFF 200-DAY LINES -- FALLING OIL HELPS THE TRANSPORTS
by John Murphy,
Chief Technical Analyst, StockCharts.com
JAPAN ISHARES RESUME UPTREND... With all of the recent concern about a global stock market correction, the Japanese market has been quietly resuming its uptrend. It was by far the world's strongest market this week. The weekly bars in Chart 1 show the AMEX Japan iShares climbing to...
READ MORE
MEMBERS ONLY

NASDAQ GAINS 3% TO LEAD RALLY - ROTATION FROM ENERGY A GOOD SIGN -- CITRIX AND CISCO ARE NASDAQ LEADERS
by John Murphy,
Chief Technical Analyst, StockCharts.com
NASDAQ GAINS 3%... Earlier today, I wrote about the Nasdaq market bouncing from important chart support near 1900 and spearheading a market upturn. In today's trading, the Nasdaq market gained more than 3% to lead the Dow and the S&P 500 into impressive gains of their...
READ MORE
MEMBERS ONLY

NASDAQ BOUNCING OFF 1900 - NSM AND TERADYNE LEAD CHIP BOUNCE -- CITRIX AND CISCO ARE NASDAQ LEADERS
by John Murphy,
Chief Technical Analyst, StockCharts.com
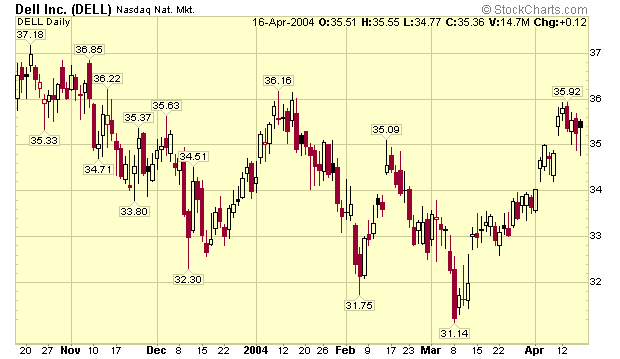
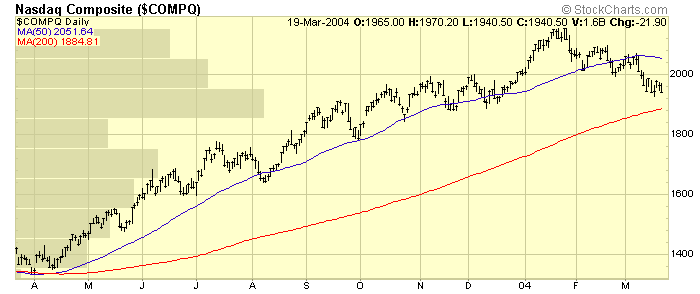
FINDING SUPPORT NEAR 200-DAY AVERAGE... Yesterday we showed the Nasdaq 100 Index bouncing off its 200-day moving average and its December low near 34. Today we're focusing on the Nasdaq Composite which is in a similar support area. Chart 1 shows the Nasdaq finding chart support...
READ MORE
MEMBERS ONLY

DRUG SELLING HURTS HEALTHCARE -- LILLY BREAKS DOWN -- TECHS LEAD BOUNCE -- DOW BOUNCES OFF 10K
by John Murphy,
Chief Technical Analyst, StockCharts.com
HEALTHCARE GROUP IS WEIGHED DOWN BY DRUGS... Healthcare is one of the day's weakest groups. Chart 1 shows the Healthcare iShares in the process of testing their 200-day moving average. Their relative strength line has been dropping since early February. Chart 2 shows that most of selling...
READ MORE
MEMBERS ONLY

MARKET LOSES ENERGY -- GOLDMAN SACHS PULLS BROKERS DOWN -- NASDAQ 100 BOUNCING OFF 200-DAY AVERAGE
by John Murphy,
Chief Technical Analyst, StockCharts.com
OIL SERVICE ETF LEADS ENERGY COMPLEX LOWER... Up until this week, Energy was one of the last remaining market sectors to buck the downtrend in the rest of the market. Not anymore. The Energy sector was the day's weakest group. The biggest loser in the oil patch was...
READ MORE
MEMBERS ONLY

PROFIT-TAKING HITS ENERGY SECTOR -- OVERSOLD SOX IS BOOSTING QQQs AT 200-DAY AVERAGE
by John Murphy,
Chief Technical Analyst, StockCharts.com
ENERGY ETF BREAKS 50-DAY LINE... The Energy sector was been one of the few sectors to withstand the market's downside correction. At least until now. In today's trading, Energy is the day's weakest sector. Part of that may be attributed to the fact...
READ MORE
MEMBERS ONLY

GLOBAL DOWNTURN DEEPENS -- SECTOR WEAKNESS -- VIX JUMPS OVER 20 WHICH IS A SIGN OF MORE STOCK WEAKNESS TO COME
by John Murphy,
Chief Technical Analyst, StockCharts.com
GLOBAL SLIDE STARTS IN ASIA... A 6% decline in the Taiwan stock market started a slide in Asian markets that spread to Europe and then the U.S. Chart 1 shows Hong Kong's Hang Seng Index falling to the lowest level in three months. In Chart 2, the...
READ MORE
MEMBERS ONLY

STOCKS RESUME DOWNTREND -- GOLD RISES $5.00 -- ANADARKO PETROLEUM BREAKS OUT-- SIEBEL BREAKS DOWN --- BROKERS AND SMALL CAPS BREAK SUPPORT -- NASDAQ NEARING 1900 LEVEL
by John Murphy,
Chief Technical Analyst, StockCharts.com
GOLD TESTING FEBRUARY HIGH... With stocks and the dollar falling today, gold prices are up $5. Chart 1 shows that bullion is now challenging its mid-February peak near $418. Gold stocks are rising as well. Last week we showed the XAU Index climbing back over its 50-day mooving...
READ MORE
MEMBERS ONLY

The AD Volume Lines
Breadth stats reflect continued preference to be overweight small and mid-caps, while underweight techs and large-caps. As the AD Volume Lines show, the S&P Midcap Index and S&P SmallCap Index remain the strongest. Both indicators for MID and SML remain above their 89-day...
READ MORE
MEMBERS ONLY

DETERMINING THE TREND AND CONDITION OF THE MARKET
The trend and condition of the market should dictate the kind of actions we will take, so these are the first things we should evaluate during the process of making investment/trading decisions. This process is necessary for all time frames, but for this article I will focus on the...
READ MORE
MEMBERS ONLY
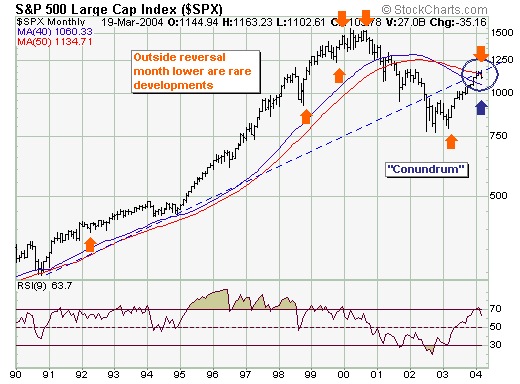
NOT YOUR "GARDEN VARIETY" CORRECTION
The past two-month trading period is one at the present time considered a "correction"; however, there are nascent signs it may be something quite a bit larger than just your "garden variety" correction. First, we note that trendline resistance is proving its merit by turning...
READ MORE
MEMBERS ONLY

WHAT'S NEW IN BETA 3
SHARPCHARTS2 BETA 3 - The improvements just keep coming! This week, we've added the Money Flow Index (see Chip's article above), Equivolume charting, support for annotations, the ability to email charts to others, the ability tostore charts in your browser's "bookmark" area, and...
READ MORE
MEMBERS ONLY
NASDAQ 100 LEADS MARKET LOWER.
NASDAQ 100 LEADS MARKET LOWER... The Nasdaq 100 QQQs were the worst percentage losers on Friday and reflected continuing weakness in the largest technology stocks. The daily chart shows the QQQ ending the week on a down note. The only saving grace was the relatively light volume. With the SOX...
READ MORE
MEMBERS ONLY
Hello Fellow ChartWatchers!
The current market pull-back is getting serious. Check out the current Nasdaq chart:
See the long "Price-by-Volume" bar sticking out from the left side of the chart around the 1900 level? That represents the largest support level for the Nasdaq during the course of the...
READ MORE
MEMBERS ONLY

SOX BREAKS DECEMBER LOW AND PULLS MARKET DOWN -- OIL IS NEARING A TEST OF ITS ALL-TIME HIGH AT $40 WHICH IS A DANGEROUS SITUATION FOR STOCKS AND THE ECONOMY
by John Murphy,
Chief Technical Analyst, StockCharts.com
SOX BREAKS DECEMBER LOW... Earlier in the week I suggested that the fate of the Nasdaq market was tied to the Semiconductor (SOX) Index which was trying to bounce off support at its December low. Unfortunately, the Semiconductor Index took a turn for the worst today and pulled the Nasdaq...
READ MORE
