MEMBERS ONLY

Week Ahead: NIFTY Likely to Continue Consolidating; May Stay Within Broad Trading Range

by Milan Vaishnav,
Founder and Technical Analyst, EquityResearch.asia and ChartWizard.ae
The equity markets consolidated throughout the week. Although they stayed within a narrow range and traded sideways for almost all days of the week, the Indices were devoid of any directional trend. Following strong weekly gains of over 1.58% in the week before, the NIFTY chose to remain in...
READ MORE
MEMBERS ONLY

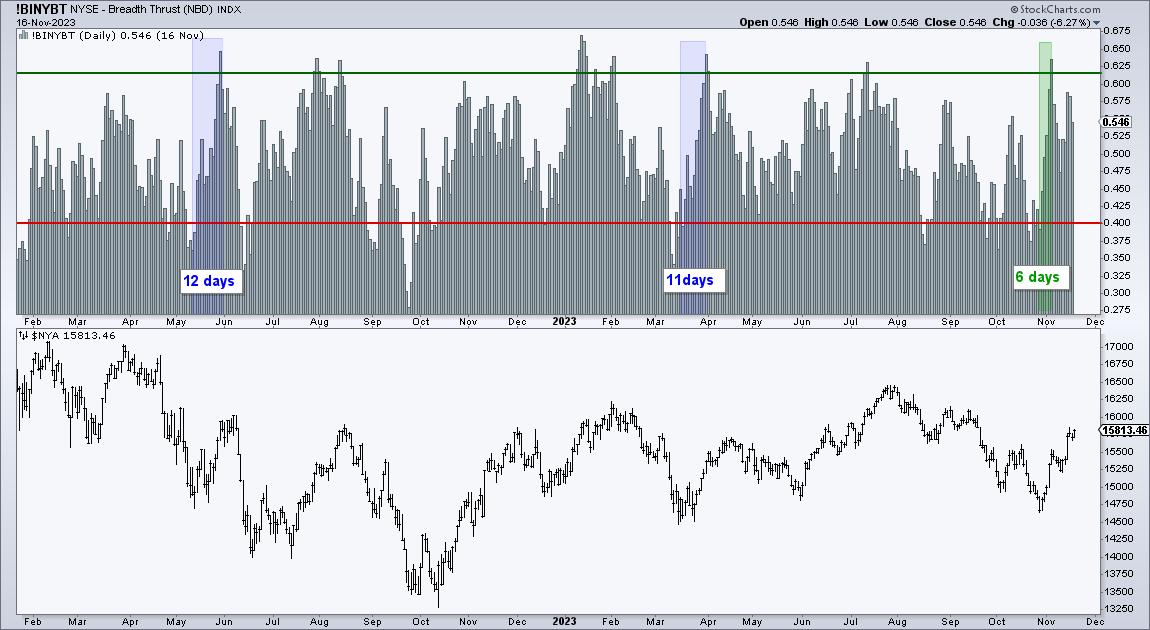
What Are The Chances Of A Market Crash? This Indicator Says ZERO!

by Tom Bowley,
Chief Market Strategist, EarningsBeats.com
We can use sentiment indicators for a lot of purposes. I routinely follow the 5-day SMA of the equity only put call ratio ($CPCE) to help spot short- to intermediate-term bottoms. It's not quite so effective at calling market tops, but it does work in that regard many...
READ MORE
MEMBERS ONLY

Long-term Breadth Indicators Hit Moment of Truth

by Arthur Hill,
Chief Technical Strategist, TrendInvestorPro.com
The percentage of stocks in long-term uptrends rebounded sharply in November and returned to the highs from late August and early September. This rebound is impressive, but the absolute levels are still not that inspiring. We need to see participation breakouts and higher participation levels to get the broad bull...
READ MORE
MEMBERS ONLY

Now is NOT the Time to Start a Long Trade - Be Patient!

by TG Watkins,
Director of Stocks, Simpler Trading
In this week's edition of Moxie Indicator Minutes, TG notes that the markets are deciding to hang on tight to their upper levels over the holiday week. He thinks we still need a pullback, but perhaps it will be more of a flag. Either way, initiating long trades...
READ MORE
MEMBERS ONLY

How RRG Helps Us Find Pair Trading Opportunities

by Julius de Kempenaer,
Senior Technical Analyst, StockCharts.com
KEY TAKEAWAYS
* DJ Industrials closing in on overhead resistance
* Weekly RRG showing some strong opposite rotations
* Identifying two potential pair trading setups (MSFT-MRK & NKE-CAT)
The Dow Jones Industrial Index ($INDU) is reaching overhead resistance between 35.5k and 35.7k, which means that upside potential is now limited. Even...
READ MORE
MEMBERS ONLY
Seasonality Points To Higher Prices NOW
by Tom Bowley,
Chief Market Strategist, EarningsBeats.com
I know we're in the midst of a powerful rally that began EXACTLY when seasonality suggested it would - at the close on October 27th. I discussed the very bearish seasonality leading up to that October 27th close in my article, "Odds Favor Further Selling This Week...
READ MORE
MEMBERS ONLY

Economic Modern Family -- Home for the Holidays
In the 1995 film, Home for the Holidays, family reunions are explored using both drama and comedy. The film illustrates how we outsiders looking in never really know the love and the madness that goes on inside any one family's home during Thanksgiving.
Happily, our Economic Modern Family...
READ MORE
MEMBERS ONLY
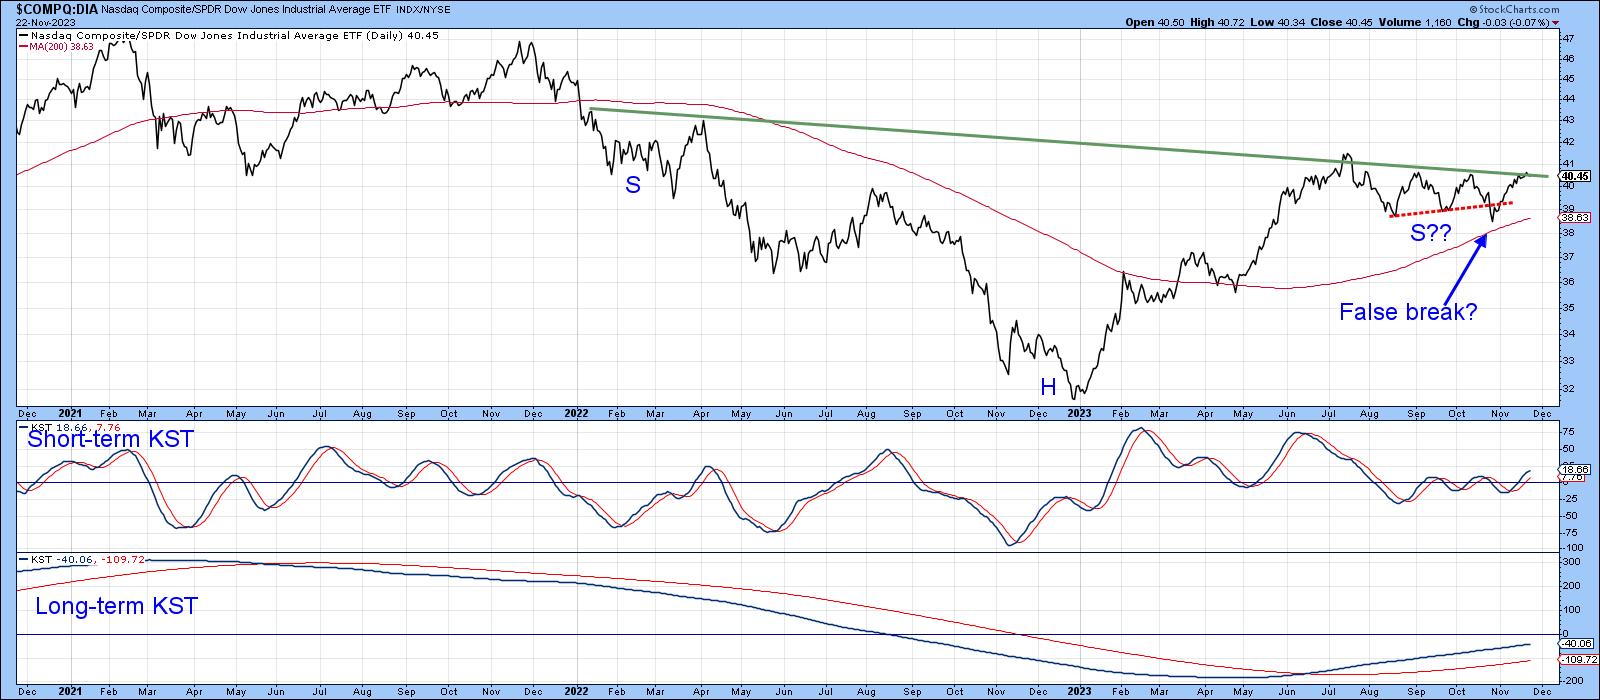
These Three Intermarket Relationships are at Key Juncture Points

by Martin Pring,
President, Pring Research
We spend a lot of time analyzing sector rotation, but there are also other relationships that can offer useful insights to internal market dynamics. One aspect of this is the relationship between market averages.
NASDAQ vs. the DJIA
As an example, Chart 1 plots the relationship between the NASDAQ Composite...
READ MORE
MEMBERS ONLY

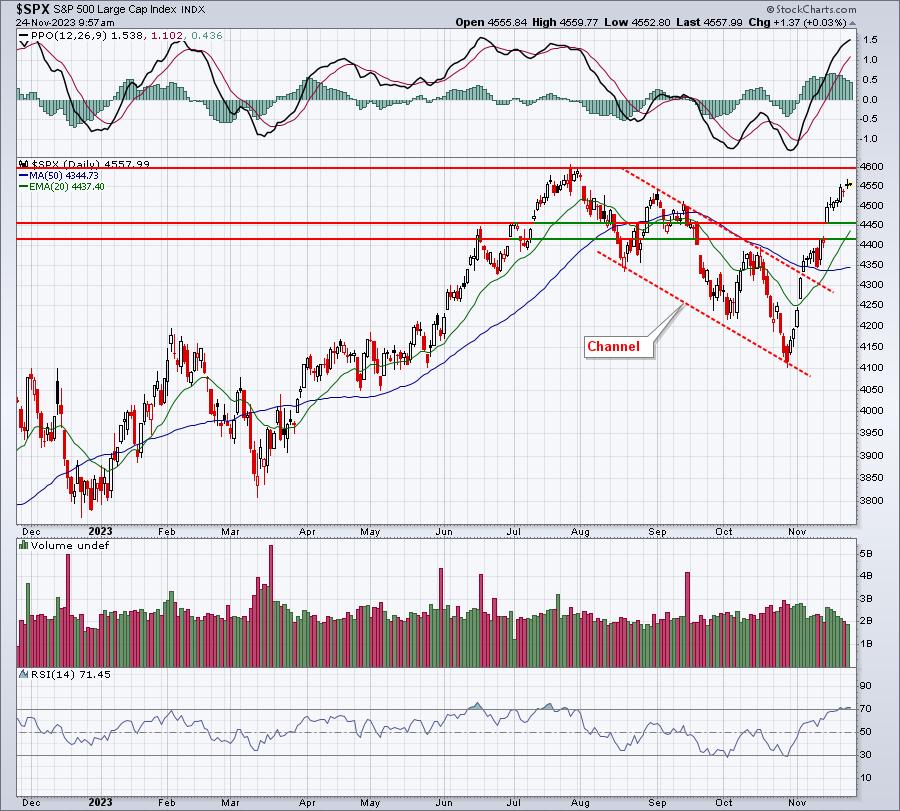
Breadth Analysis Suggests Pullback From S&P 4600

by David Keller,
President and Chief Strategist, Sierra Alpha Research
In this edition of StockCharts TV'sThe Final Bar, Dave reviews the latest market breadth indicators, some of which are indicating a likely pullback from resistance around the 4600 level for the S&P 500. He also focuses on stocks with actionable patterns including GOOGL, NFLX, SPOT, NVDA,...
READ MORE
MEMBERS ONLY

The Stock Market In 3 Charts: Market Breadth, Bonds, Sentiment

by Jayanthi Gopalakrishnan,
Director of Site Content, StockCharts.com
KEY TAKEAWAYS
* Stock market breadth is widening which is an indication that market internals are strong
* Falling treasury yields suggest that inflation expectations are declining
* Investors are more complacent than in October which is bullish for equities
Stocks are having a good November, which aligns with typical stock market behavior....
READ MORE
MEMBERS ONLY

A NEW ERA of Growth Leadership?
by David Keller,
President and Chief Strategist, Sierra Alpha Research
In this edition of StockCharts TV'sThe Final Bar, guest Mary Ann Bartels of Sanctuary Wealth describes how falling interest rates could pave the way for another leadership by mega-cap growth stocks, including semiconductors. Host David Keller, CMT breaks down two market breadth indicators to watch into December and...
READ MORE
MEMBERS ONLY

Gap's Stock Defies Gravity: Time To Exploit Its Dynamic Surge?

by Karl Montevirgen,
The StockCharts Insider
KEY TAKEAWAYS
* Gap's earnings expectations, caused the stock price to gap up by more than 30%
* Despite the gains, both the RSI and volume suggest Gap's stock may be overbought and losing momentum
* The stock was filtered in the Strong Volume Gainers scan which you can...
READ MORE
MEMBERS ONLY

HUGE NEWS! New SharpCharts Workbench Updates + Black Friday Week MEGA SALE

by Grayson Roze,
Chief Strategist, StockCharts.com
On this week's edition of StockCharts TV'sStockCharts in Focus, Grayson kicks off the BIGGEST week of the year here at StockCharts with two exciting announcements: our Black Friday Week sale and a fresh round of updates on the new SharpCharts Workbench. He'll show you...
READ MORE
MEMBERS ONLY

Sector Spotlight: S&P 500 - Consumer Discretionary Sector Holds the Key
by Julius de Kempenaer,
Senior Technical Analyst, StockCharts.com
On this episode of StockCharts TV's Sector Spotlight, I dive deep into rotations for asset classes and sectors. Bitcoin, as a proxy for crypto currencies as an asset class, is shooting off into the leading quadrant, while commodities are losing strength and stocks are back in the lead....
READ MORE
MEMBERS ONLY

Equity and Inflation Outlook -- Watch These Videos!
On Monday the 20th, I gave 2 interviews. The first is the clip below is from Yahoo Finance where we focus on oil and agricultural commodities.
The second interview is the Daily Briefing with Maggie Lake on Real Vision. This chart above is featured, along with:
1. Inflation thesis
2....
READ MORE
MEMBERS ONLY

Magnificent 7 Stocks Testing HUGE Resistance
by David Keller,
President and Chief Strategist, Sierra Alpha Research
In this edition of StockCharts TV'sThe Final Bar, Dave breaks down the technical setups on all of the Magnificent 7 stocks, addressing the balance between strong trends and overbought conditions. He answers viewer questions on investor sentiment, trailing stops, potential upside for TSLA, and the latest thinking on...
READ MORE
MEMBERS ONLY

This Stock Hit a 52-Week High -- And It's Still Surging
by Jayanthi Gopalakrishnan,
Director of Site Content, StockCharts.com
KEY TAKEAWAYS
* This stock reached new 52-week high again and can be profitable trading candidate
* Adding a momentum indicator to your charts will help identify if there's enough momentum to push the stock higher
* A StockCharts Technical Rank (SCTR) score above 90 makes this stock technically strong
Palantir...
READ MORE
MEMBERS ONLY
Check These Out: Buyable Pullbacks Under the Surface!
by TG Watkins,
Director of Stocks, Simpler Trading
In the previous episode, TG explained that we needed to wait for the right opportunities to buy pullbacks from when the market shot up. The mega-caps and the major indexes did one small day of pulling back, but underneath that, many individual stocks have pulled back and come into buyable...
READ MORE
MEMBERS ONLY

EB Weekly Market Report - Monday, November 20, 2023
by Tom Bowley,
Chief Market Strategist, EarningsBeats.com
Sample Report
Below is our latest Weekly Market Report (WMR), which is published on Sunday/Monday of every trading week. It's unlike our Daily Market Report (DMR) as the WMR focuses almost exclusively on the Big Picture and is more designed for those with longer-term investing/trading horizons....
READ MORE
MEMBERS ONLY
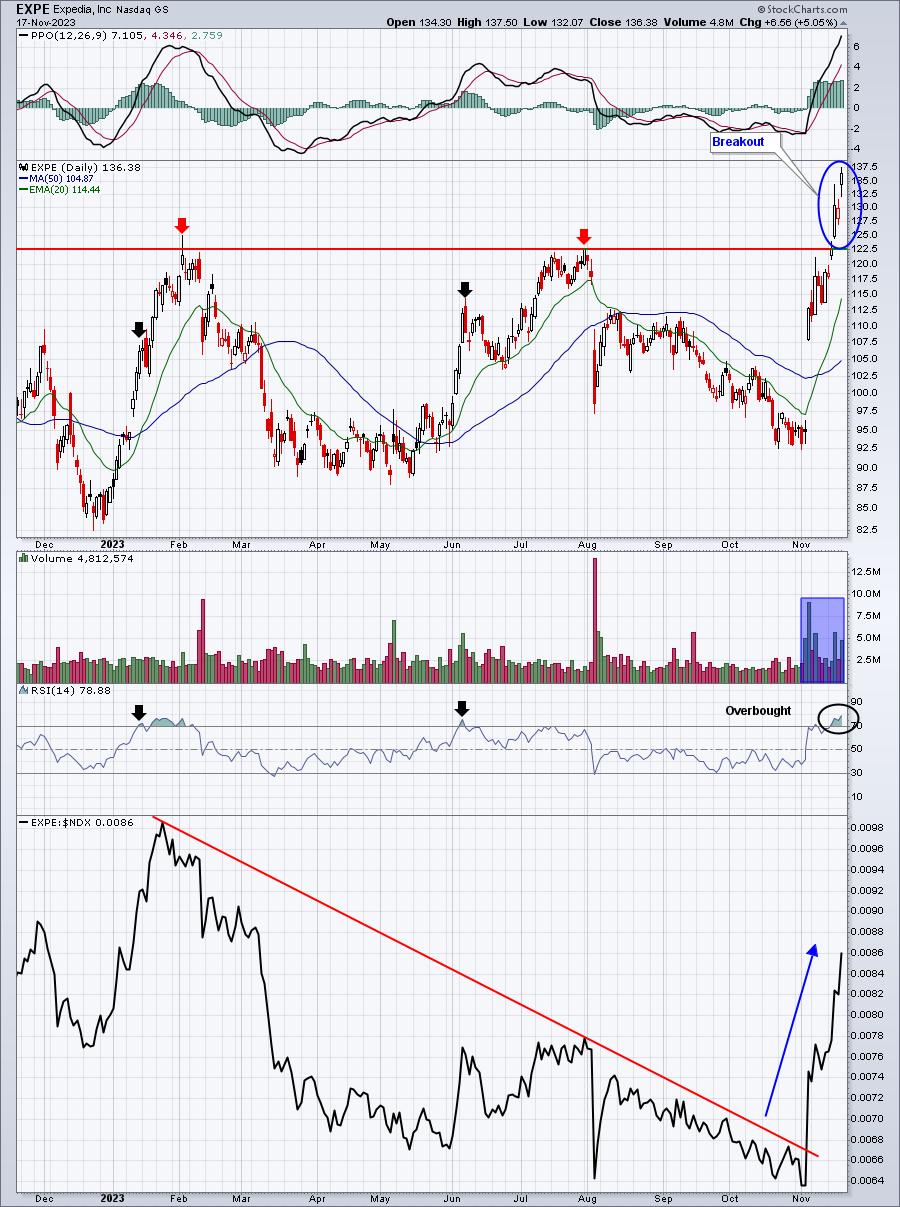
Expedia (EXPE) Taking The Road Less Traveled
by Tom Bowley,
Chief Market Strategist, EarningsBeats.com
After crushing its revenue and earnings expectations on November 2nd, Expedia (EXPE) has been on a roll. Here are the quarterly numbers that the internet travel giant posted a little over two weeks ago:
* Revenues: $3.93 billion (actual) vs. $3.87 billion (estimate)
* EPS: $5.41 (actual) vs. $5....
READ MORE
MEMBERS ONLY
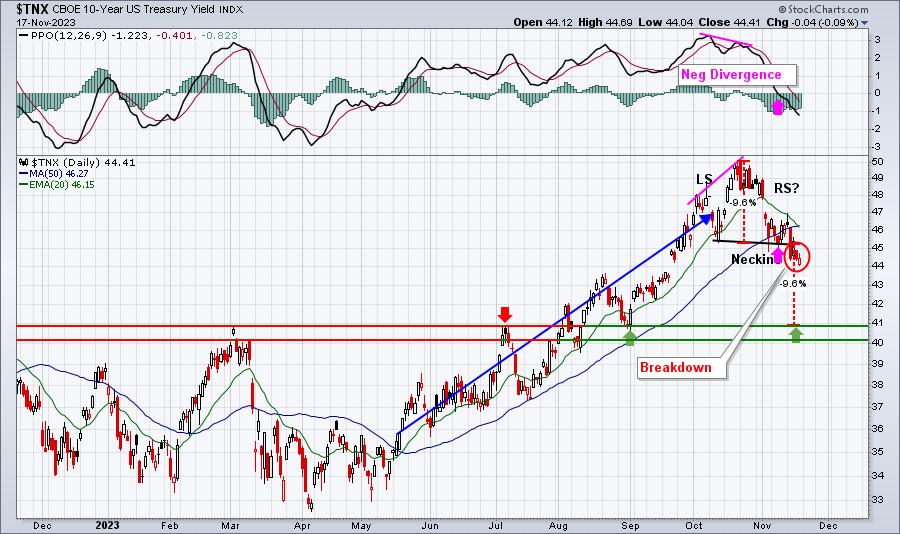
Channeling The Energy From Lower Interest Rates
by Tom Bowley,
Chief Market Strategist, EarningsBeats.com
The 10-year treasury yield ($TNX), and its recent decline, is certainly aiding, at least in part, the recent surge in U.S. equities. After hitting 5.0% on October 23rd, the TNX has been in a steady decline. As I see it, we've got further downside in the...
READ MORE
MEMBERS ONLY
Charting the S&P 1500 Zweig Breadth Thrust - And More...
by Arthur Hill,
Chief Technical Strategist, TrendInvestorPro.com
StockCharts users can chart the Zweig Breadth Thrust for the S&P 1500 or any other index that has Advance-Decline Percent data. All we have to do its convert the Zweig Breadth Thrust levels to their equivalents using Advance-Decline Percent.
The Zweig Breadth Thrust is based on percent advances...
READ MORE
MEMBERS ONLY
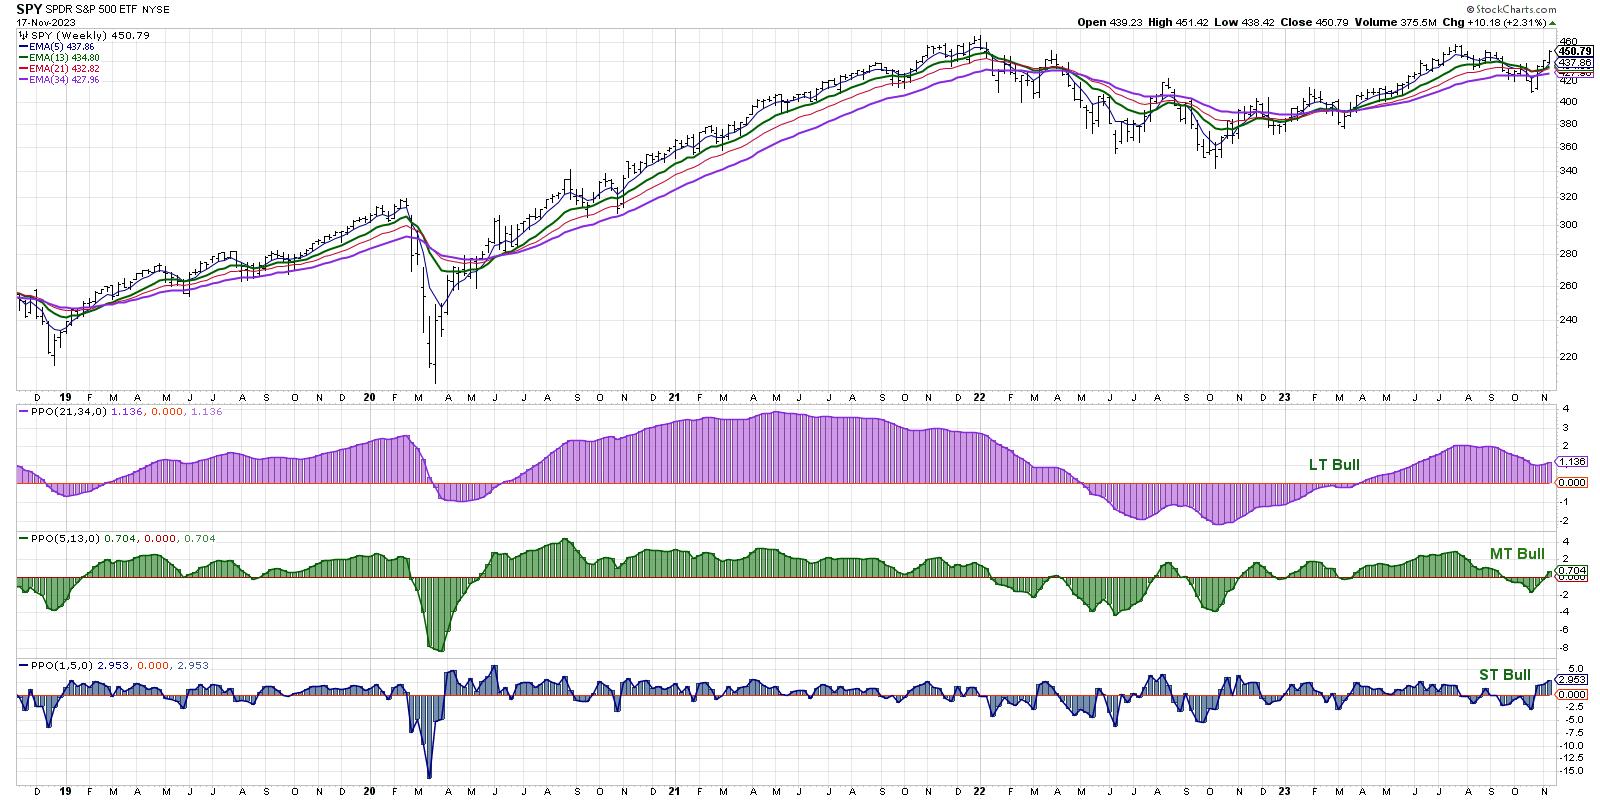
My Market Trend Model is Pretty Bulled Up
by David Keller,
President and Chief Strategist, Sierra Alpha Research
KEY TAKEAWAYS
* We use a series of weekly exponential moving averages to define the trend on three time frames.
* The medium-term model just turned bullish, suggesting a risk-on environment for stocks.
* Our Market Trend Model had a similar setup in March 2022, before a downturn eliminated the bullish configuration.
Am...
READ MORE
MEMBERS ONLY

Cap-Weighted Leadership Is Unhealthy

by Carl Swenlin,
President and Founder, DecisionPoint.com

by Erin Swenlin,
Vice President, DecisionPoint.com
Below is a reprint of an article written Thursday in the subscriber-only DecisionPoint Alert:
One of the things we keep track of is the performance of the S&P 500 Index (SPY), which is cap-weighted, versus the S&P 500 Equal Weight Index (RSP). In a healthy bull...
READ MORE
MEMBERS ONLY

MEM TV: Easy Way To Uncover Best Candidates for These Markets

by Mary Ellen McGonagle,
President, MEM Investment Research
In this episode of StockCharts TV'sThe MEM Edge, Mary Ellen reveals areas of the market that are reversing lengthy downtrends and the best way to participate. She also highlights where the strength is in the markets as the uptrend remains firmly in place.
This video originally premiered November...
READ MORE
MEMBERS ONLY

Recap and Action Plan: Small Caps, Beans, Oil
Since we came back from vacation, I've written 3 Dailys. The first of these was on the Economic Modern Family and how it opened its loving arms to the bulls.
I was particularly keen on small caps or the Russell 2000 (IWM). I wrote, "Beginning with Granddad...
READ MORE
MEMBERS ONLY

Cutting-Edge Seasonality Insights & Bitcoin 2024 Halving Impact
by David Keller,
President and Chief Strategist, Sierra Alpha Research
In this special edition of StockCharts TV'sThe Final Bar, guest Adrien Zduńczyk, CMT, of The Birb Nest shares a groundbreaking seasonality study he created with Jeff Hirsch ofStock Trader's Almanac. Adrien and Dave explain how November and December tend to be seasonably strong for Bitcoin, why...
READ MORE
MEMBERS ONLY

The Bull Has Left the Bear in the Dust: It's Time To Add Small Caps To Your Portfolio
by Jayanthi Gopalakrishnan,
Director of Site Content, StockCharts.com
KEY TAKEAWAYS
* The Dow Jones Industrial Average, S&P 500, and Nasdaq Composite notched a three week winning streak.
* Small-cap stocks are showing signs of rallying to the upside
* Overall, the economy looks to be chugging along, investor sentiment is bullish, and we coudl see a year-end rally
The...
READ MORE
MEMBERS ONLY

FALLING OIL HELPS BOOST STOCKS -- XLE TESTS 200-DAY LINE -- QQQ TESTS RESISTANCE

by John Murphy,
Chief Technical Analyst, StockCharts.com
PEAK IN OIL LED TO PEAK IN BOND YIELDS... Previous messages have shown a drop in bond yields starting a month ago coinciding with the fourth quarter rally in stocks. But there's another element in that story which is a sharp drop in the price of oil. That&...
READ MORE
MEMBERS ONLY
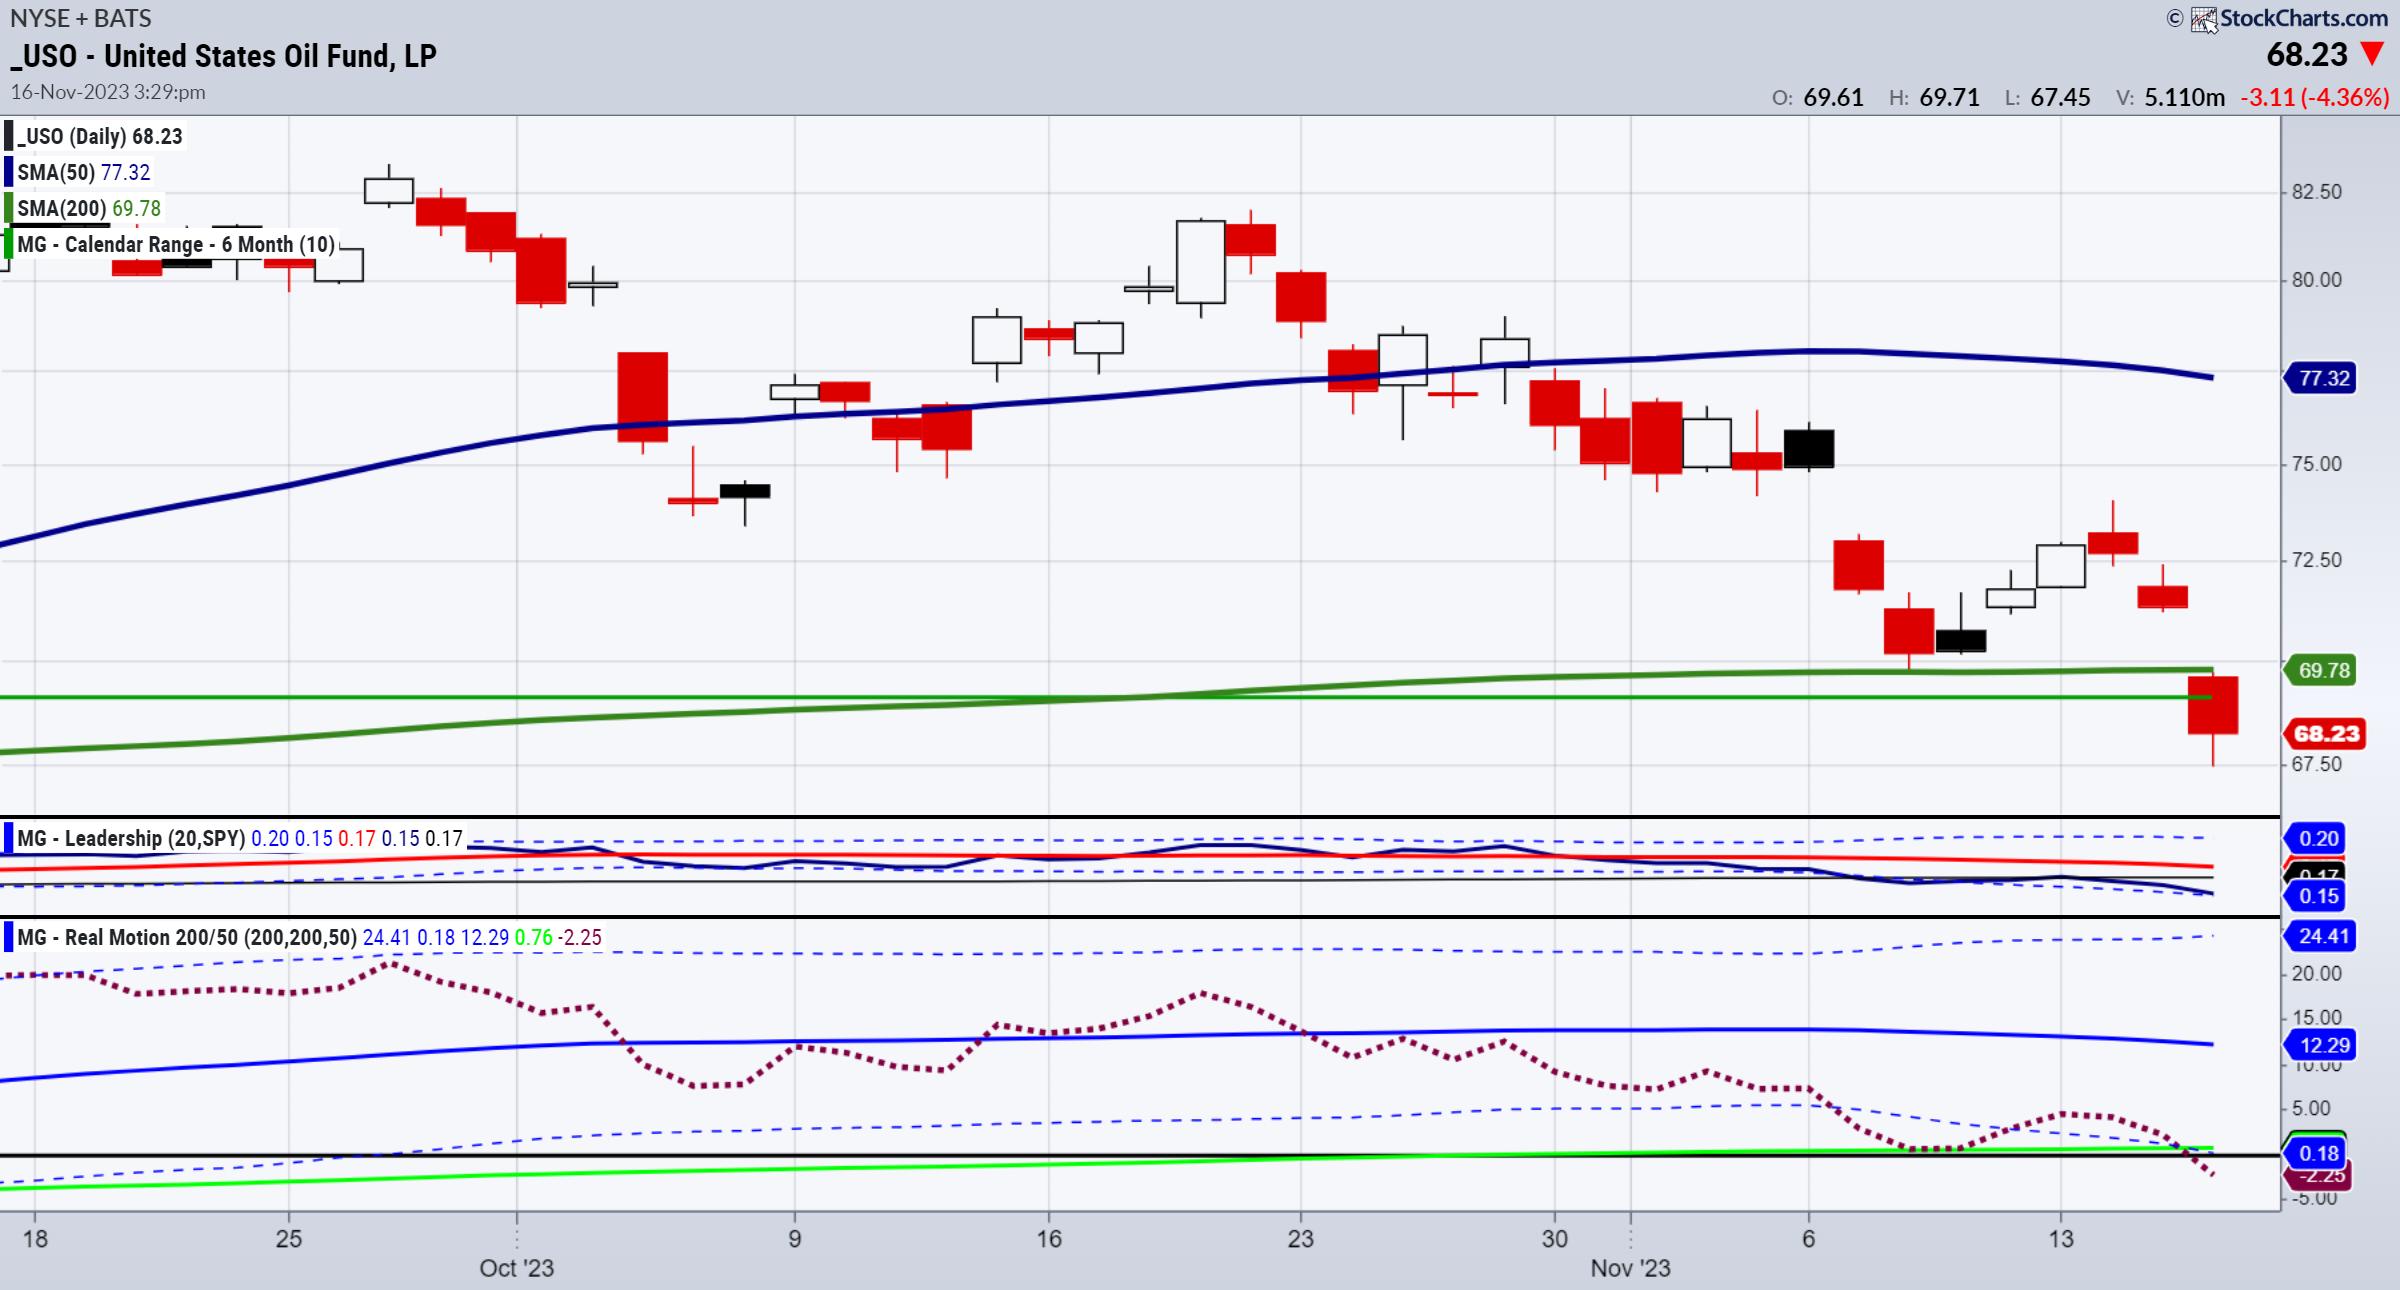
Oil the New Gold -- Buy When There's Blood in the Streets
A weaker labor market, manufacturing production slowing, new home prices falling and crude oil inventories rising more than expected are all to blame for the big drop in oil prices. US also eased sanctions on Venezuelan oil.
That's the nature of commodities; fresh news can supersede older headlines...
READ MORE
MEMBERS ONLY

The Case for Small-Caps as Major Indexes Test Overbought Conditions
by David Keller,
President and Chief Strategist, Sierra Alpha Research
In this edition of StockCharts TV'sThe Final Bar, Craig Johnson, CFA CMT of Piper Sandler shares his long-term charts of the S&P 500 and 10-Year Treasury Yield and makes the case for small caps through year-end 2023. Dave shares one breadth indicator reaching a bearish extreme...
READ MORE
MEMBERS ONLY

Capitalizing on Market Momentum: The Art of Pullback Swing Trading

by Joe Rabil,
President, Rabil Stock Research
On this week's edition of Stock Talk with Joe Rabil, Joe explains how to use multiple timeframes to trade a pullback. He shows the reasons why the setup looked attractive on the daily chart, then goes down to the hourly chart to evaluate the quality of the pullback...
READ MORE
MEMBERS ONLY

Larry's "Family Gathering" November 16, 2023 Recording

by Larry Williams,
Veteran Investor and Author
In this video, Larry begins with a followup on the October rally kickoff. He then covers stocks like CRWD, META, NVDA, LULU, and DKNG. Larry answers questions about seasonal and cyclical differences, his personal indicators, and what retailers rely most on for the Christmas season. He highlights some trades that...
READ MORE
MEMBERS ONLY
"Family Gathering" Meeting Today at 2:00 PM Eastern
Today, Larry Williams will be hosting a "Family Gathering" meeting at 2pm Eastern Standard Time (11am Pacific). Sign-in in begins 5 minutes prior. The show will be recorded and posted online for those of you who cannot attend. Use the link below to join:
Link to Join Webinar:...
READ MORE
MEMBERS ONLY
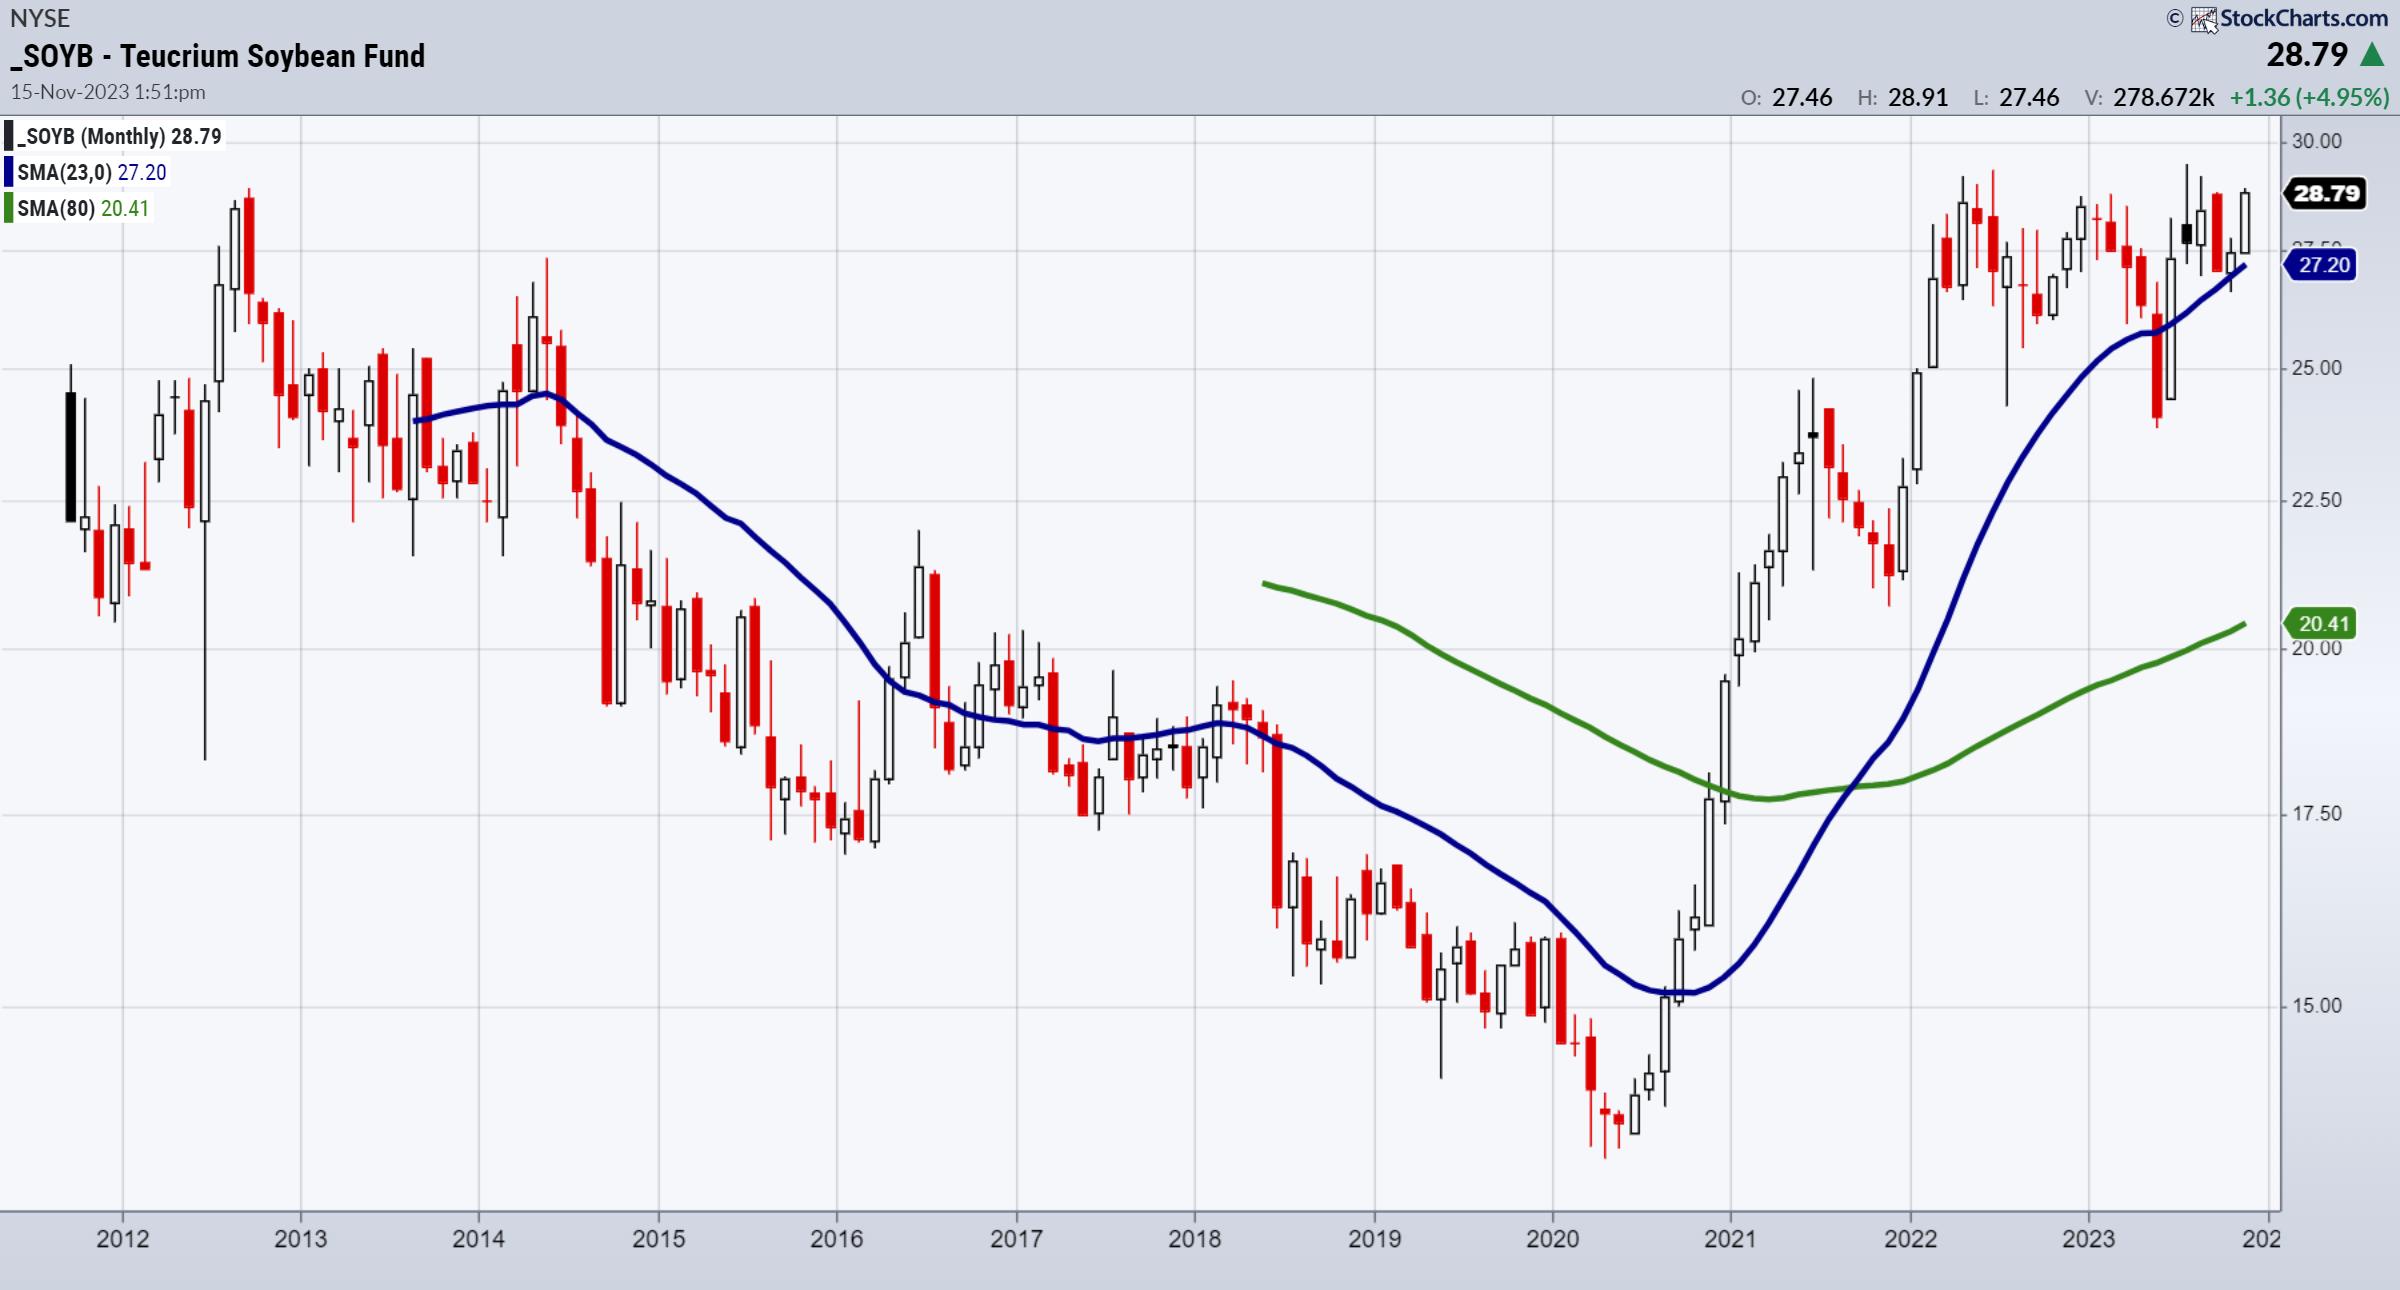
Soybeans Could be the Next Parabolic Runner
Brazil planted a record soybean crop only to see unusually dry and hot weather create concerns for the harvest. Furthermore, Argentina had an extreme shortfall of soybean meal crops. Meanwhile, the USDA numbers were bearish for corn and soybeans, as U.S. crops came in larger than expected. However, China...
READ MORE
MEMBERS ONLY

Three Ways to Stay on the Right Side of the Market
by David Keller,
President and Chief Strategist, Sierra Alpha Research
In this edition of StockCharts TV'sThe Final Bar, guest Dave Landry of DaveLandry.com reveals his three charts to define the market trend, limit losses, and stay on the right side of the market. Host David Keller, CMT targets names trading higher and testing key resistance, including TGT,...
READ MORE
MEMBERS ONLY
Stock Market Welcomes Us Home in a Big Way
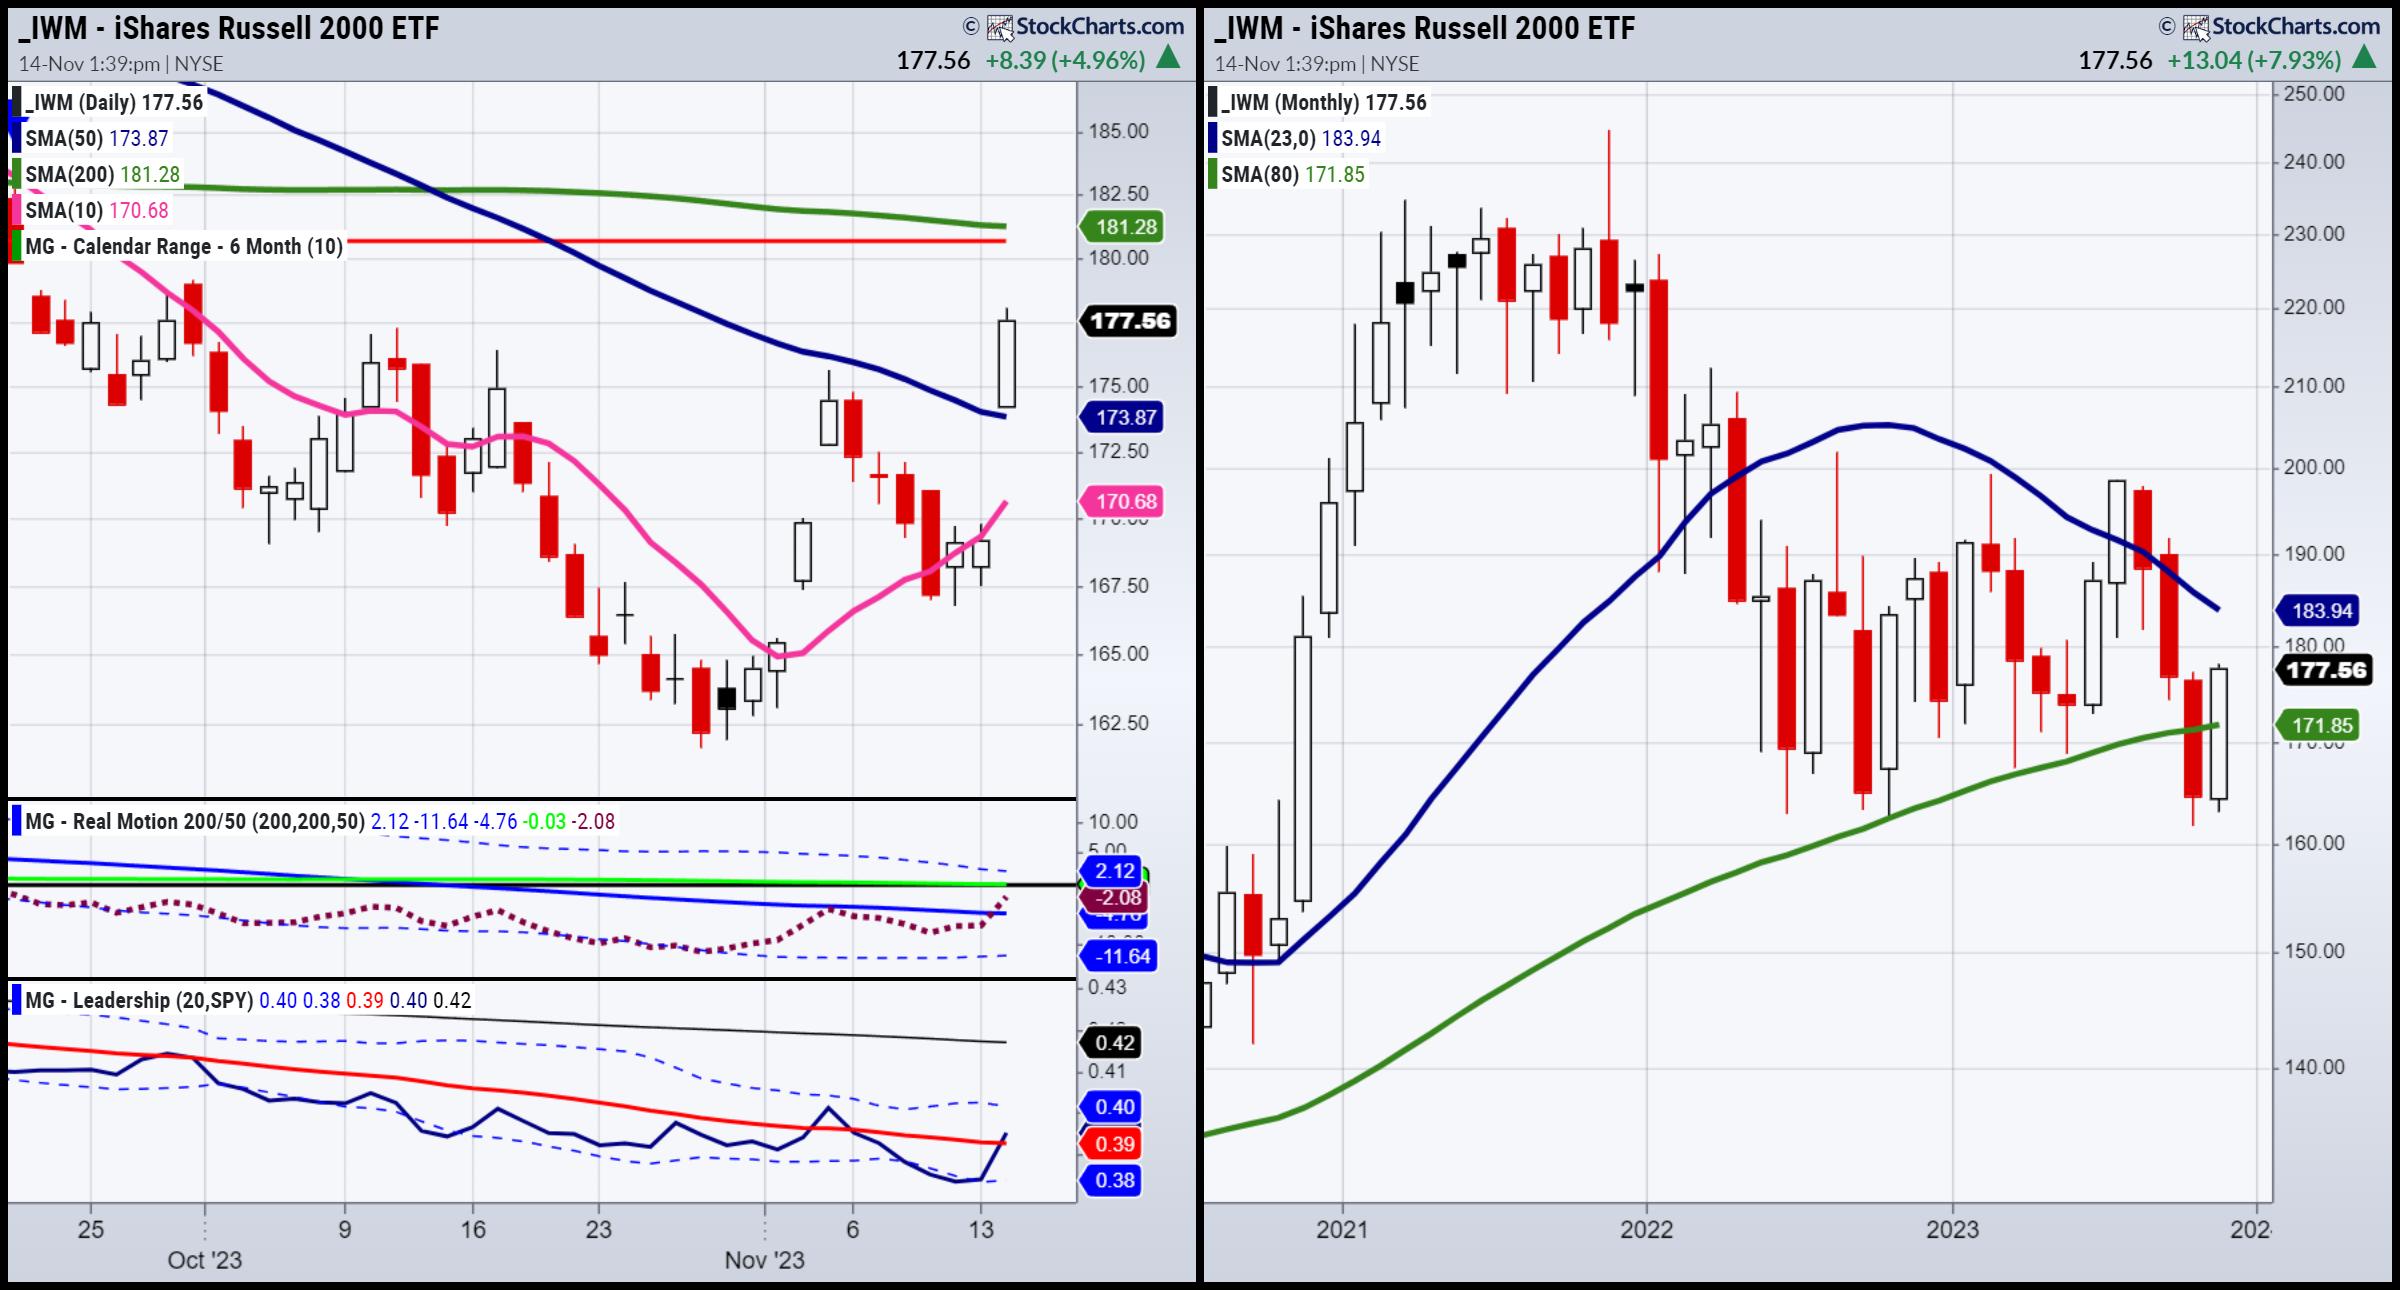
The Economic Modern Family has opened its loving arms to the bulls and to us after our 2 weeks away.
Beginning with Granddad Russell 2000 (IWM), Monday began with a gap up over the 50-DMA (blue). We will watch for a phase change confirmation. Furthermore, the monthly chart shows IWM...
READ MORE
MEMBERS ONLY

Larry's LIVE "Family Gathering" Webinar Airs THIS WEEK - Thursday, November 16th at 2:00pm EST!
Larry is going LIVE! Don't miss the upcoming "Family Gathering" webinar with Larry Williams, airing live through Zoom this Thursday, November 16 at 2:00pm EST.
In this must-see event, Larry will be presenting his current opinions on a broad variety of current market topics, directly...
READ MORE
MEMBERS ONLY

A Supercharged Stock Market Rally: Catch These Stocks Before They Get Away
by Jayanthi Gopalakrishnan,
Director of Site Content, StockCharts.com
KEY TAKEAWAYS
* Cooling CPI data sends equities roaring higher
* The 10-year Treasury yield fell below 4.5%, a critical support level
* Small-cap stocks were clearly the biggest winners today
October's unchanged headline US CPI and lower-than-expected core CPI were reasons for investors to celebrate. The broader stock market...
READ MORE
MEMBERS ONLY

Stocks and Bonds SOAR After October CPI
by David Keller,
President and Chief Strategist, Sierra Alpha Research
In this edition of StockCharts TV'sThe Final Bar, guest Pete Carmasino of Chaikin Analytics puts this week's action into long-term perspective using his charts of bond prices, interest rates, unemployment, and regional banks. Dave highlights three stocks with actionable signals this week: ROST, FSLR, and MCK....
READ MORE