MEMBERS ONLY

Larry's LIVE "Family Gathering" Webinar Airs THIS WEEK - Thursday, February 15th at 2:00pm EST!
Larry is going LIVE! Don't miss the upcoming "Family Gathering" webinar with Larry Williams, airing live through Zoom this coming Thursday, February 15 at 2:00pm Eastern Standard Time.
In this must-see event, Larry will be presenting his current opinions on a broad variety of...
READ MORE
MEMBERS ONLY

DP Trading Room: Avoid These "Magnificent 7" Stocks!

by Erin Swenlin,
Vice President, DecisionPoint.com
On today's DecisionPoint Trading Room episode, Carl reviews the Magnificent 7 and gives you his opinion on their current and possible future states. He warns against two in particular and gives his stamp of approval on three others. Negative divergences are still a problem and Carl explains why....
READ MORE
MEMBERS ONLY

The EarningsBeats.com Strategy For Uncovering The New Winners

by Tom Bowley,
Chief Market Strategist, EarningsBeats.com
Earnings and interest rates are always the key drivers to stock market success. There may be other short-term factors that influence price action, but, at the end of the day, rising earnings and interest rates conducive to job and economic growth is what results in secular bull markets.
Organize...
READ MORE
MEMBERS ONLY
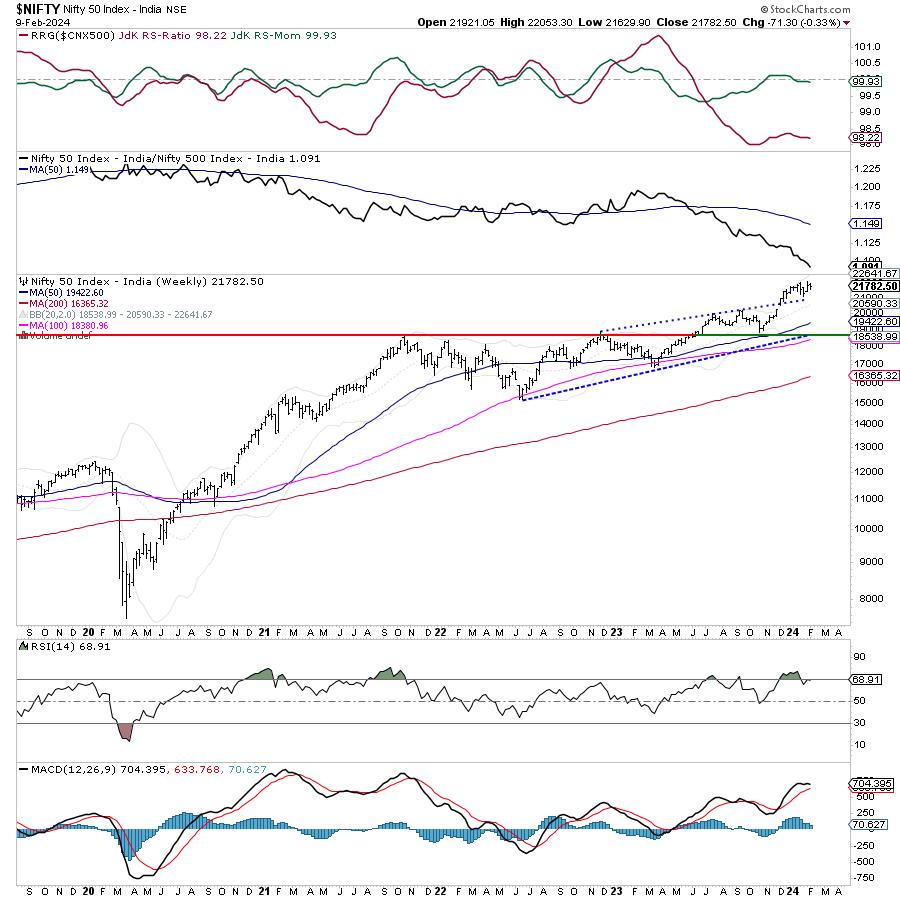
Week Ahead: NIFTY Set to Consolidate in a Broad Range; Runaway Moves Unlikely Below These Levels

by Milan Vaishnav,
Founder and Technical Analyst, EquityResearch.asia and ChartWizard.ae
Two weeks of decline, one week of advance, and a week of consolidation. This is what sums up the market activity over the past month. The markets consolidated over the past week and stayed largely within a defined trading range, and the past five sessions remained choppy, with the NIFTY...
READ MORE
MEMBERS ONLY
Beware the Hindenburg Omen!

by David Keller,
President and Chief Strategist, Sierra Alpha Research
KEY TAKEAWAYS
* Jim Miekka created the Hindenburg Omen after studying the conditions present at previous market peaks.
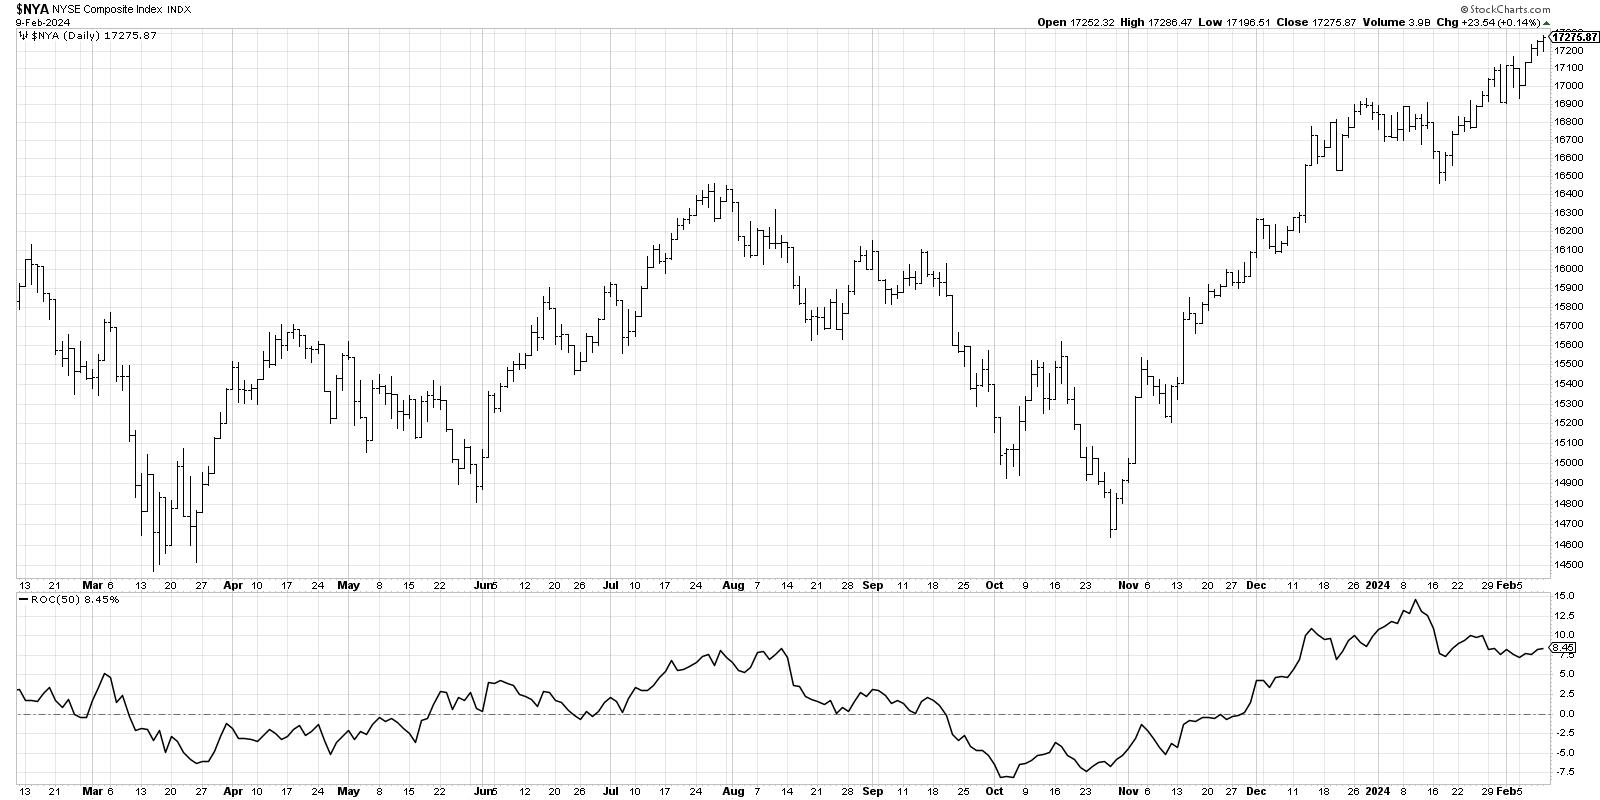
* The Hindenburg Omen triggered an initial signal this week, just as the S&P 500 finally closed above 5000 for the first time.
* If we see a second signal in the next...
READ MORE
MEMBERS ONLY
MEM TV: Best Way To Participate in Stronger Areas of The Market

by Mary Ellen McGonagle,
President, MEM Investment Research
In this episode of StockCharts TV'sThe MEM Edge, Mary Ellen reviews why the markets continue to hit new highs while also highlighting which areas are driving this strength. She then shares a low-risk, simple way to participate in the uptrend among these stronger areas.
This video originally...
READ MORE
MEMBERS ONLY
Sentiment Lopsided - Is It a Problem?
by Erin Swenlin,
Vice President, DecisionPoint.com
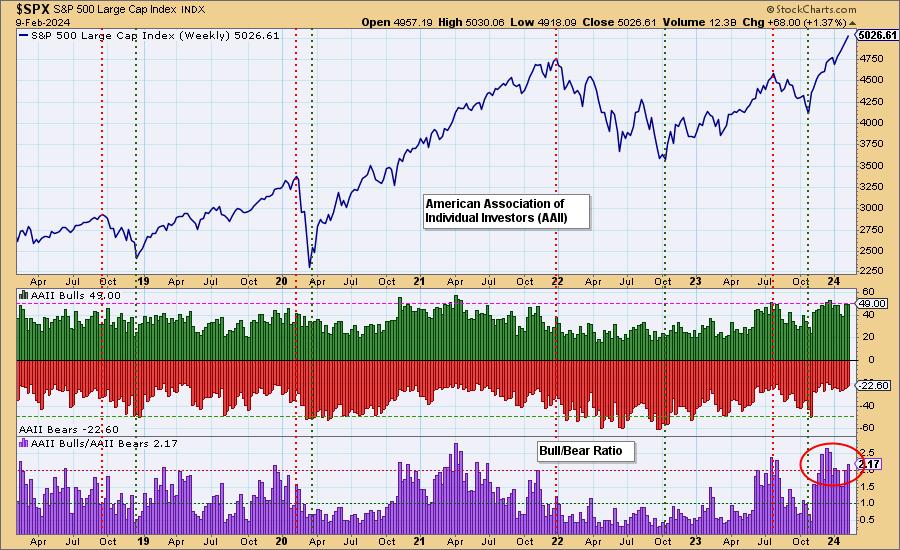
Periodically, we like to review sentiment charts, and today we have two for you. One is the poll results from the American Association of Individual Investors (AAII) and the other is the National Association of Active Investment Managers (NAAIM) Exposure level.
In both cases, we are starting to see sentiment...
READ MORE
MEMBERS ONLY
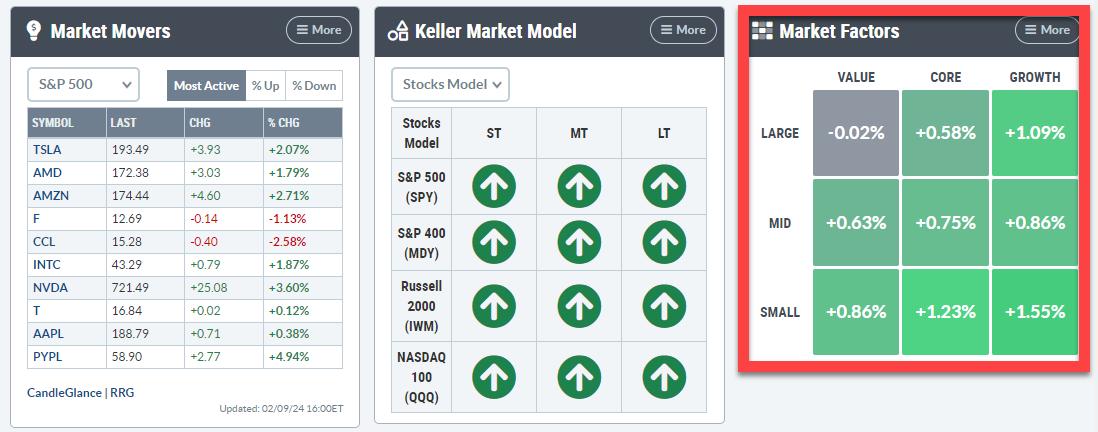
Visualizing the Market Factors Panel on RRG

by Julius de Kempenaer,
Senior Technical Analyst, StockCharts.com
KEY TAKEAWAYS
* Bring the New Market Factors Panel to a Relative Rotation Graph
* Same approach using different index family shows a different image
With the release of the new Panels feature on the StockCharts dashboard, there are a lot of ways that users of RRG charts can take advantage! Let&...
READ MORE
MEMBERS ONLY

Your Questions, Answered! Price Gaps, Bull Flags, Inverse Patterns, and MORE
by David Keller,
President and Chief Strategist, Sierra Alpha Research
In this edition of StockCharts TV'sThe Final Bar, Dave digs into The Final Bar Mailbag and answers questions on price patterns like bull flags, what price gaps actually represent on the chart, and why analyzing earnings trends could help you anticipate subsequent moves for stocks like META.
This...
READ MORE
MEMBERS ONLY

The Costco Stock Surge: What You Need to Know Right Now!

by Karl Montevirgen,
The StockCharts Insider
KEY TAKEAWAYS
* Costco's stock surged to unprecedented heights, surpassing its previous all-time record
* Costco's technical situation looks exceedingly bullish, but like many stocks hitting record highs, the stock may be slightly overbought
* The Money Flow Index can measure momentum and show whether price buying pressure...
READ MORE
MEMBERS ONLY
3 Expert Earnings Plays: Maximizing Reward, Minimizing Risk
by David Keller,
President and Chief Strategist, Sierra Alpha Research
In this edition of StockCharts TV'sThe Final Bar, Dave welcomes Danielle Shay of Simpler Trading. Danielle highlights three earnings plays she's focused on this week, and shares how she combines multiple time frames in her trading to better define risk vs. reward. Dave laments the weakening...
READ MORE
MEMBERS ONLY
Master Momentum Using Price Swings and Fibonacci Grids

by Joe Rabil,
President, Rabil Stock Research
On this week's edition of Stock Talk with Joe Rabil, Joe discusses how he uses the price swings and Fibonacci grid to determine the momentum of a trend without the use of indicators. He explains how indicators can lag at reversal points and why we need to lean...
READ MORE
MEMBERS ONLY
The Hoax of Modern Finance - Part 7: The Illusion of Forecasting

by Greg Morris,
Veteran Technical Analyst, Investor, and Author
Note to the reader: This is the seventh in a series of articles I'm publishing here taken from my book, "Investing with the Trend." Hopefully, you will find this content useful. Market myths are generally perpetuated by repetition, misleading symbolic connections, and the complete ignorance of...
READ MORE
MEMBERS ONLY

Why the NAAIM Exposure Index Matters to Your Investments
by David Keller,
President and Chief Strategist, Sierra Alpha Research
In this edition of StockCharts TV'sThe Final Bar, Dave welcomes Ryan Redfern, ChFC, CMT of Shadowridge Asset Management and President of NAAIM. Ryan provides a primer on the NAAIM Exposure Index, including what it is, how it's calculated, and how it can be used to measure...
READ MORE
MEMBERS ONLY

Decoding PLTR Stock: Why It's an Attractive Investment

by Jayanthi Gopalakrishnan,
Director of Site Content, StockCharts.com
KEY TAKEAWAYS
* PLTR stock gapped up after its impressive Q4 earnings and guidance
* Watch the average directional index and relative strength index to monitor the momentum of the upward trend
* If momentum continues to be strong, the stock would be an attractive investment
If you look at a chart of...
READ MORE
MEMBERS ONLY

Sector Spotlight: Stocks vs. Bonds -- Monthly Trends Revealed!
by Julius de Kempenaer,
Senior Technical Analyst, StockCharts.com
On this episode of StockCharts TV's Sector Spotlight, I review the monthly charts for January 2024, in combination with the Relative Rotation on the Monthly RRGs for asset classes and sectors. At asset class level, the preference for stocks over bonds remains clearly visible. Looking at the monthly...
READ MORE
MEMBERS ONLY

Eli Lilly's Volatile Victory: What Tuesday's Turnaround Means for Your Portfolio
by Karl Montevirgen,
The StockCharts Insider
KEY TAKEAWAYS
* Eli Lilly & Co's beat on earnings and revenue expectations led to a swift 5% spike and reversal in its stock price
* Analyzing Eli Lilly's stock price chart reveal some headwinds that may not be apparent in fundamental data
* Eli Lilly's stock...
READ MORE
MEMBERS ONLY

Three Things I WISH I'd Known About Trading
by David Keller,
President and Chief Strategist, Sierra Alpha Research
In this edition of StockCharts TV'sThe Final Bar, Dave speaks to weakening short-term breadth conditions as the McClellan Oscillator rotates to a bearish level this week. Guest Dave Landry of DaveLandry.com drops some serious trader wisdom and also shares what he does first thing every morning...
READ MORE
MEMBERS ONLY
Tape Reading for Distribution

by Bruce Fraser,
Industry-leading "Wyckoffian"
Recent Power Charting episodes have been devoted to the classic technique of chart reading innovated by Richard D. Wyckoff. He referred to the method as ‘Tape Reading' while it is actually the technique of reading charts, bar by bar to assess the likely future direction of an index, stock,...
READ MORE
MEMBERS ONLY
Market Breadth Divergence Says NO BULL!
by David Keller,
President and Chief Strategist, Sierra Alpha Research
In this edition of StockCharts TV'sThe Final Bar, Dave demonstrates how the market's recent upswing has left mid-caps and small-caps in the dust, with deteriorating breadth conditions suggesting an increased risk of downside for the S&P 500. He also unveils the latest...
READ MORE
MEMBERS ONLY

Only a Fool Would Try to Call a Correction in a Bull Market, So Here Goes!

by Martin Pring,
President, Pring Research
The vast majority of the primary trend indicators are pointing to a bull market and have been doing so for the better part of a year. Chart 1, for instance, shows that NYSE Margin Debt, or rather its long-term KST, has only recently gone bullish. The vertical lines point...
READ MORE
MEMBERS ONLY
DecisionPoint Trading Room: Narrow Advance a Big Problem!
by Erin Swenlin,
Vice President, DecisionPoint.com
The market rally last week was very narrow, driven mainly by large gains in communication services stocks like Meta. Many technical indicators are showing negative divergences. The broader market struggled. Erin reviews all of the sectors under the hood and then takes your symbol requests.
Key Takeaways:
- Communication services and...
READ MORE
MEMBERS ONLY
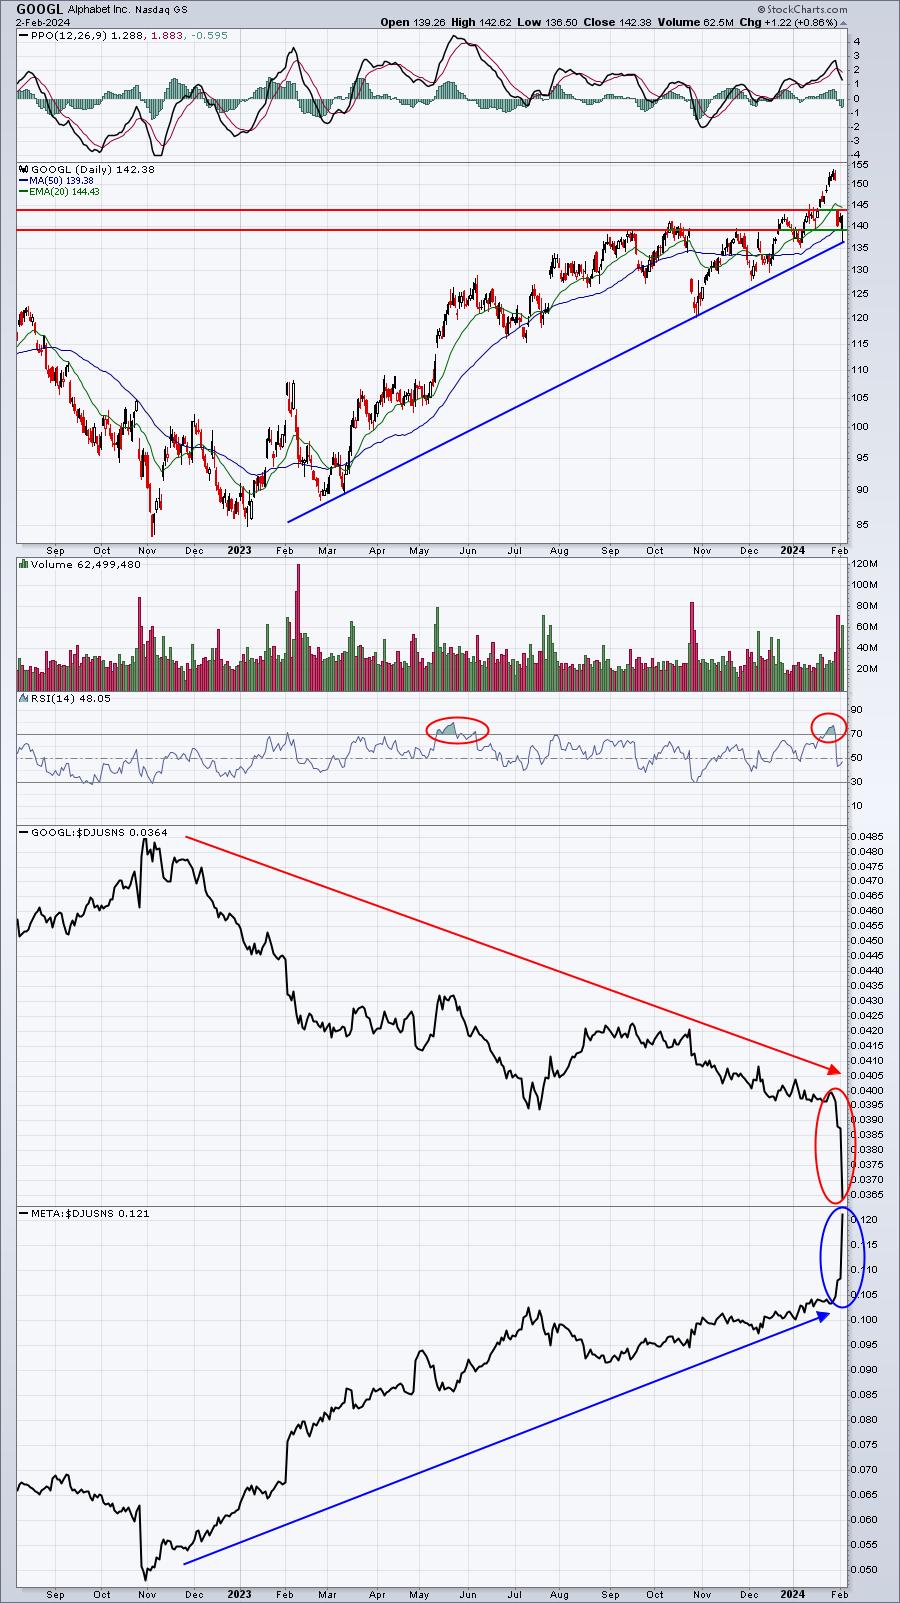
Based on Relative Strength, Alphabet (GOOGL) Is An Unloved Stock
by Tom Bowley,
Chief Market Strategist, EarningsBeats.com
Nearly two weeks ago, I was discussing in our FREE EB Digest newsletter why I felt Alphabet (GOOGL) was poised for a decline after earnings. It was continuing to push higher, which, on the surface, was a fairly bullish signal. However, if you looked at how strong internet stocks ($DJUSNS)...
READ MORE
MEMBERS ONLY

Why This Latest Bull Market Advance Is So Bullish
by Tom Bowley,
Chief Market Strategist, EarningsBeats.com
I've been bullish for nearly two years now. Bullish rotation and Wall Street manipulation started the latest leg of this SECULAR bull market back in June 2022. If you follow my research and work, then I'm sure you remember these two headlines on YouTube:
You can...
READ MORE
MEMBERS ONLY

Generals March On, but Fewer Troops are Following - Get the Essential Breadth Indicator ChartList

by Arthur Hill,
Chief Technical Strategist, TrendInvestorPro.com
Divergences reflect a disconnect between price and the indicator. A bearish divergence forms when price forges a higher high and the indicator fails to confirm this high. In the case presented below, we have the S&P 500 moving higher and fewer stocks making it back above their 50...
READ MORE
MEMBERS ONLY
Strong Earnings Is Driving Sector Rotation Into These 2 Groups
by Mary Ellen McGonagle,
President, MEM Investment Research
It was a choppy push to new highs for the S&P 500 this week, after a sharp drop Wednesday on Fed news was followed by a recovery rally on the heels of strong earnings from select Magnificent 7 names. All three indexes posted a 4th consecutive week of...
READ MORE
MEMBERS ONLY
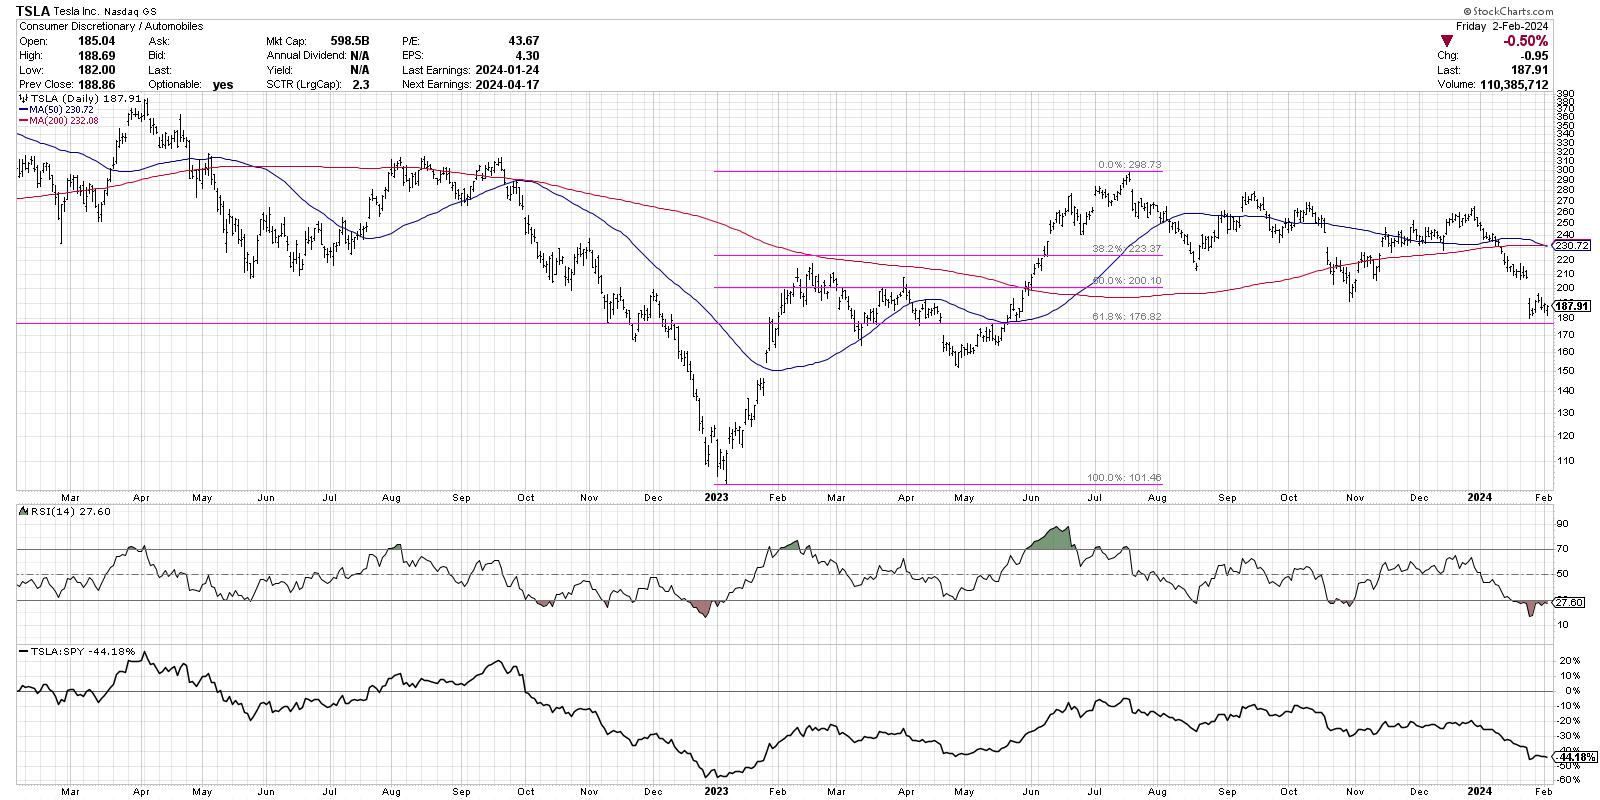
Tesla Tests Key Support: Is This a Trade? Or an Investment?
by David Keller,
President and Chief Strategist, Sierra Alpha Research
KEY TAKEAWAYS
* Tesla is an outlier from the other Magnificent 7 stocks, remaining in a downtrend channel for the last six months.
* RSI oversold conditions, along with Fibonacci retracements, suggests a return to the upper end of the trend channel.
* TSLA shows a "confluence of resistance" above current...
READ MORE
MEMBERS ONLY
HUGE NEWS! Our Most Important Site-Wide Product Release EVER + A Tour!

by Grayson Roze,
Chief Strategist, StockCharts.com
On this week's edition of StockCharts TV'sStockCharts in Focus, Grayson pulls back the curtain on our latest site-wide product release - one of our biggest and most important EVER in the history of StockCharts. See new features in action like the all-new SharpCharts Workbench, totally...
READ MORE
MEMBERS ONLY
MEM TV: Here's How to Trade Gaps Up After Earnings!
by Mary Ellen McGonagle,
President, MEM Investment Research
In this episode of StockCharts TV'sThe MEM Edge, Mary Ellen reviews the market's recovery from Fed Chair Powell's comments on Wednesday, sharing exactly what drove the S&P 500 to new highs. She also reviews the sector rotation that's taking place,...
READ MORE
MEMBERS ONLY

S&P 500, Dow Jones Hit All-Time Highs Again; Tech Stocks Back in the Spotlight
by Jayanthi Gopalakrishnan,
Director of Site Content, StockCharts.com
KEY TAKEAWAYS
* The S&P 500, Dow Jones Industrial Average, and Nasdaq 100 closed at all-time highs
* Tech stocks are back in focus as mega-tech companies wrap up their Q4 earnings
* Investors should take advantage of pullbacks if they want to add positions to their portfolios
What...
READ MORE
MEMBERS ONLY
This Week's Sector & Industry Group to Watch
by Erin Swenlin,
Vice President, DecisionPoint.com
Before we get started today, I want to encourage you to subscribe to our new YouTube Channel for DecisionPoint. We post the recording of our weekly trading room there, and it is also full of educational videos that Erin has done over the years. Click on this LINK to subscribe...
READ MORE
MEMBERS ONLY

GNG TV: A STRONG Week for Equities and Internet Stocks SOAR!

by Alex Cole,
Co-founder, GoNoGo Charts®
On this week's edition of the GoNoGo Charts show from StockCharts TV, Alex takes a look at the market using the GoNoGo methodology as the S&P 500 digests the rally to all time highs. After using the GoNoGo Asset Map to look at the trends across...
READ MORE
MEMBERS ONLY
Discretionary vs. Discretionary, a Fierce Battle Under the Hood
by Julius de Kempenaer,
Senior Technical Analyst, StockCharts.com
KEY TAKEAWAYS
* Not all is what it looks like inside the Consumer Discretionary Sector
* Using Cap-weighted vs. Equal-Weighted Sectors on RRG reveals underlying differences
* Mega-cap Stocks are dragging XLY down
* Using a Simple Scan Leads to four interesting charts
Cap-Weighted vs. Equal-Weighted
Sometimes, you need...
READ MORE
MEMBERS ONLY

Deciphering Gold's (GLD) Signals: Is Now the Time to Go Long on Gold?
by Karl Montevirgen,
The StockCharts Insider
KEY TAKEAWAYS
* The robust jobs data triggered a sell-off in the gold market, hampering expectations of an imminent rate cut
* Price projections for GLD in 2024 span a wide spectrum, below and above current prices because of fluctuating macroeconomic and geopolitical dynamics
* The Volume-by-Price indicator is especially...
READ MORE
MEMBERS ONLY
Top Ten Charts to Watch for February 2024
by David Keller,
President and Chief Strategist, Sierra Alpha Research
In this edition of StockCharts TV'sThe Final Bar, Grayson and Dave run through charts they feel present actionable opportunities based on their technical analysis setups. They'll cover breakout strategies, moving average techniques, relative strength, and much more. And you'll have ten new charts to...
READ MORE
MEMBERS ONLY
Bullish Buyers Return After Market Selloff
by David Keller,
President and Chief Strategist, Sierra Alpha Research
In this edition of StockCharts TV'sThe Final Bar, Jay Woods, CMT of Freedom Capital Markets brings the energy of the NYSE floor to the show, relating today's market rebound to longer term themes for small caps and regional banks. Dave shares one breadth indicator recognizing broad...
READ MORE
MEMBERS ONLY

DR Horton Stock Plummets: Is Now the Time to Buy the Dip?
by Karl Montevirgen,
The StockCharts Insider
KEY TAKEAWAYS
* DHI's stock plummeted after missing Wall Street's earnings expectations and soft guidance
* Technical indicators provide a clearer view for those looking to buy the dip
* You can use StockCharts seasonality charts to provide a big-picture context to your trading setup
The tight supply...
READ MORE
MEMBERS ONLY
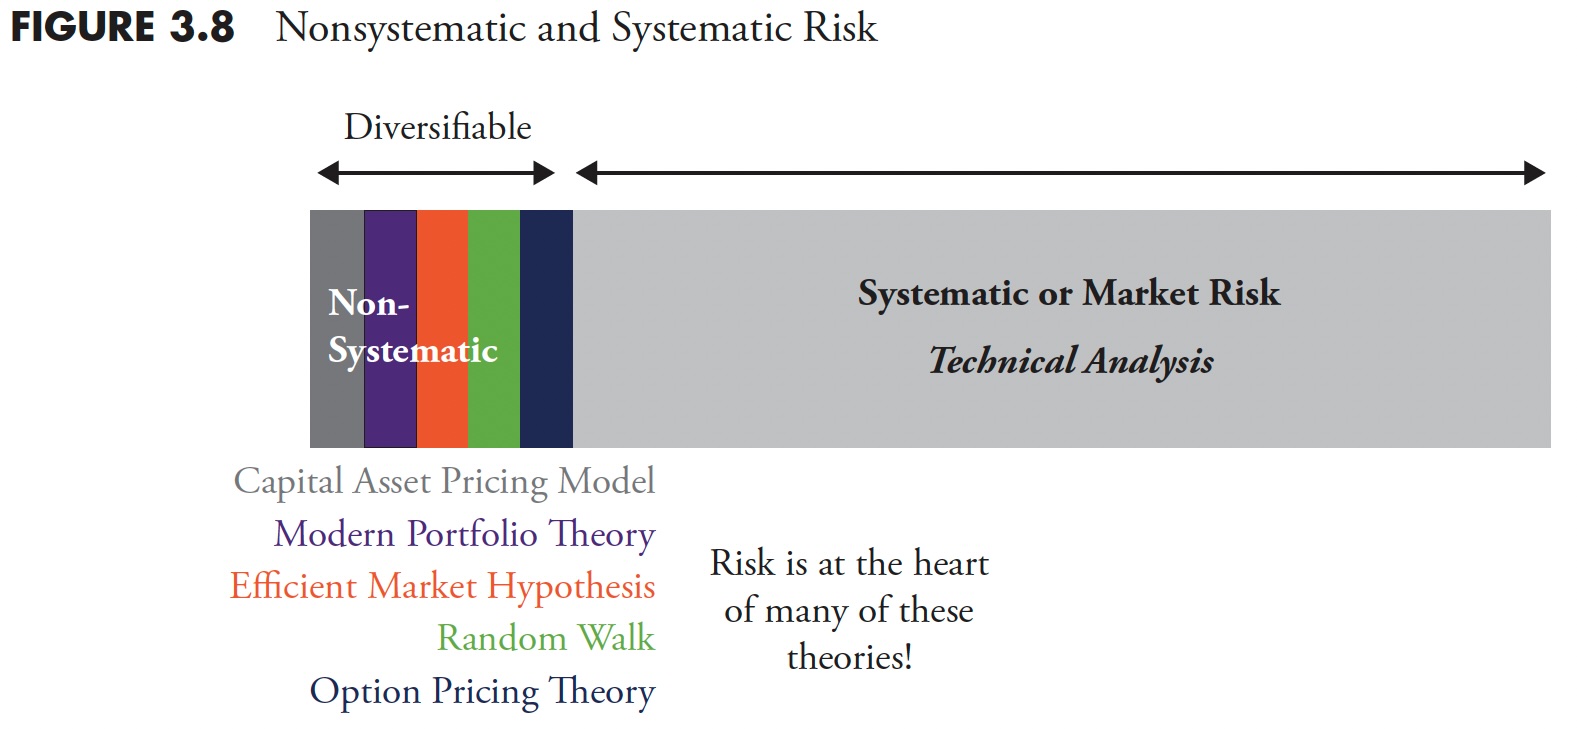
The Hoax of Modern Finance - Part 6: Is Volatility Risk?
by Greg Morris,
Veteran Technical Analyst, Investor, and Author
Note to the reader: This is the sixth in a series of articles I'm publishing here taken from my book, "Investing with the Trend." Hopefully, you will find this content useful. Market myths are generally perpetuated by repetition, misleading symbolic connections, and the complete ignorance of...
READ MORE
MEMBERS ONLY
The Halftime Show: Fed Stays Put, Bond Markets Rally!

by Pete Carmasino,
Chief Market Strategist, Chaikin Analytics
Uncertainty needs attention in order for it to make you second guess yourself. Instead, wait for trends to change, and then make changes. On this week's edition ofStockCharts TV'sHalftime, Pete Carmasino goes over some thoughts on interest rates and when the Fed will finally cut. He...
READ MORE
MEMBERS ONLY

Mastering MACD: The Fly-By Pattern
by Joe Rabil,
President, Rabil Stock Research
On this week's edition of Stock Talk with Joe Rabil, Joe discusses key aspects to MACD when viewed as an oscillator rather than a momentum indicator. He also explains how to use MACD combination signals as well as combining with the ADX indicator. He then covers the symbol...
READ MORE