MEMBERS ONLY

Dow Jones and S&P 500 Close At Record High -- Time to Add Tech Stocks To Your Portfolio?

by Jayanthi Gopalakrishnan,
Director of Site Content, StockCharts.com
KEY TAKEAWAYS
* Dow Jones Industrial Average and S&P 500 close at record highs
* Technology stocks are back in the spotlight, with the Nasdaq 100 closing up 1.95%
* Keep an eye on momentum and volatility as earnings reports continue to pour in
Tech stocks are striking back after...
READ MORE
MEMBERS ONLY

Tech and Semis Leading from the Dip

by TG Watkins,
Director of Stocks, Simpler Trading
The market was severely overbought going into the new year, so some steam was left off, which, as TG Watkins notes, we can see in the breadth readings. Now with notable names in the tech space leading and taking off, its time to get back in and see if the...
READ MORE
MEMBERS ONLY

These Stocks Have the HIGHEST PROBABILITY of Being Big Winning Trades -- and You Can Find 'Em in One Click

by Grayson Roze,
Chief Strategist, StockCharts.com
On this week's edition of StockCharts TV'sStockCharts in Focus, Grayson shows you the simplest way to find the market's strongest stocks with the highest probability of becoming big winners -- the Sample Scan Library. With this tool, you can scan for stocks making new highs...
READ MORE
MEMBERS ONLY
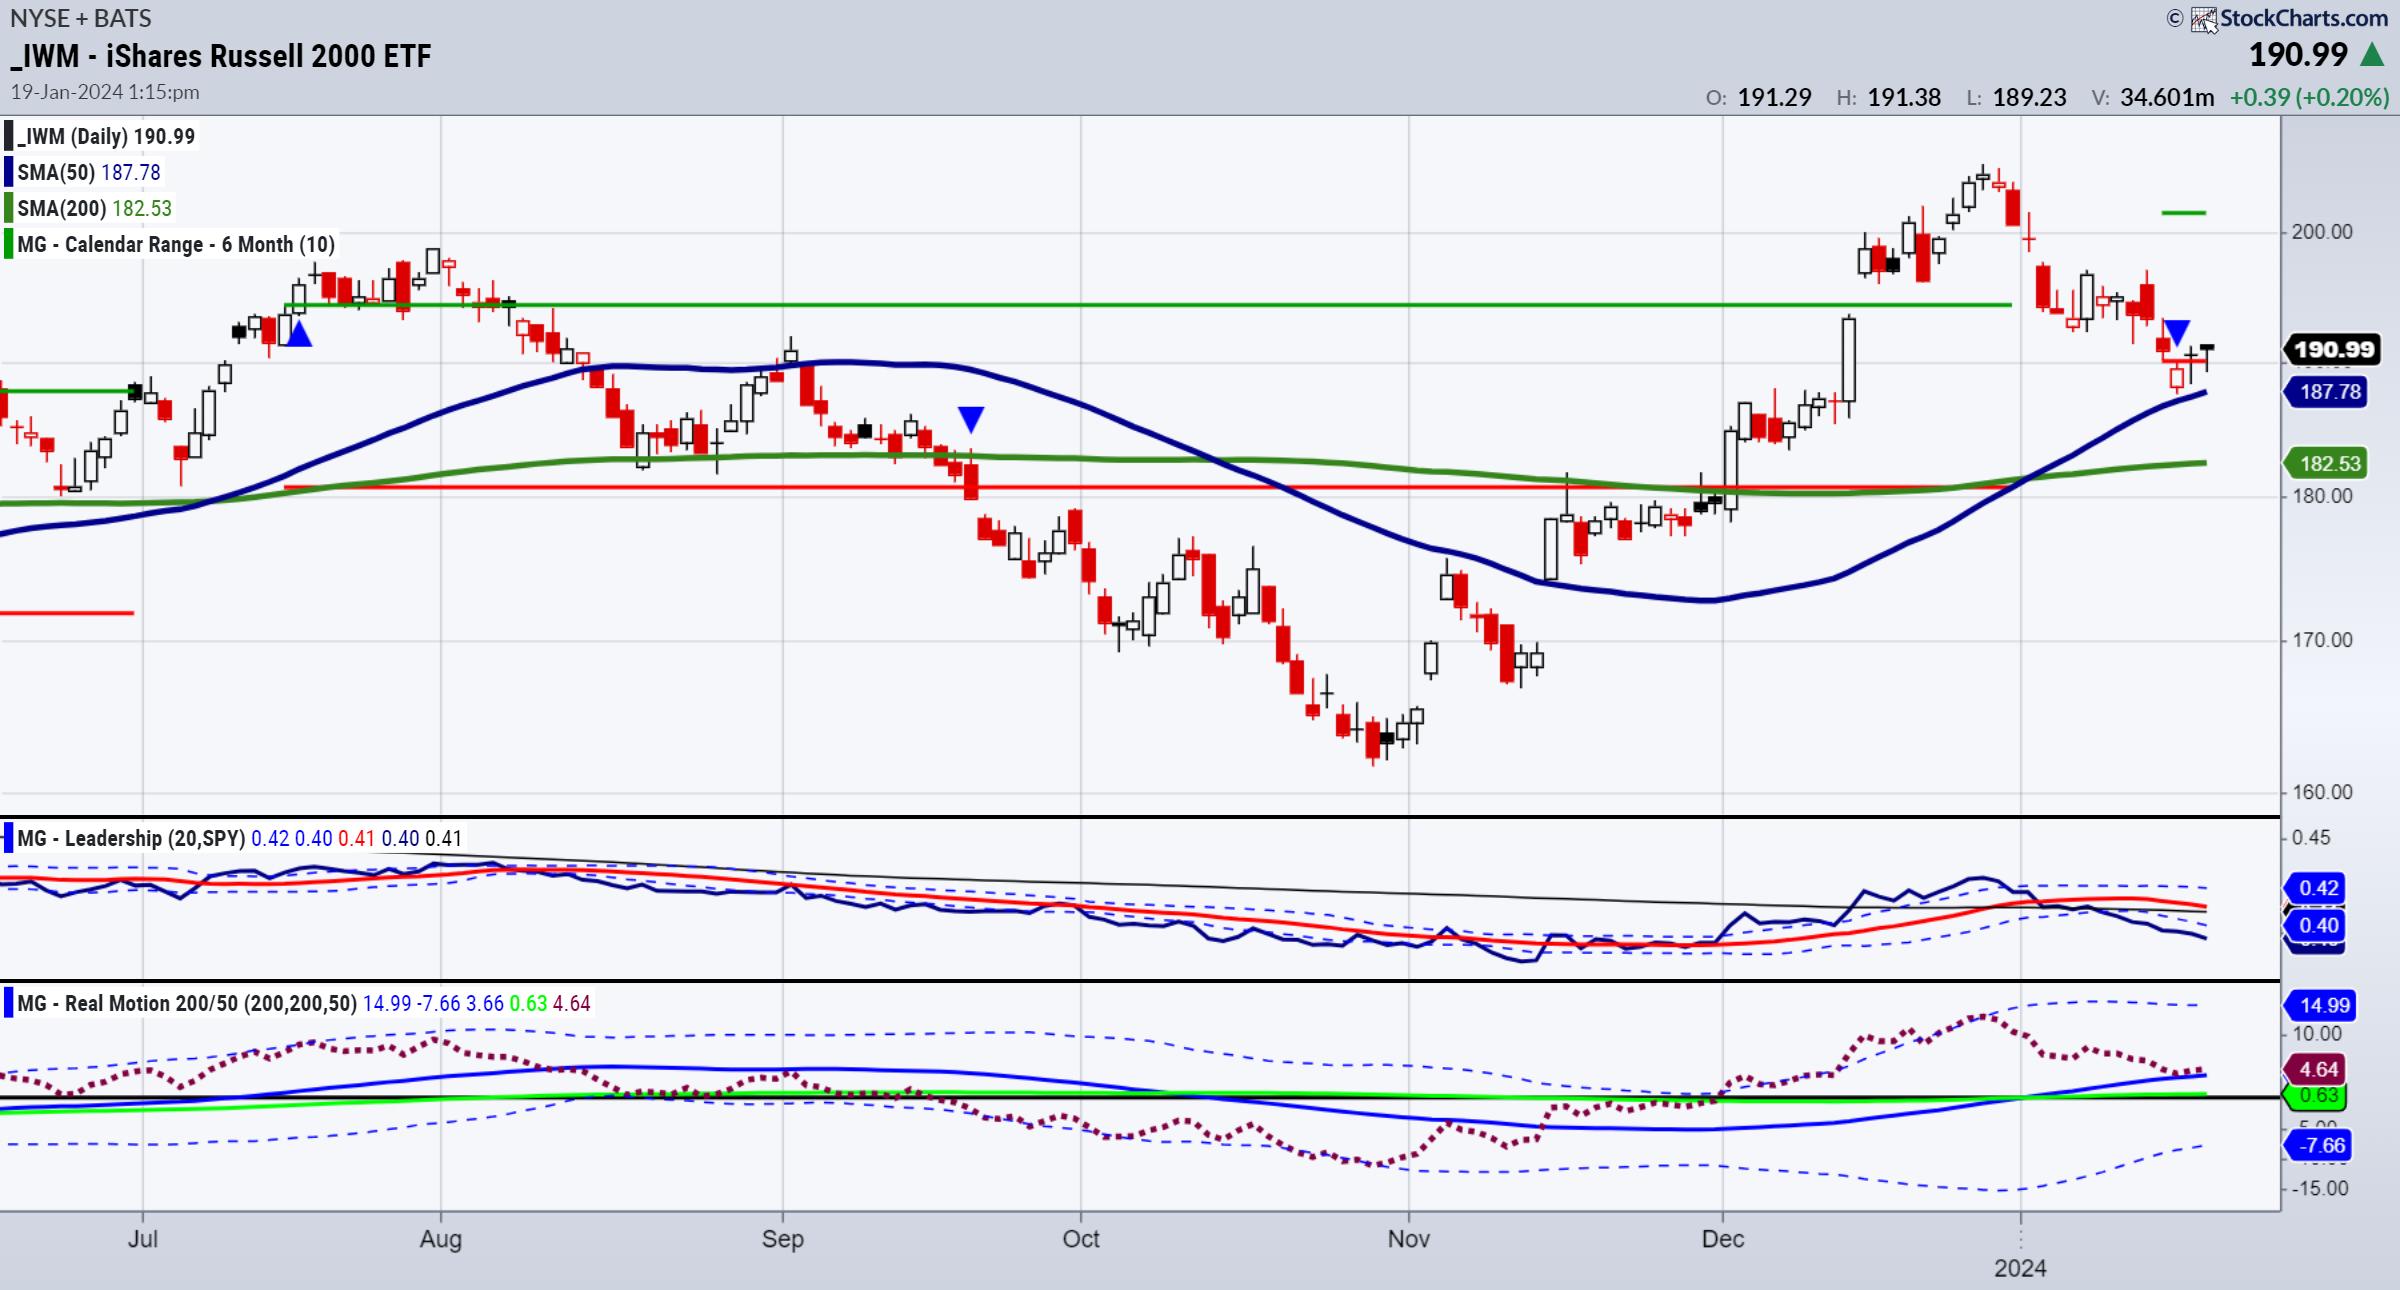
Economic Modern Family's Engine Idles While Growth Goes Fast and Furious
Let's get right to it. The charts and our tools are telling.
To start, I always look at moving averages and phases. Then I look at Real Motion and momentum to see if there is a divergence to price. After that, I check out our Leadership indicator which...
READ MORE
MEMBERS ONLY

Viewer Questions: How Does the Fed Manipulate the Yield Curve?

by David Keller,
President and Chief Strategist, Sierra Alpha Research
In this edition of StockCharts TV'sThe Final Bar, Dave hosts a special all-mailbag edition, answering viewer questions on leading vs. lagging indicators, arithmetic vs. log scale charts, and how the Fed manipulates the yield curve. He digs into specific trading strategies using RSI, MACD, On Balance Volume,...
READ MORE
MEMBERS ONLY
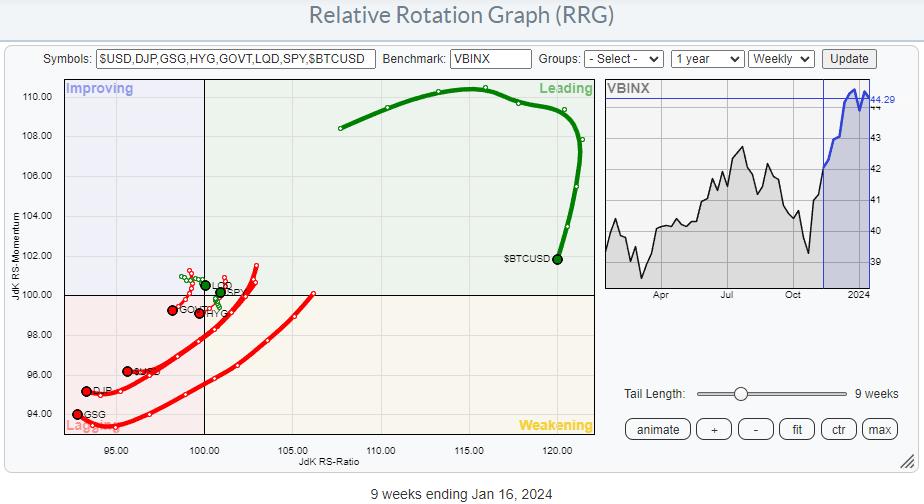
Watch Stocks Triumph in Latest Asset Allocation Battle

by Julius de Kempenaer,
Senior Technical Analyst, StockCharts.com
KEY TAKEAWAYS
* Commodities and USD rotating deep inside the lagging quadrant, indicating weak relative strength
* Bitcoin is in a strong relative uptrend vs all other asset classes, but going through a corrective phase
* Stocks are the clear winner in this asset allocation battle
The RRG above shows the rotation of...
READ MORE
MEMBERS ONLY

Technology Stocks Rise, but Market Internals Look Vulnerable
by Jayanthi Gopalakrishnan,
Director of Site Content, StockCharts.com
KEY TAKEAWAYS
* Nasdaq Composite index rises 1.35% thanks to semiconductor stocks and an upgrade for Apple
* The Nasdaq Composite is trading close to its 52-week high, but market breadth isn't sharing the bullish sentiment
* Market breadth indicators, such as the advance-decline issues and percent above...
READ MORE
MEMBERS ONLY

GNG TV: Active vs. Passive Investing

by Alex Cole,
Co-founder, GoNoGo Charts®

by Tyler Wood,
Co-founder, GoNoGo Charts®
As the S&P 500 digests the rally to all time highs, Alex and Tyler take a look at GoNoGo Trend® conditions of several areas of the market on this edition of the GoNoGo Charts show. Amongst US equity indices, the Nasdaq and S&P offer more constructive...
READ MORE
MEMBERS ONLY

Why SMALL CAPS MATTER in January 2024
by David Keller,
President and Chief Strategist, Sierra Alpha Research
In this edition of StockCharts TV'sThe Final Bar, guest John Kolovos, CFA CMT of Macro Risk Advisors describes how the market is reacting to "good overbought" conditions in late 2023, and why the Russell 2000 small cap ETF may be the chart to watch in Q1...
READ MORE
MEMBERS ONLY

Utilities' Unique Seasonal Powers: The Best Months to Invest

by Karl Montevirgen,
The StockCharts Insider
KEY TAKEAWAYS
* The Utilities sector has periods of cyclical outperformance
* Seasonality charts in StockCharts can identify which months Utilities are likely to outperform
* Analyzing a price chart of the XLU ETF can help time your entries so they coincide with seasonal patterns
The Utilities sector is known as a defensive...
READ MORE
MEMBERS ONLY

The Biggest Mistake Traders Make!

by Joe Rabil,
President, Rabil Stock Research
On this week's edition of Stock Talk with Joe Rabil, Joe explains the number one mistake he sees traders make. He shows how both day traders and swing traders can get so laser-focused that they miss key components necessary for a successful trade; he then discusses why...
READ MORE
MEMBERS ONLY

Has Rate Cut Anticipation Run Its Course?

by Carl Swenlin,
President and Founder, DecisionPoint.com
The Fed stopped raising rates in July, and, by mid-October, yields had peaked. Since then, yields have begun to decline in anticipation of the Fed beginning rate cuts this year. At this point, it appears that yields have found support and may possibly bounce, or begin moving sideways. This...
READ MORE
MEMBERS ONLY

Trend Trade: January 6-Month Calendar Range Reset!
We are super excited to announce that today starts the official January 6-month calendar range!
As you can see in the chart for Apple, the small red and green horizontal lines have appeared on one of our favorite platforms at StockCharts.com. In fact, Geoff Bysshe and I recently...
READ MORE
MEMBERS ONLY

USD Strength Accelerates After Completing Bearish Flag in EUR/USD
by Julius de Kempenaer,
Senior Technical Analyst, StockCharts.com
KEY TAKEAWAYS
* EUR/USD executes bearish flag formation
* Leaves rising trend channel by breaking rising support line as a result
After a rally from $1.045 to a high of $1.1140 from October to December 2023, the EUR/USD exchange rate has now executed a bearish flag formation, which...
READ MORE
MEMBERS ONLY

Sector Spotlight: Is the S&P 500 Facing a Double Top?
by Julius de Kempenaer,
Senior Technical Analyst, StockCharts.com
On this episode of StockCharts TV's Sector Spotlight, I look at asset class rotation and examine the continued preference for stocks over bonds. After that, I move on to sector rotation and the Technology sector, breaking it down into industry groups and plotting them on a Relative Rotation...
READ MORE
MEMBERS ONLY

The Case for a Tactical Stock Selloff
by David Keller,
President and Chief Strategist, Sierra Alpha Research
In this edition of StockCharts TV'sThe Final Bar, guest Adam Turnquist of LPL Financial lays out the case for a tactical selloff for stocks, as well as why long-term indicators remain constructive in early 2024. Dave breaks down the bearish momentum divergence prevalent in the technology sector,...
READ MORE
MEMBERS ONLY

Larry's "Family Gathering" January 16, 2024 Recording

by Larry Williams,
Veteran Investor and Author
In this video, Larry digs into rate cuts and how they affect the markets. When interest rates are high, money is in circulation. He's been watching the rate of inflation; as he notes, an object in motion tends to stay on the same path. He also warns against...
READ MORE
MEMBERS ONLY

Are Key Commodities Decoupling from Equities?
After a long weekend, the market action on January 16th held some surprises.
The Bullish Trends, or gainers, were the dollar and -- here is the surprise for some -- many different commodities. The Bearish Trends, or losers, were foreign currencies, long bonds, and (not shown on the chart) US equity indexes....
READ MORE
MEMBERS ONLY

"Family Gathering" Meeting Today at 2:00 PM Eastern
Today, Larry Williams will be hosting a "Family Gathering" meeting at 2pm Eastern Standard Time (11am Pacific). Sign-in in begins 5 minutes prior. The show will be recorded and posted online for those of you who cannot attend. Use the link below to join:
Link to Join...
READ MORE
MEMBERS ONLY
Buying Bitcoin ETFs is the Easy Part, But What Comes Next?

by Martin Pring,
President, Pring Research
Last week, eight new Bitcoin-based ETFs began trading courtesy of recent SEC approval. This launch was well anticipated, as the price had already run up in the hope that these new buyers would push it to an even higher level. The thought occurred to me that the situation is...
READ MORE
MEMBERS ONLY

View The Large Cap - Small Cap Debate in a Direct Comparison on RRG
by Julius de Kempenaer,
Senior Technical Analyst, StockCharts.com
KEY TAKEAWAYS
* Using RRG to see Large-Cap vs Small-Cap sector rotation
* The current strength for Small-Cap stocks vs Large-Caps is evident
At the end of last year, I wrote a blog article about the relationship between Large-Cap and Equal-Weight sectors. It involved plotting the...
READ MORE
MEMBERS ONLY

Sector Spotlight: RRG Showing Strong Rotation For Stocks in All Time Frames
by Julius de Kempenaer,
Senior Technical Analyst, StockCharts.com
KEY TAKEAWAYS
* Stocks Showing Relative Strength in All Time Frames on RRG
On this episode of StockCharts TV's Sector Spotlight, 2024's first episode, I dive into both Asset Class and Sector Rotation to set the stage for 2024. Today, I focus on a synchronized rotation of...
READ MORE
MEMBERS ONLY

Perspective And History Tell Us To Lower Our Expectations For Technology Stocks

by Tom Bowley,
Chief Market Strategist, EarningsBeats.com
No one loves a good bull market more than me. History tells us that we want remain mostly on the side of the bulls. Perma-bears have an awful long-term track record. They've called 30 of the last 3 secular bear markets. Honestly, those who cannot ever...
READ MORE
MEMBERS ONLY

Week Ahead: NIFTY In Uncharted Territory; Adopt This Simple Approach Towards Markets

by Milan Vaishnav,
Founder and Technical Analyst, EquityResearch.asia and ChartWizard.ae
After consolidating for most of the week, the markets extended their upmove and ended at yet another record lifetime high. In the past four out of five sessions, the markets were seen consolidating and staying under limited corrective retracement. However, they did find themselves taking support at the short-term...
READ MORE
MEMBERS ONLY

Using Two Timeframes to Increase the Odds - Starting with the Strategic View

by Arthur Hill,
Chief Technical Strategist, TrendInvestorPro.com
Chartists looking to increase their odds should consider two timeframes for their analysis. The longer timeframe sets the strategic tone, while the shorter timeframe defines the trading tactics. Strategically, I am interested in stocks with long-term uptrends. Tactically, I am looking for bullish continuation patterns to trade after a...
READ MORE
MEMBERS ONLY

The Secret Sauce! Expert Investors Use This to Anticipate Market Moves
by Grayson Roze,
Chief Strategist, StockCharts.com
On this week's edition of StockCharts TV'sStockCharts in Focus, Grayson shows you how to dig deeper into the markets like a true veteran chartist and put price history to work for you using Seasonality Charts. These simple, yet powerful historical charts let you see past price...
READ MORE
MEMBERS ONLY

MEM TV: The Easy Way to Uncover Stocks Poised to Outperform

by Mary Ellen McGonagle,
President, MEM Investment Research
In this episode of StockCharts TV'sThe MEM Edge, Mary Ellen takes a look at some of the items that drove price action last week. Growth stocks came roaring back for week two of 2024, which is great news for those that were believers last year. They can renew...
READ MORE
MEMBERS ONLY

S&P 4300 by End of February?
by David Keller,
President and Chief Strategist, Sierra Alpha Research
We kicked off the new year of 2024 with an overheated stock market, excessively bullish breadth indicators, and euphoric sentiment levels. While the first week in January felt like a "wake-up call" pullback for awestruck bulls, this last week saw the S&P 500 push right...
READ MORE
MEMBERS ONLY
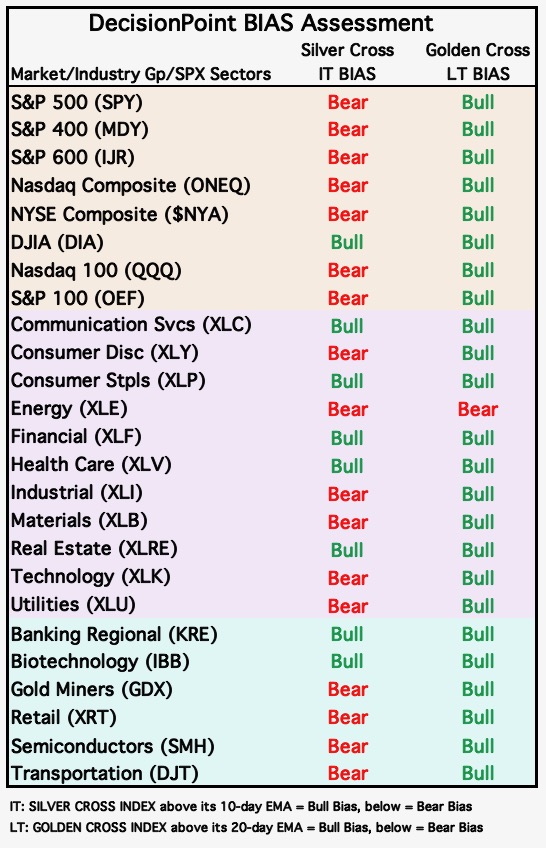
Dramatic Bearish Bias Shift on Major Market Indexes This Week
by Carl Swenlin,
President and Founder, DecisionPoint.com

by Erin Swenlin,
Vice President, DecisionPoint.com
(This is an excerpt from the subscriber-only DecisionPoint Alert on DecisionPoint.com)
This week, the markets experienced a dramatic bias shift. We measure the Intermediate-Term Bias using our Silver Cross Index (SCI). The SCI measures how many stocks within an index, sector, or industry group hold "silver...
READ MORE
MEMBERS ONLY

Stock Market Was Tentative This Week: S&P 500 Tested New High But Pulled Back
by Jayanthi Gopalakrishnan,
Director of Site Content, StockCharts.com
KEY TAKEAWAYS
* The stock market exhibited tentative behavior this week probably due to uncertainty about inflation and geopolitical developments
* S&P 500 index touched a high but pulled back to close slightly higher
* Crude oil prices broke above $75 but pulled back and is holding support at its 200-...
READ MORE
MEMBERS ONLY

Larry's First LIVE "Family Gathering" Webinar of 2024 Airs NEXT WEEK - Tuesday, January 16th at 2:00pm EST!
Larry is going LIVE! Don't miss the upcoming "Family Gathering" webinar with Larry Williams, airing live through Zoom this coming Tuesday, January 16 at 2:00pm Eastern Standard Time.
In this must-see event, Larry will be presenting his current opinions on a broad variety of...
READ MORE
MEMBERS ONLY

Is the Market Ready for Another Dip?
by TG Watkins,
Director of Stocks, Simpler Trading
On this week's edition of Moxie Indicator Minutes, TG points out how the market is still digesting the big move from the November/December run. It ran a huge sprint, and now needs to cycle down in order to create room for the next leg up. The internals...
READ MORE
MEMBERS ONLY

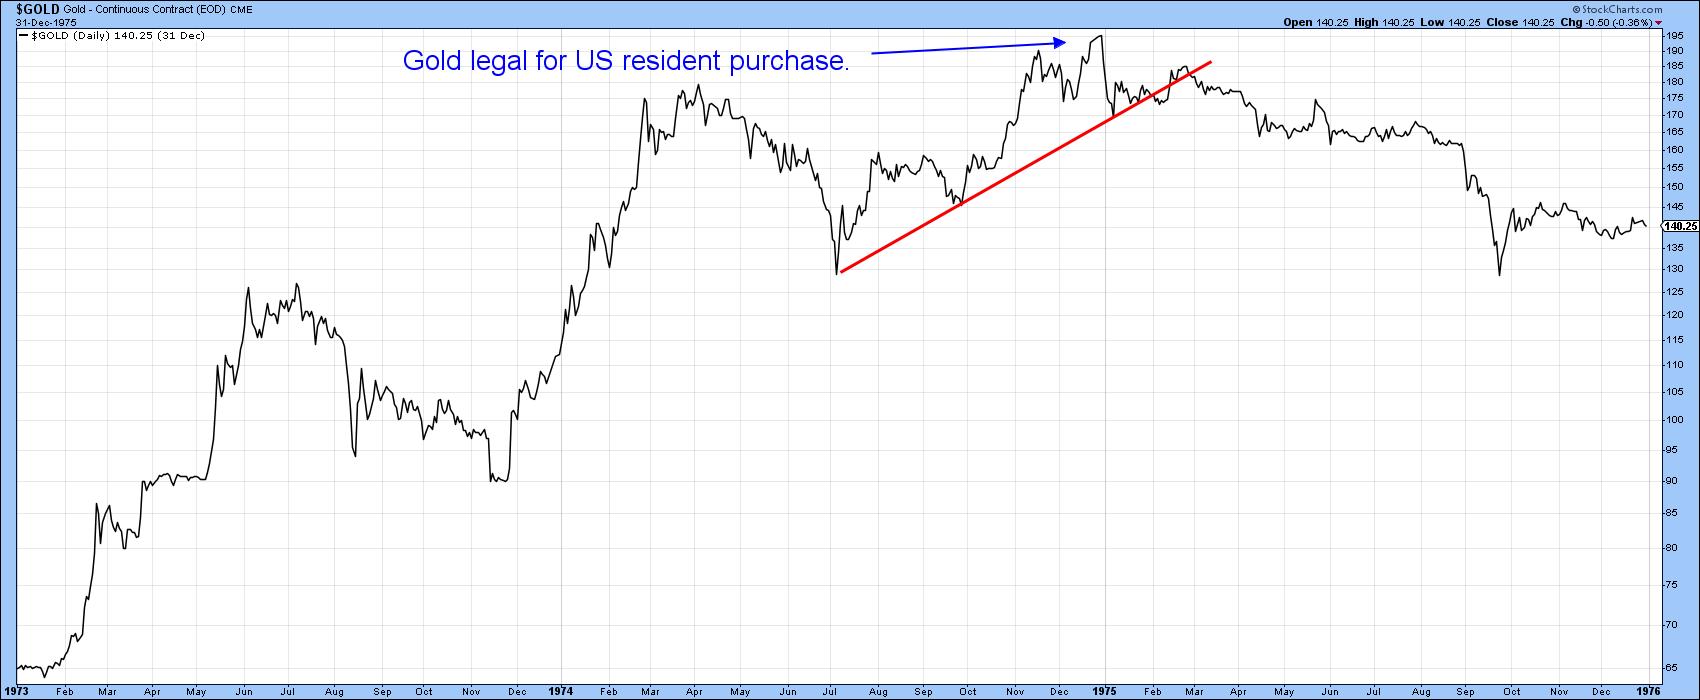
Drilling Down Into Gold and Silver
With the news on geopolitical escalation, soft versus hard landing, disinflation versus reinflation, growth versus value, and credit default versus available disposable income, gold and silver are even more interesting now.
Gold's behavior has been more of sell strength and buy weakness for some time. What has changed...
READ MORE
MEMBERS ONLY

GNG TV: Nothing "CRYPTIC" About These Go Trends!
by Alex Cole,
Co-founder, GoNoGo Charts®
by Tyler Wood,
Co-founder, GoNoGo Charts®
As the SEC approved spot Bitcoin ETFs Wednesday, investors in a broad basket of cryptocurrencies witnessed strengthening Go trends and substantial advances in trends which took hold in October 2023. In this edition of the GoNoGo Charts show, Alex and Tyler review current trends across asset classes and sector groups....
READ MORE
MEMBERS ONLY

Your Questions Answered! Moving Averages, Chart Patterns, Inflation & More
by David Keller,
President and Chief Strategist, Sierra Alpha Research
In this edition of StockCharts TV'sThe Final Bar, Dave presents a special all-mailbag episode, answering viewer questions on simple vs. exponential moving averages, the benefits of analyzing sector rotation, and a good first chart for beginners learning technical analysis.
This video originally premiered on January 12, 2024....
READ MORE
MEMBERS ONLY

XLV's Record Rally: The Must-Know Investment Move of the Year
by Karl Montevirgen,
The StockCharts Insider
KEY TAKEAWAYS
* The Healthcare Select SPDR ETF XLV has seen a 16% rise from its October low and is showing upside momentum
* Seasonal patterns in XLV show that July and November are the strongest months in terms of returns and higher close rates
* Combining seasonality patterns and technical indicators shows...
READ MORE
MEMBERS ONLY

Common Lessons Amongst Corporate, Sports & Investment Portfolio Turnarounds!

by Gatis Roze,
Author, "Tensile Trading"
My many decades of business, investing, and sports experience has shown me time and time again that parallel lessons in all three arenas are remarkably worthy teachers. One essential lesson today (January 2024) is to not allow yourself to become a "legend in your own mind." Yes, you...
READ MORE
MEMBERS ONLY

From Selloff to Surge: Growth Stocks Rebound After CPI
by David Keller,
President and Chief Strategist, Sierra Alpha Research
In this edition of StockCharts TV'sThe Final Bar, Dave highlights three leading growth stocks continuing to push to new swing highs. He also breaks down key market sentiment indicators, including the VIX, AAII survey, NAAIM Exposure Index, Rydex fund flows, and put/call ratios.
This video originally premiered...
READ MORE
MEMBERS ONLY

Markets: Recap of This Week's Market Dailies
I began the week focused on bank earnings, which we will wake up to tomorrow. In that Daily, I wrote, "one can assume that bank stocks, which already started off the year extremely well, have potential to shine.
"However, we know that assumptions can be tricky. There are...
READ MORE
MEMBERS ONLY

The Secret Behind My Moving Average "Buddy" System
by Joe Rabil,
President, Rabil Stock Research
On this week's edition of Stock Talk with Joe Rabil, Joe shows how the 18MA can be a powerful tool when used in conjunction with the 40MA line. First, Joe explains why he uses a 18MA instead of a 20MA, demonstrating how this MA line can act as...
READ MORE