MEMBERS ONLY

Moxie Indicator Alerts: Predicting Yesterday's Market Pullback!

by TG Watkins,
Director of Stocks, Simpler Trading
We had been patiently waiting for the action that happened yesterday, even though it was down. In this week's edition of Moxie Indicator Minutes, TG shows you real alerts from the Moxie Indicator Trading room that called the pullback before it happened, and presents how you too can...
READ MORE
MEMBERS ONLY

Stock Market Still Has Legs, Bitcoin Sees a Breakthrough Rally: Is the Market On the Mend?

by Jayanthi Gopalakrishnan,
Director of Site Content, StockCharts.com
KEY TAKEAWAYS
* The stock market makes major gains with the S&P 500 and Nasdaq Composite closing above previous highs
* The 10-Year Treasury yield retested its 4.5% level and reversed to the upside
* Bitcoin rallied to close the week above 37,000
It was quite the week...
READ MORE
MEMBERS ONLY

NASDAQ LEADS MARKET HIGHER -- SPX MAY BE BREAKING OUT -- SEMIS LEAD TECH STOCKS HIGHER

by John Murphy,
Chief Technical Analyst, StockCharts.com
NASDAQ CLEARS OCTOBER HIGH.. .After spending the week in a holding pattern, stocks are ending the week on a strong note and appear poised to continue their fourth quarter uptrend. Chart 1 shows the S&P 500 testing its mid-October high and nearing an upside breakout. Odds for...
READ MORE
MEMBERS ONLY

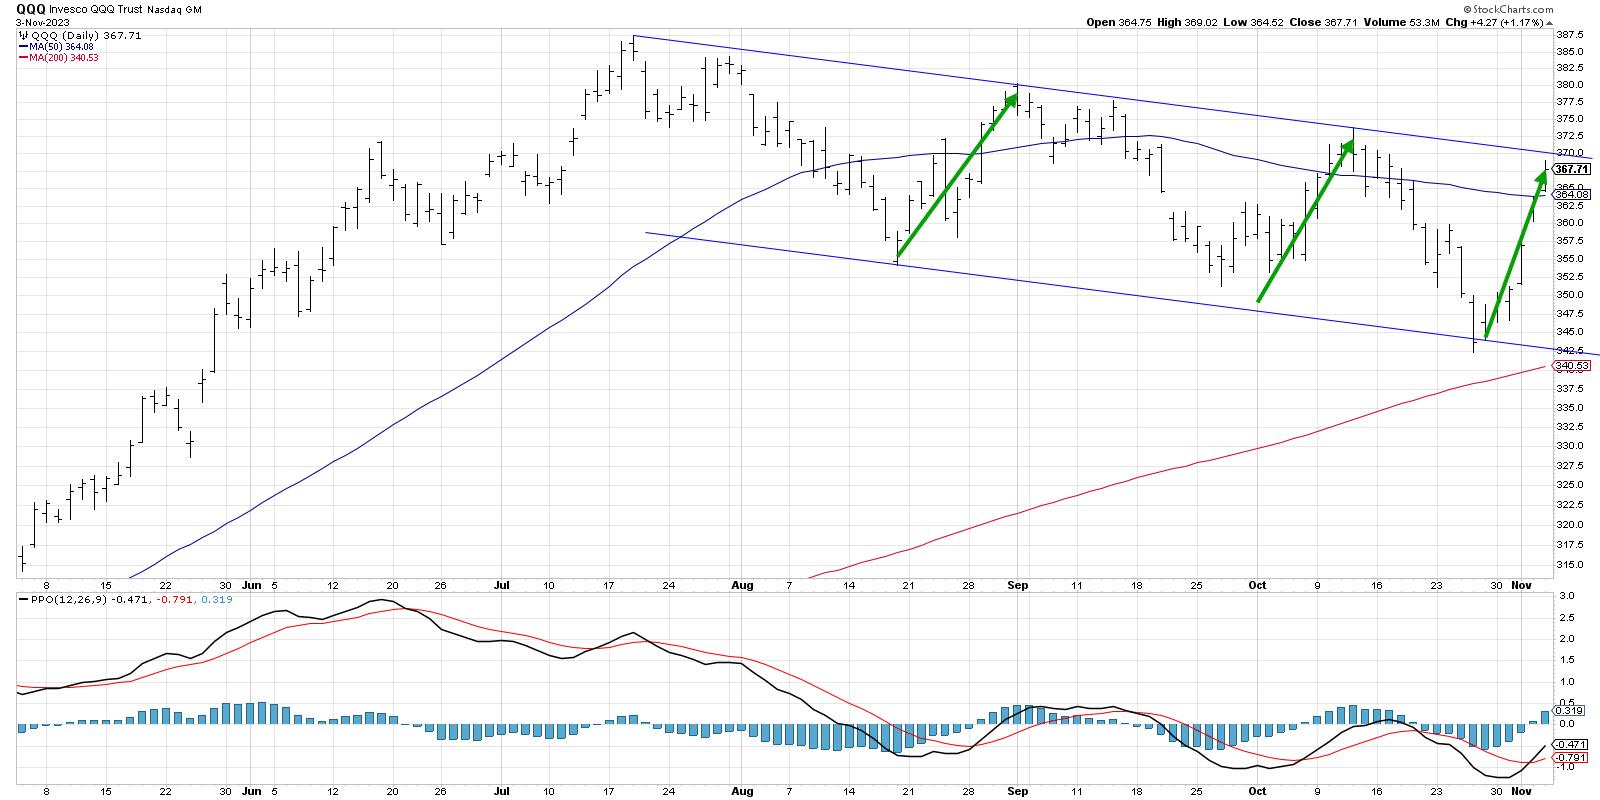
QQQ Breaking Out Again; Watch This Key Component Stock As It Breaks Out Too

by Tom Bowley,
Chief Market Strategist, EarningsBeats.com
I've already pointed out that I believe the July through October correction is over. I'm sticking to my earlier convictions that we'll experience a very strong finish in 2023, breaking out to all-time highs later in Q4 or sometime in Q1 2024. Growth...
READ MORE
MEMBERS ONLY

Find Great Trading Ideas By Combining SCTR Rankings and RRG

by Julius de Kempenaer,
Senior Technical Analyst, StockCharts.com
KEY TAKEAWAYS
* Combing Top SCTR rankings with Relative Rotation Graphs provides a powerful combination
* Confirmation between weekly and daily RRG tails sends strong signals
* PLTR, DKNG, COIN, ADBE, NVDA showing strong set-ups
One of the several widgets/panels I have on my dashboard is SCTR Reports. To visualize the...
READ MORE
MEMBERS ONLY

Top Ten Hidden Features of StockCharts, Features 6-10

by David Keller,
President and Chief Strategist, Sierra Alpha Research
In this edition of StockCharts TV'sThe Final Bar, Dave takes a closer look at some key features on StockCharts and how to use them in new and improved ways, in order to gain a deeper understanding of market dynamics and price behavior. You might even stumble upon some...
READ MORE
MEMBERS ONLY
The Halftime Show: Don't Believe Everything the Analysts Say, It's Dangerous!

by Pete Carmasino,
Chief Market Strategist, Chaikin Analytics
After TLT hit Pete's downside target, it had a violent move higher. On this week's edition ofStockCharts TV'sHalftime, Pete illustrates that the recent rally might be weakening.
A look at WTIC crude shows a pullback right on the level Pete uses as a pivot...
READ MORE
MEMBERS ONLY

This Relative Strength Signal Can Provide Early Warning Signs

by Joe Rabil,
President, Rabil Stock Research
On this week's edition of Stock Talk with Joe Rabil, Joe shows how to use comparative relative strength to identify important shifts in trend, sometimes well in advance of price. He explains what the line means, plus how to use it to provide early warning signals and for...
READ MORE
MEMBERS ONLY

Long-Term Bond Rally On the Way

by Carl Swenlin,
President and Founder, DecisionPoint.com
After making a major low in 1981, bonds entered a rising trend that lasted nearly 40 years. During that period, new rules and expectations were constructed and acquired that still influence decision making today -- which is unfortunate, because the game has changed.
In 2022, the long-term rising trend line...
READ MORE
MEMBERS ONLY

Stock Indexes Continue Winning Streak: Growth Stocks Still In the Lead
by Jayanthi Gopalakrishnan,
Director of Site Content, StockCharts.com
KEY TAKEAWAYS
* The S&P 500 and Nasdaq Composite continue their winning streak
* Crude oil continues to slide as it trades below its 200-day moving average
If there were one thing that was surprising about the stock market, it would be how quickly the charts changed in November....
READ MORE
MEMBERS ONLY

Top Ten Hidden Features of StockCharts, Features 1-5
by David Keller,
President and Chief Strategist, Sierra Alpha Research
In this edition of StockCharts TV'sThe Final Bar, Dave takes a closer look at some key features on StockCharts and how to use them in new and improved ways, in order to gain a deeper understanding of market dynamics and price behavior. You might even stumble upon some...
READ MORE
MEMBERS ONLY

The Best Traders ALWAYS Cherry-Pick Their Setups

by Dave Landry,
Founder, Sentive Trading, LLC
In this week's edition of Trading Simplified, Dave shows his methodology in action with two open trades, explaining why you must "cherry-pick" all setups and see subsequent positions through their fruition, even during less-than-ideal conditions. He also shows the recent TFM 10% sell...
READ MORE
MEMBERS ONLY

Sector Spotlight: Unleash The Power of Sector Analysis by Plotting Ratio Symbols on RRG
by Julius de Kempenaer,
Senior Technical Analyst, StockCharts.com
On this episode of StockCharts TV's Sector Spotlight, I take a look at current sector rotation while comparing cap-weighted sectors with equal weight sectors, trying to find areas of the market where either one of these is dominating. I then demonstrate how to use ratio symbols on...
READ MORE
MEMBERS ONLY
Why are Higher Interest Rates a Big Deal?
by David Keller,
President and Chief Strategist, Sierra Alpha Research
In this edition of StockCharts TV'sThe Final Bar, guest Mike Singleton of Invictus Research describes the impact of higher interest rates on consumer spending and growth stock valuations. Host David Keller, CMT charts the breakout for the QQQ and reviews stocks reporting earnings, including DKNG, UBER, and more....
READ MORE
MEMBERS ONLY
Market is UP After 10% Correction; Is a V Bottom in Place?
by TG Watkins,
Director of Stocks, Simpler Trading
The market has been signalling over-sold in multiple ways over the last 3 months, but we finally got a trigger, right around the 10% correction market plus FOMC. Powell was pretty neutral, but whatever it was, the market decided it liked it. So a V bottom appears to be...
READ MORE
MEMBERS ONLY
Benchmarks that Will Tell Us this Market Has Legs

by Martin Pring,
President, Pring Research
A couple of weeks ago, I wrote an upbeat article on the market, pointing out the fact that many short- and intermediate-term indicators were in a potentially bullish position at a time when stocks seemed impervious to bad news. I concluded "That does not mean the market will...
READ MORE
MEMBERS ONLY
This Key Resistance Level is Crucial for the S&P 500
by David Keller,
President and Chief Strategist, Sierra Alpha Research
In this edition of StockCharts TV'sThe Final Bar, Dave breaks down the charts of the S&P 500 and Nasdaq 100 with a focus on the downtrend channel for the QQQ and key resistance at 4400 for the S&P 500. He answers viewer questions on...
READ MORE
MEMBERS ONLY

DP Trading Room: This Powerful Scan Finds Stocks Showing NEW Momentum
by Carl Swenlin,
President and Founder, DecisionPoint.com

by Erin Swenlin,
Vice President, DecisionPoint.com
In this week's edition of The DecisionPoint Trading Room, Carl covers the major markets as well as the Dollar, Gold, yields, and Bitcoin. Erin runs her "Momentum Sleepers Scan" to find stocks that are showing new momentum under the surface. She uncovers a few stocks for...
READ MORE
MEMBERS ONLY

Bonds Got Clipped. Now What?

by Bruce Fraser,
Industry-leading "Wyckoffian"
Last week's sharp upward reversal in the bond market followed the FOMC Interest Rate decision. A decision to not change the Fed Funds Interest Rate target. Unlike the prior meeting ‘non-action', this decision inspired robust bond and stock buying by the investment community. The downward stride...
READ MORE
MEMBERS ONLY

Why We're Going Higher And Two Necessary Steps To Become A Better Trader
by Tom Bowley,
Chief Market Strategist, EarningsBeats.com
Trading isn't easy. It requires knowledge, experience, patience, discipline, risk management, preparation, research, and sometimes just old-fashioned good luck! After recognizing several cautious signals back in July, EarningsBeats.com suggested exercising patience to get us through whatever lied ahead. Well, hindsight now tells us that it was...
READ MORE
MEMBERS ONLY

Skip the Noise and Focus on the Signal by Effectively Using the 200-day SMA

by Arthur Hill,
Chief Technical Strategist, TrendInvestorPro.com
The S&P 500 is battling the 200-day SMA with four crosses over the last eleven days. We are also seeing a rise in volatility as this market benchmark plunged 5.86% in nine days (18-27 October) and then surged 5.85% the last five days. With...
READ MORE
MEMBERS ONLY

Week Ahead: Broader Markets Set to Relatively Underperform; Watch These Nifty Levels Closely

by Milan Vaishnav,
Founder and Technical Analyst, EquityResearch.asia and ChartWizard.ae
In the previous technical note, during our analysis of the patterns of the NIFTY's weekly chart, it was mentioned that the Index has achieved a full throwback. This occurs when the instrument gives up the breakout gains entirely and retests the original breakout point which acts as a...
READ MORE
MEMBERS ONLY
Trading the QQQ in Three Timeframes
by David Keller,
President and Chief Strategist, Sierra Alpha Research
KEY TAKEAWAYS
* The short-term trend for the QQQ is positive after this week's rally, but price is now at the upper edge of a downtrend channel.
* On the medium-term timeframe, the downtrend channel is still intact, and the momentum reading is still in line with a...
READ MORE
MEMBERS ONLY

GNG TV: S&P Rallies Back to 4300 - Is It a Go?

by Alex Cole,
Co-founder, GoNoGo Charts®

by Tyler Wood,
Co-founder, GoNoGo Charts®
In this edition of the GoNoGo Charts show, as equities rally right on seasonal cue, Alex and Tyler take a look across asset classes, sectors and review a few of the magnificent 7 that are holding up the broad cap-weighted indices. All that can be determined from this week&...
READ MORE
MEMBERS ONLY
New PMO Crossover BUY Signals Across All Major Indexes
by Erin Swenlin,
Vice President, DecisionPoint.com
Yesterday, the SPX (SPY), OEX (OEF) and Dow Industrials (DIA) all saw new PMO Crossover BUY Signals. Today, they were joined by the remainder of the major indexes. The market is clicking; now we need to determine how long this rally will stick around.
Seeing so many oversold PMO BUY...
READ MORE
MEMBERS ONLY

MEM TV: New BULLISH THRUST in the S&P 500

by Mary Ellen McGonagle,
President, MEM Investment Research
In this episode of StockCharts TV'sThe MEM Edge, Mary Ellen reviews the new uptrend in the markets and the areas that are best positioned to benefit. She also highlights how to use different timeframe charts to tell if a stock will continue to trend higher after gapping up...
READ MORE
MEMBERS ONLY
Top Ten Charts to Watch in November 2023
by David Keller,
President and Chief Strategist, Sierra Alpha Research

by Grayson Roze,
Chief Strategist, StockCharts.com
In this edition of StockCharts TV'sThe Final Bar, join Dave and Grayson as they break down the trends for the top ten stocks and ETF charts for November 2023. Watch as they identify key levels and signals to keep an eye out for using the power of StockCharts&...
READ MORE
MEMBERS ONLY

An Incredible Stock Market Rally Closes the Week on a Strong Note: The Best Week This Year, So Far
by Jayanthi Gopalakrishnan,
Director of Site Content, StockCharts.com
KEY TAKEAWAYS
* The Dow Jones Industrial Average, S&P 500, and Nasdaq Composite rally into the close
* Fed Chairman Jerome Powell's comments eased investor fears of further interest rate hikes
* Lower Treasury yields helped the banks, including regional banks
Five up days in a row for the...
READ MORE
MEMBERS ONLY

STOCKS SURGE ON FALLING BOND YIELDS -- REITS AND HOMEBUILDERS AMONG WEEKLY LEADERS --VIX TUMBLES AS STOCKS RISE
by John Murphy,
Chief Technical Analyst, StockCharts.com
TEN YEAR BOND YIELD MEETS RESISTANCE AT 5%... The 10-Year Treasury yield backed off sharply this week from long-term resistance near 5.00%. The upper box in Chart 1 also shows its 14-day RSI line peaking from overbought territory over 70 and falling to the lowest level...
READ MORE
MEMBERS ONLY
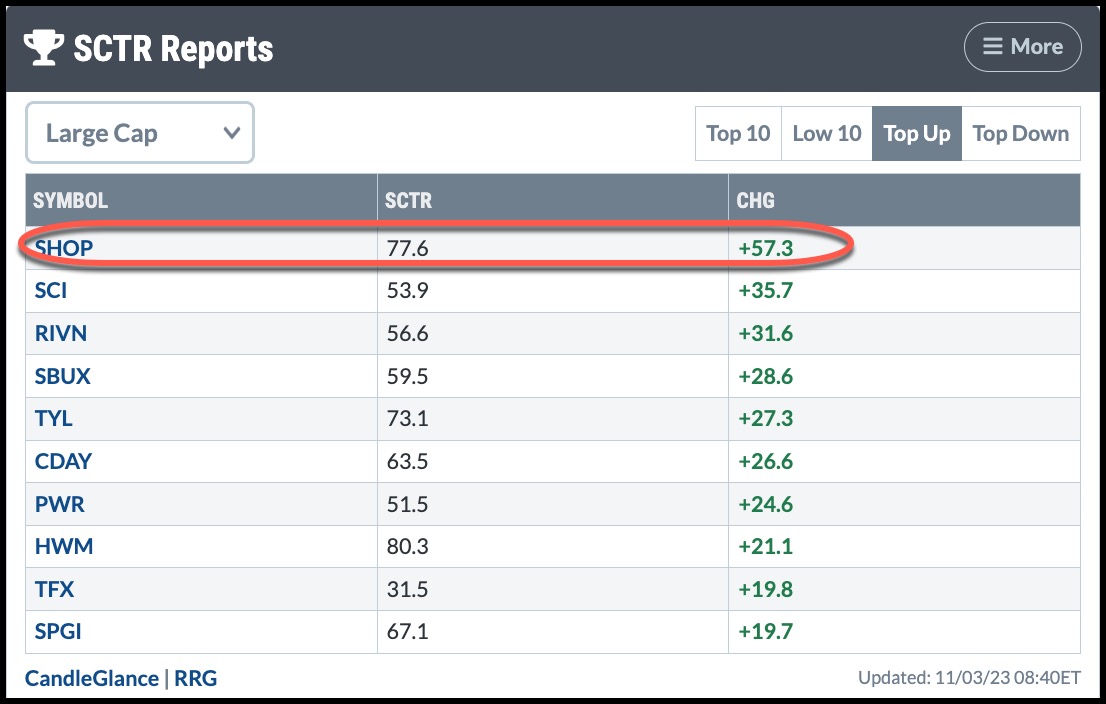
Shopify Stock Shatters Expectations: What You Need to Know About Its Rise

by Karl Montevirgen,
The StockCharts Insider
KEY TAKEAWAYS
* Shopify saw a significant surge of over 20% following a robust earnings report and guidance
* The daily price chart shows a breakaway gap from a prevailing near-term downtrend
* Breakaway gaps don't often fill, so if you are considering entering a position the stock has room...
READ MORE
MEMBERS ONLY
What Can the VIX Reveal To Us In November 2023?
by David Keller,
President and Chief Strategist, Sierra Alpha Research
In this edition of StockCharts TV'sThe Final Bar, Tim Hayes of Ned Davis Research shares an outlook for interest rates in 2024, and explains why a VIX over 28.5 could mean disaster for risk assets. Host David Keller, CMT updates charts of stocks reporting earnings including SBUX,...
READ MORE
MEMBERS ONLY
Start Trading Like a Pro with These RSI Divergence Signals!
by Joe Rabil,
President, Rabil Stock Research
On this week's edition of Stock Talk with Joe Rabil, Joe presents a few examples in different timeframes of how to use the RSI indicator for divergences. He explains what to look for when finding counter trend plays, as well as divergence with the trend. Joe then analyses...
READ MORE
MEMBERS ONLY
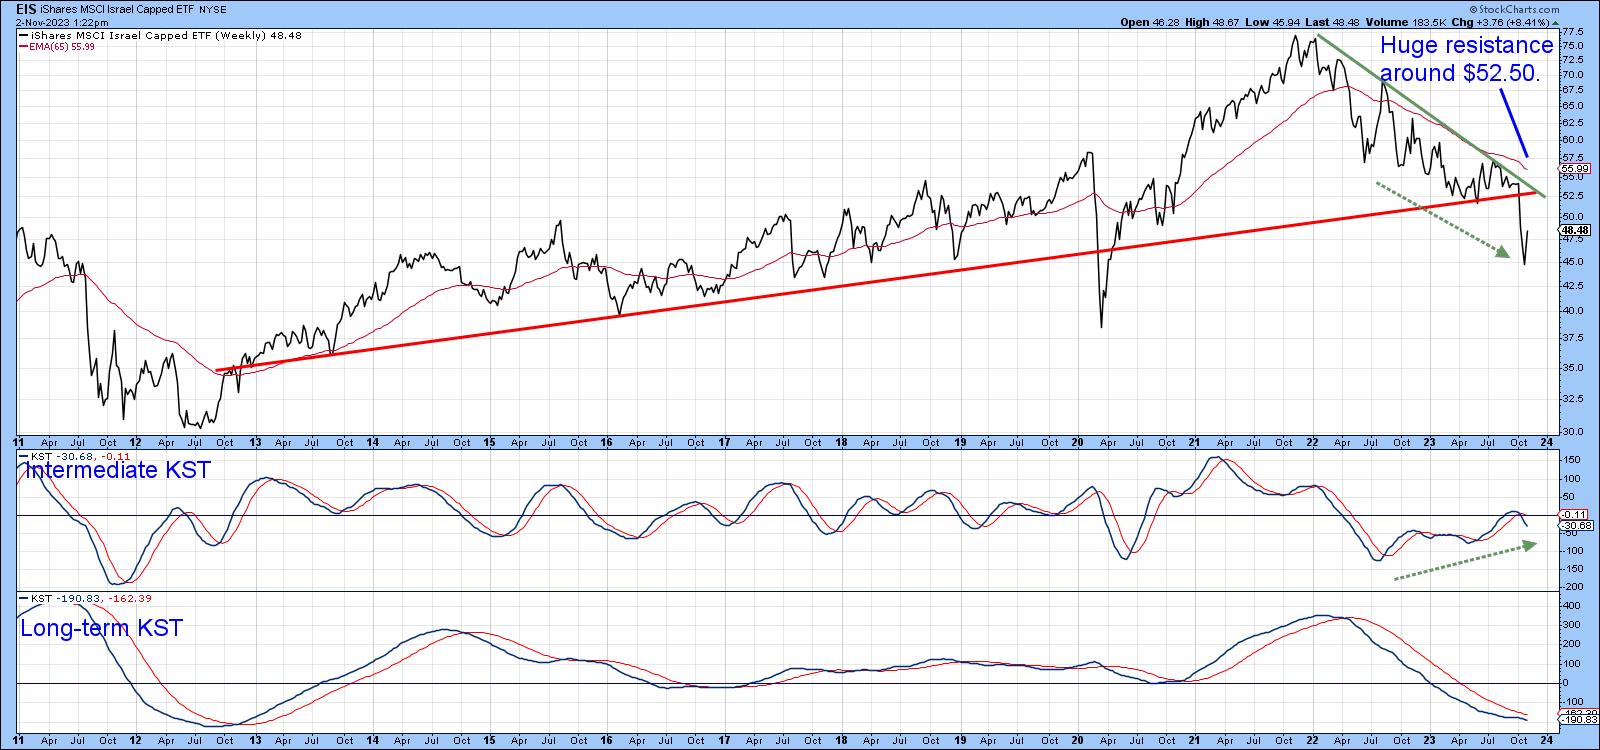
This Country ETF Rallies Sharply After War Breaks Out
by Martin Pring,
President, Pring Research
Understandably, most Middle Eastern country ETFs have performed poorly since the war broke out, but there is one noticeable exception, which I will get to later.
Israel
First, as might be expected, the iShares Israel ETF (EIS) has moved lower and completed what looks to be a massive top. The...
READ MORE
MEMBERS ONLY

Holiday Shopping Bonanza: Retail Stocks You Need to Watch
by Karl Montevirgen,
The StockCharts Insider
KEY TAKEAWAYS
* Since holiday shopping season is here it could be a good time to add some retail stocks to your portfolio
* AMZN, WMT, COST, and TGT could be potential stocks to add to your portfolio as holiday shopping begins
* Set alerts for these stocks so you can enter at...
READ MORE
MEMBERS ONLY
Sector Spotlight: Monthly Charts Suggest Downside Risk is Limited
by Julius de Kempenaer,
Senior Technical Analyst, StockCharts.com
On this episode of StockCharts TV's Sector Spotlight, I address the completed monthly charts for October and assess the condition of the long term trends, along with whether they are still in play or have shifted. As usual, I start with the long-term rotation and trends in...
READ MORE
MEMBERS ONLY

Signs of Top in Rates As Fed Says NO CHANGE
by David Keller,
President and Chief Strategist, Sierra Alpha Research
In this edition of StockCharts TV'sThe Final Bar, Katie Stockton, CMT of Fairlead Strategies shares her weekly charts of the S&P 500, VIX, and XLK and identifies three areas of opportunity through year-end 2023. Dave breaks down this week's Fed meeting from a...
READ MORE
MEMBERS ONLY

Focus on Stocks: November 2023

by Larry Williams,
Veteran Investor and Author
The Million Dollar Stock Market Bet
Warren Buffett proved his point in 2016 when he bet $1,000,000 that the S&P 500 Stock Index would outperform hedge funds. His bet was that active investment management by professionals would under-perform the returns of people who were passively...
READ MORE
MEMBERS ONLY

Arista Networks: A Profitable Tech Stock That Has Room to Surge
by Jayanthi Gopalakrishnan,
Director of Site Content, StockCharts.com
KEY TAKEAWAYS
* AI will need networks to support its development and growth and one stock that can benefit in this space is Arista Networks
* The stock is trading above its 50-day moving average and hit a new 52-week high
* The stock is outperforming the S&P 500...
READ MORE
MEMBERS ONLY
Stock Market Hinges on the Ten Year Interest Rate
by David Keller,
President and Chief Strategist, Sierra Alpha Research
In this edition of StockCharts TV'sThe Final Bar, Tony Dwyer of Canaccord Genuity breaks down four charts that speak to a potential tactical rally for the S&P 500, and explains why this market is still all about interest rates. Meanwhile, Dave charts the downtrend channel for...
READ MORE
MEMBERS ONLY
The Halftime Show: Harness The Strength of Power Gauge on ACP Platform
by Pete Carmasino,
Chief Market Strategist, Chaikin Analytics
On this week's edition of StockCharts TV'sHalftime, Pete starts the show with a review of the Chaikin Power Gauge and demonstrates how to access to the tool on the ACP platform. Pete then reviews a few names that are moving big today, like Amgen (AMGN) and...
READ MORE