MEMBERS ONLY

DP Trading Room: Carl's Detailed Look at Gold

by Erin Swenlin,
Vice President, DecisionPoint.com

by Carl Swenlin,
President and Founder, DecisionPoint.com
On this week's edition of The DecisionPoint Trading Room, Carl is peppered with questions on Gold, Financials/Regional Banks, Bonds and Yields. He looks at Gold in all three timeframes and discusses why it will likely move even higher. Carl's take on the Banking crisis and...
READ MORE
MEMBERS ONLY
Get Ready for the Consumer Price Index!
Given the recent liquidity crisis in the banking sector, Tuesday morning's CPI number could be an important driver in the Federal Reserve's next move on March 22nd.
As per the report, How to Grow Your Wealth in 2023, "The Federal Reserve is overly optimistic about...
READ MORE
MEMBERS ONLY

Long Bonds: Island Bottom and the Signal of Chaos
On March 7th, we asked "Will the Market Internals Turn More Bearish"?
While we focused mainly on Jerome Powell's testimony, when he said "if the totality of the data were to indicate that faster tightening is warranted, we would be prepared to increase the pace...
READ MORE
MEMBERS ONLY

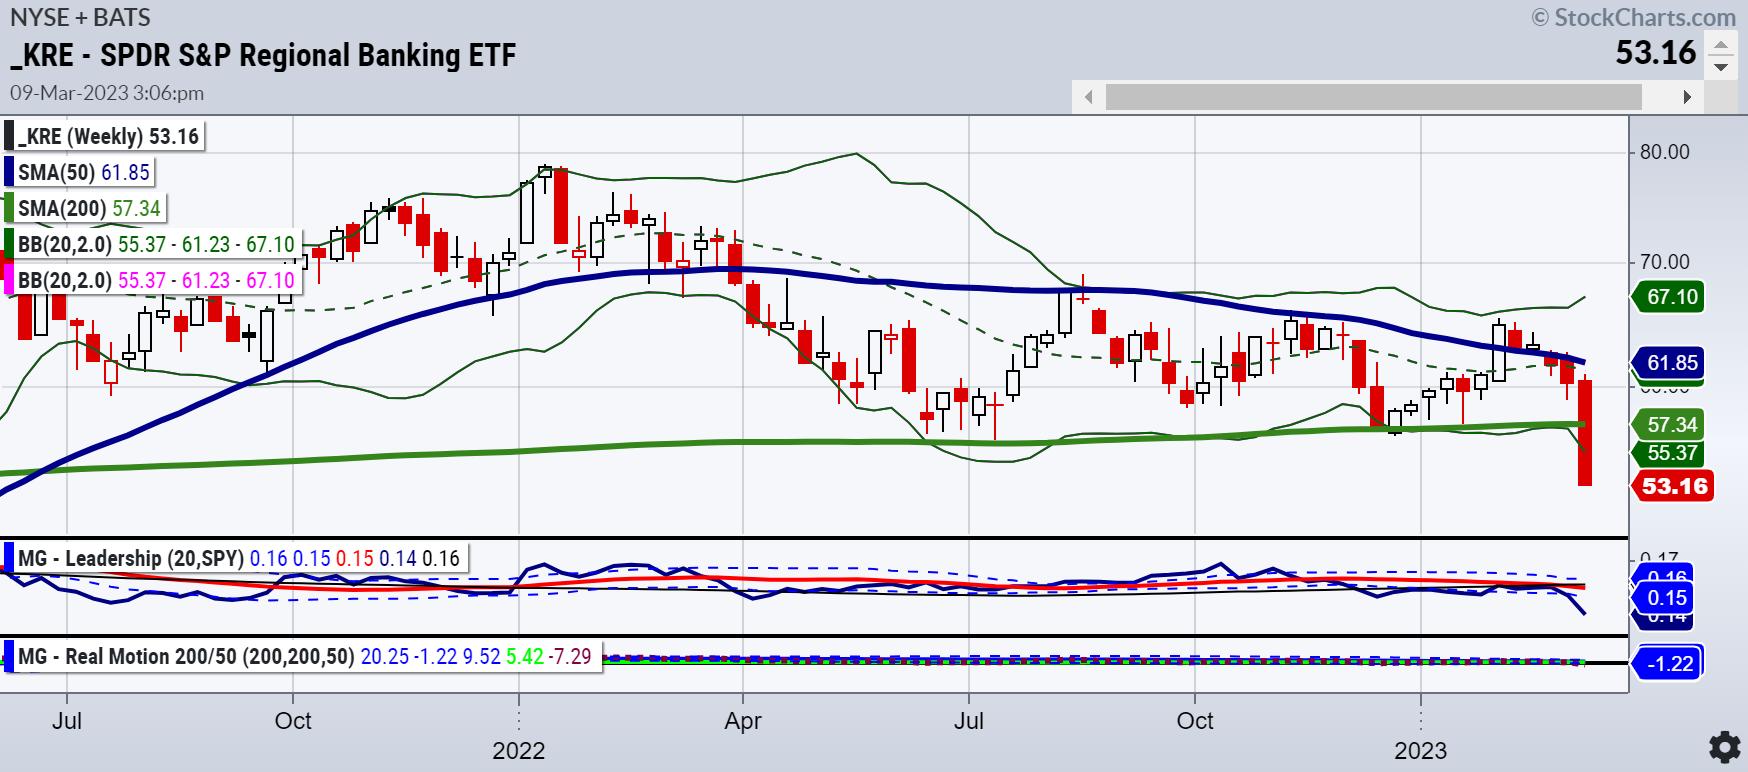
Will the Banking Sector Collapse Bring Down the Market?
by Carl Swenlin,
President and Founder, DecisionPoint.com
While the Banking Sector (KRE) collapsed this week due to the Silvergate and Silicon Valley Bank failures, we can see where participation has been deteriorating for more than a month. The bottom three panels on the chart below shows how the Percent of Stocks Above the 20/50/200EMAs began...
READ MORE
MEMBERS ONLY

Week Ahead: NIFTY Stares at Important Supports; Staying Above These Levels Would Be Crucial

by Milan Vaishnav,
Founder and Technical Analyst, EquityResearch.asia and ChartWizard.ae
The truncated week remained quite volatile; the markets were all over the place, and the week ended on a negative note. The volatility over the last two days was fueled by the testimony of FOMC chief Jerome Powell, who showed all the indications of continuing with the hikes; he also...
READ MORE
MEMBERS ONLY

Trend Signals and Trailing Stop Examples using XLF and SOXX

by Arthur Hill,
Chief Technical Strategist, TrendInvestorPro.com
Chartists considering a trend-following strategy can use the Trend Composite to identify trend signals and then turn to the ATR Trailing Stop for an exit strategy. A bearish Trend Composite signal could also be used as an exit strategy, but these signals usually trigger later than the ATR Trailing Stop...
READ MORE
MEMBERS ONLY

MEM TV: Negative News Reverses Uptrend

by Mary Ellen McGonagle,
President, MEM Investment Research
In this episode of StockCharts TV'sThe MEM Edge, Mary Ellen reviews next areas of support for the downtrending markets while highlighting what to be on the lookout for in oversold Bank stocks. She also shares best practices for formulating a watch list in anticipation of a stronger period...
READ MORE
MEMBERS ONLY
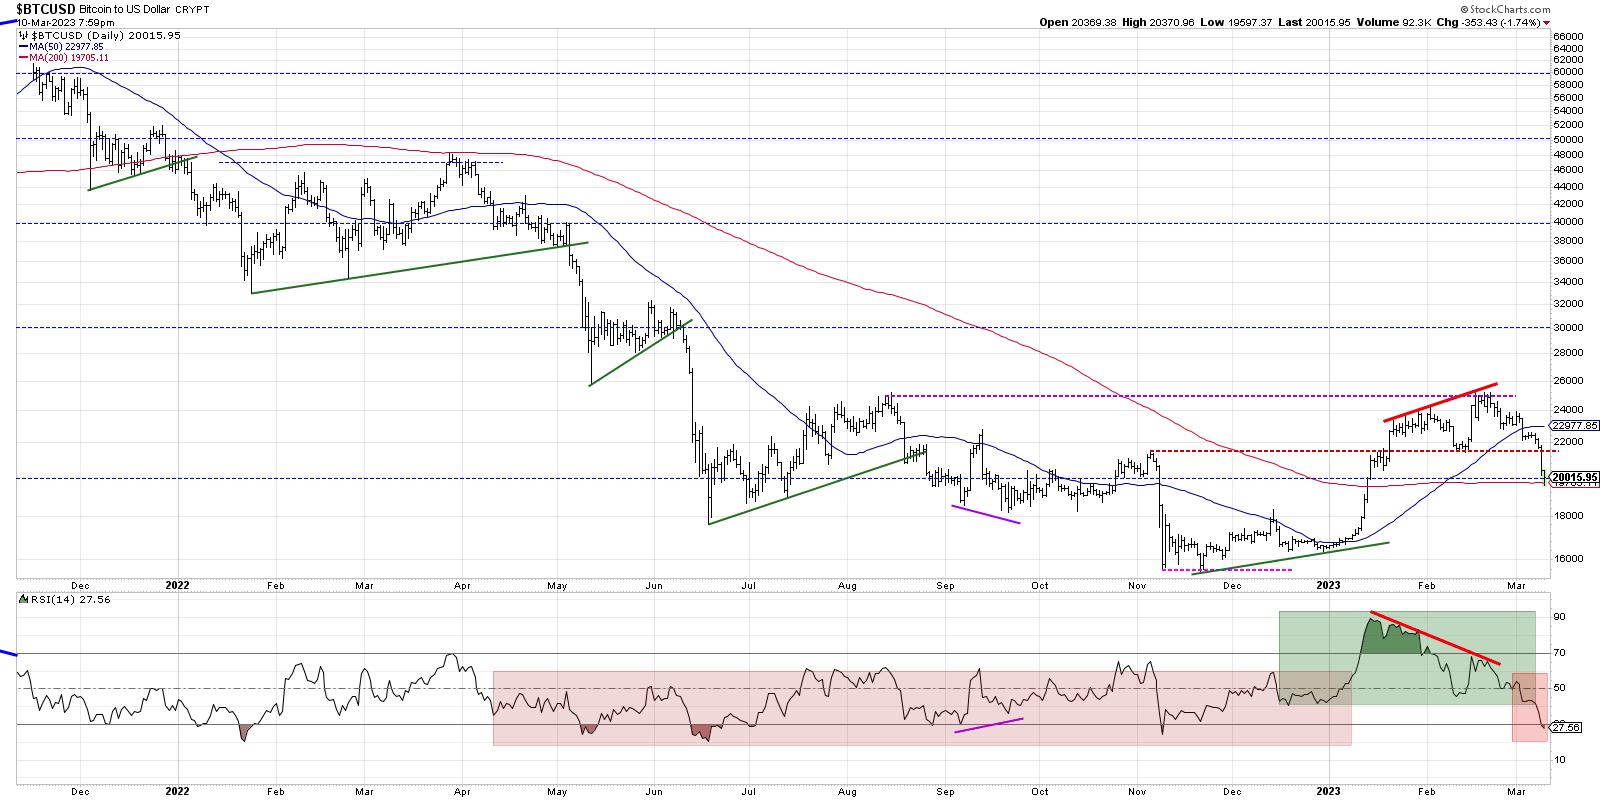
Downside for Bitcoin as Cryptos Crumble

by David Keller,
President and Chief Strategist, Sierra Alpha Research
I'm a big fan of playing the long game as an investor, particularly for long-term accounts that should arguably not be affected by short-term market fluctuations. Talking with experts like Jon Markman, author of Fast Forward Investing, has reminded me that overarching themes like artificial intelligence, electric vehicles,...
READ MORE
MEMBERS ONLY

Isolating Indicators to Bring Focus & Clarity to Your Charting

by Grayson Roze,
Chief Strategist, StockCharts.com
On this week's edition of StockCharts TV'sStockCharts in Focus, Grayson shows you how to isolate specific indicators on your charts and save them into their own specific ChartStyles. By breaking your charts apart and focusing only on one indicator at a time, you can bring more...
READ MORE
MEMBERS ONLY

Stock Market Fallout: How To Tweak Your Investment Strategy

by Jayanthi Gopalakrishnan,
Director of Site Content, StockCharts.com
The stock market has been struggling the last few days, losing all gains made earlier this month (March). It's almost as if there's a tug of war between investors and the news. In the last couple of months, it was between investors and the Fed, but...
READ MORE
MEMBERS ONLY
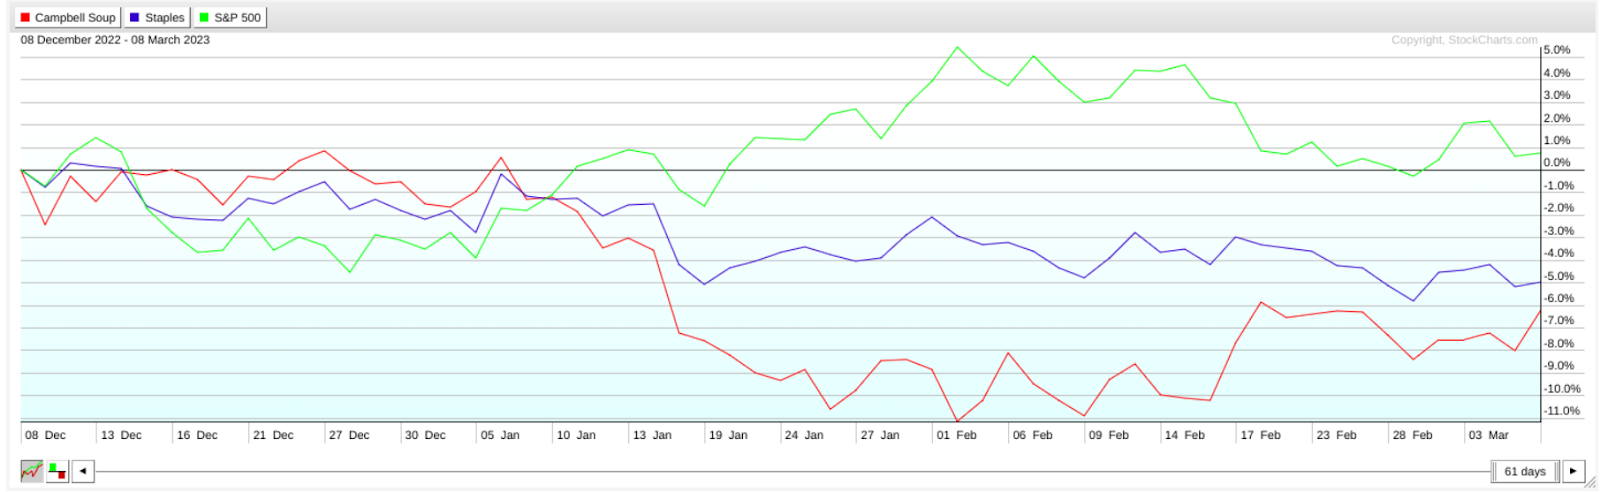
Campbell Soup: Warm Comfort for an Ailing Economy?

by Karl Montevirgen,
The StockCharts Insider
Two big things about Campbell Soup (CPB):
* First, the company crushed it in earnings last Wednesday. Its second-quarter FY23 results delivered an upside surprise, with an EPS that was 8.37% higher than analysts expected and revenue 2.21% higher than Wall Street estimates.
* Second, CPB is rising from the...
READ MORE
MEMBERS ONLY

COLLAPSE IN BANK STOCKS LEADS MARKET LOWER -- PLUNGE IN INTEREST RATES BOOSTS BONDS

by John Murphy,
Chief Technical Analyst, StockCharts.com
BANK INDEX COLLAPSES... A plunge in bank stocks this week has inflicted heavy technical damage on that group and is weighing heavily on the rest of the market. The weekly bars in Chart 1 show the KBW Bank Index losing -16% on the week and falling to the lowest level...
READ MORE
MEMBERS ONLY

Did Systemic Risk Just Show Up?

by TG Watkins,
Director of Stocks, Simpler Trading
The news of SIVB getting into trouble sent huge waves through the market. Financials and bank stocks cratered which then brought the rest of the market down. In this week's edition of Moxie Indicator Minutes, TG explains question now, which is "are rising interest rates the risk,...
READ MORE
MEMBERS ONLY
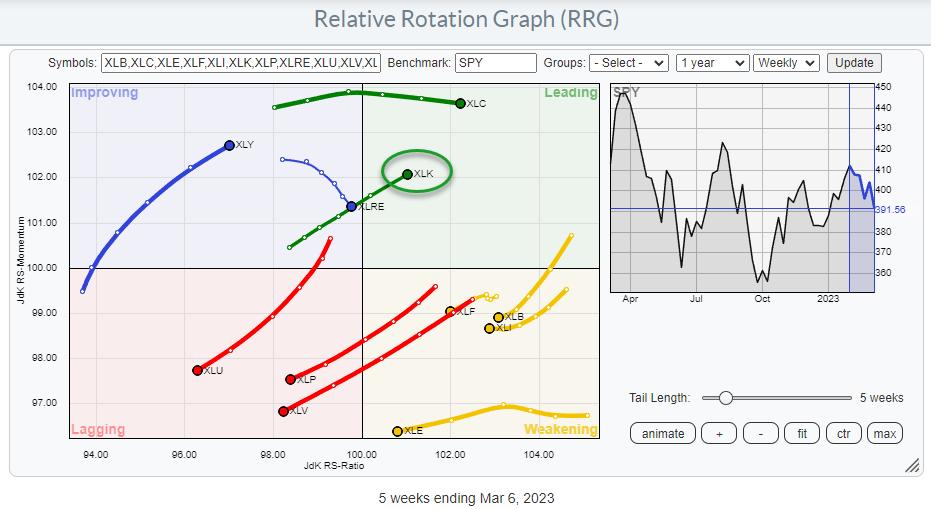
SPY Dips But Tech Is Now Back On Track

by Julius de Kempenaer,
Senior Technical Analyst, StockCharts.com
Right now, it seems the most enticing tail on the relative rotation graph for US sectors is that of XLK, the technology sector. XLK has been in a strong RRG heading for a few weeks already, crossing over into the leading quadrant last week, and has continued to push further...
READ MORE
MEMBERS ONLY
Regional Banks: From March 6 to March 9
We could call this "3 Days to All Hell broke loose."
We could call this "We told you so."
We could call this, "Welcome to the incredible forecasting of the Economic Modern Family."
We could call this, "Hello delusional semiconductors."
Whatever you...
READ MORE
MEMBERS ONLY

GNG TV: Equities Struggle Short-Term, Industrials Offer Glimmer of Hope

by Alex Cole,
Co-founder, GoNoGo Charts®

by Tyler Wood,
Co-founder, GoNoGo Charts®
In this week's edition of the GoNoGo Charts show, Tyler and Alex present their weight-of-the-evidence approach to trend following using top down analysis. Starting with the GoNoGo Asset Map, we see that Equities have struggled again on the daily basis, but perhaps there is some constructive activity on...
READ MORE
MEMBERS ONLY

Using ADX/DI to Study Buyers vs. Sellers

by Joe Rabil,
President, Rabil Stock Research
On this week's edition of Stock Talk with Joe Rabil, Joe discusses the ADX indicator and what the 2 DI lines mean in layman's terms. He explains how this indicator can give us insight to the Buyers as well as the Sellers, and shows what to...
READ MORE
MEMBERS ONLY

Accepting & Closing the Knowledge Gap

by Dave Landry,
Founder, Sentive Trading, LLC
A knowledge gap will leave you to believe that if you only knew more, you wouldn't have losing trades. Sometimes even the best setups fail miserably. Other times, your methodology is valid, but your stock (or other market) selection could use a little improvement. In this week'...
READ MORE
MEMBERS ONLY

How Long Can Semiconductors Lead the Market?
With Jerome Powell so data-dependent, as he stated on his second and last day of testimony, it seems pretty obvious where most of the growth and labor strength is coming from.
This isn't the first time we have seen semiconductors lead the market, and we can say that...
READ MORE
MEMBERS ONLY

Finance, Family, Society: Finding a Good Balance
by Jayanthi Gopalakrishnan,
Director of Site Content, StockCharts.com
Whether employed in a financial institution, or learning the ropes on your own, women in finance, all over the world, face similar challenges. We conclude our conversations with women in finance with three who followed different paths but confronted similar bottlenecks. Let's find out how Jane Gallina (Airplane...
READ MORE
MEMBERS ONLY

Will the Market Internals Turn More Bearish?
Jerome Powell brought reality to the market.
"The latest economic data have come in stronger than expected, which suggests that the ultimate level of interest rates is likely to be higher than previously anticipated," Powell told the Senate Banking Committee in prepared remarks. "If the totality of...
READ MORE
MEMBERS ONLY
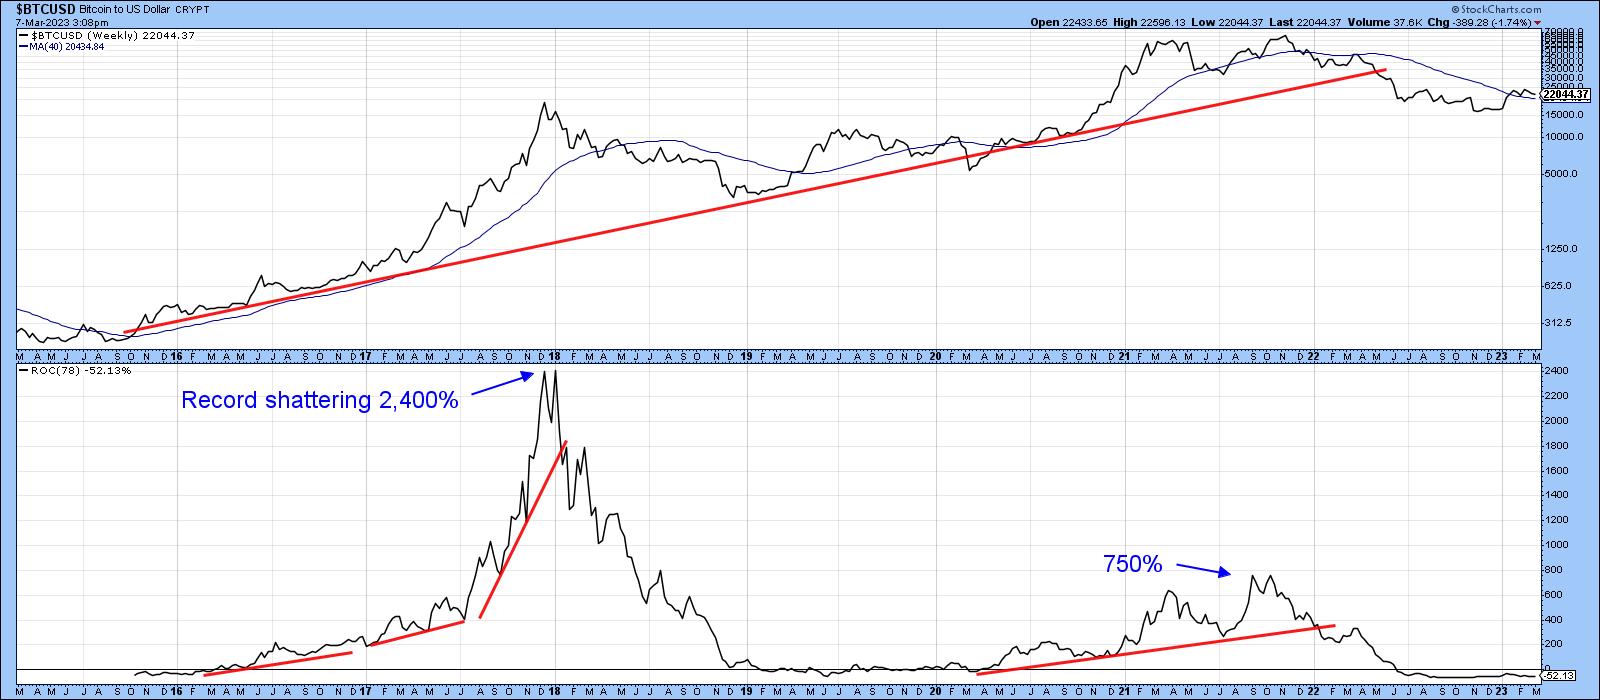
Is Bitcoin Ready for Prime Time Again?

by Martin Pring,
President, Pring Research
Last May, I wrote an article entitled "Bitcoin Bubble Finally Bursts", where I laid out the technical case for substantially lower prices. It was partially based on the fact that the 18-month ROC had peaked from a level in excess of 200%. My research, featuring 26 case studies...
READ MORE
MEMBERS ONLY
Danielle Shay: Applying Her Love of Education to Trade Options
by Jayanthi Gopalakrishnan,
Director of Site Content, StockCharts.com
In honor of Women's History Month and International Women's Day, we continue our series of articles highlighting women traders who have overcome personal and professional challenges to achieve their personal and financial goals.
In this installment, we hear from Danielle Shay, a self-made trader, market analyst,...
READ MORE
MEMBERS ONLY

Sector Spotlight: Strong Rotation to High Beta Sectors
by Julius de Kempenaer,
Senior Technical Analyst, StockCharts.com
In this episode of StockCharts TV's Sector Spotlight, for this first Tuesday of the month, I take a look at the completed monthly charts for February for both Asset Classes and Stock sectors. While evaluating last month's performance for the individual sectors, I include the February...
READ MORE
MEMBERS ONLY

Gold Rushed by a Wave of Economic Data
by Karl Montevirgen,
The StockCharts Insider
This week's a big one for gold. A steep wave of fear, greed, and data is about to hit the gold market. It begins with two Congressional testimonies by Fed Chair Jay Powell on Tuesday and Wednesday, the ADP Employment report and JOLTS report on Wednesday, the weekly...
READ MORE
MEMBERS ONLY

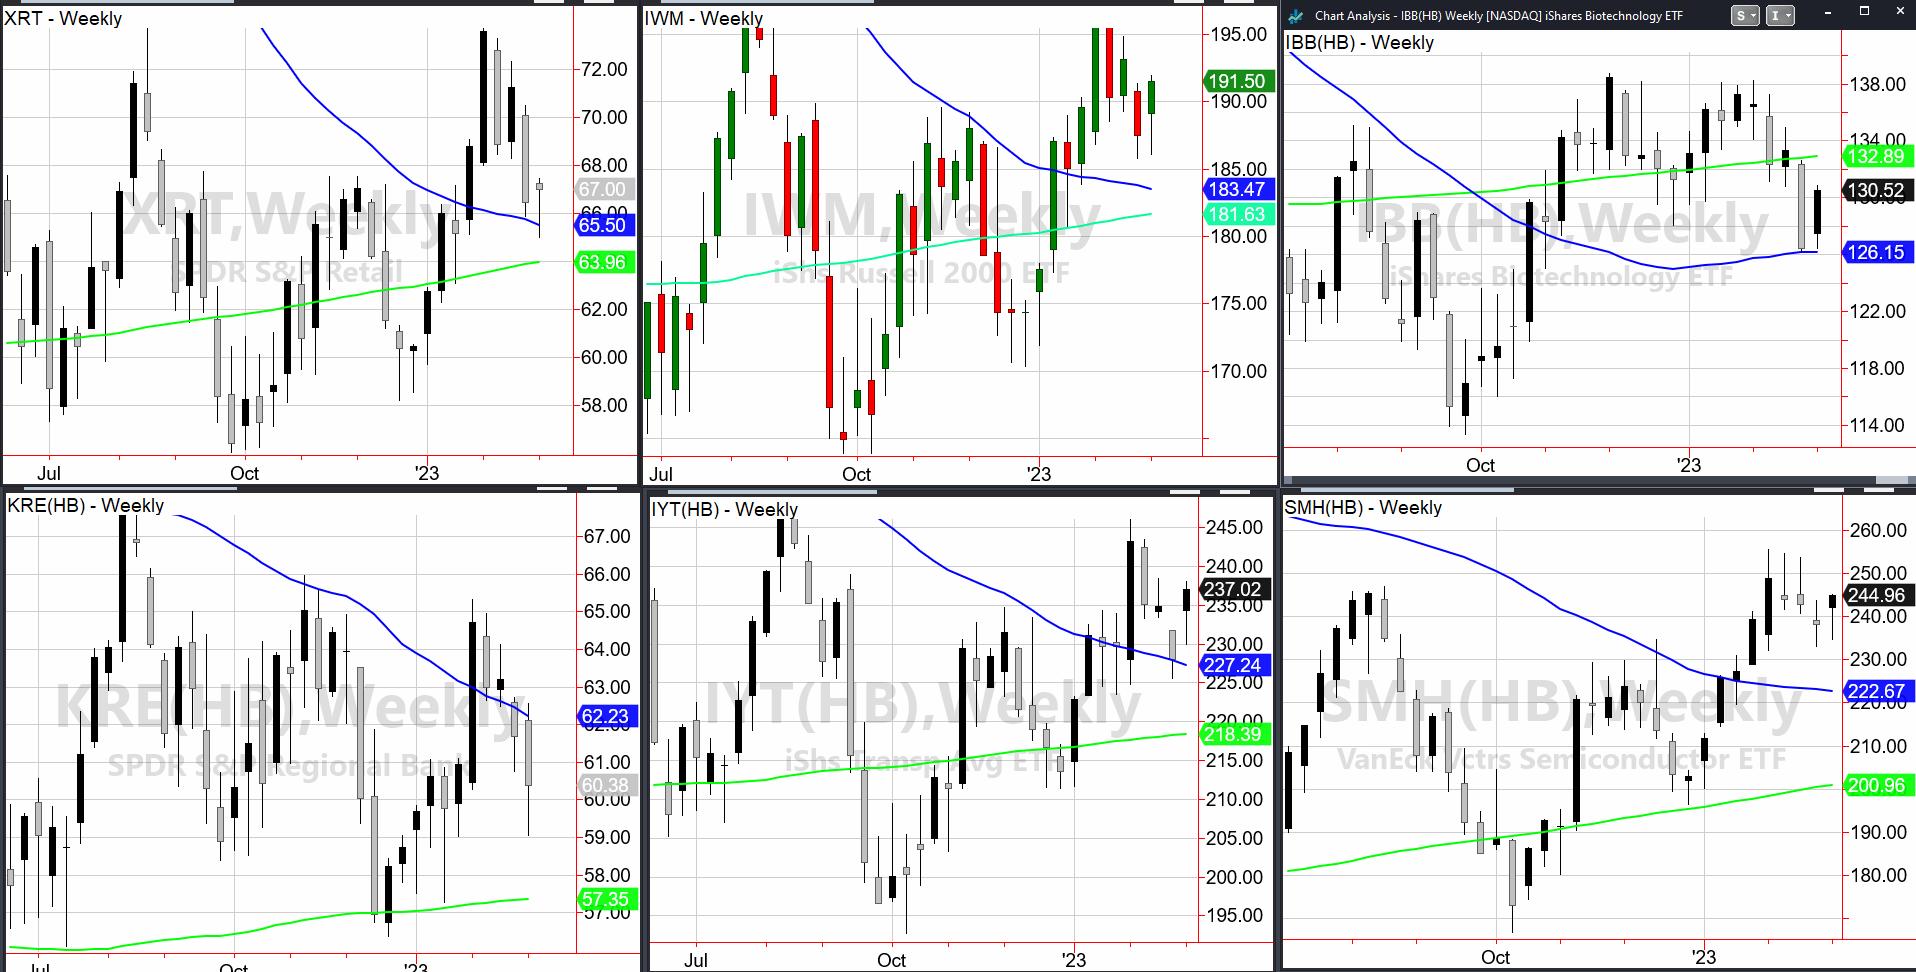
Retail and Regional Banks Will Call the Shots
The 23-month moving average or a two-year business cycle is particularly important this year after a big up then down year-looms large.
Looking at Granny Retail, that business cycle not only leaves investors with the trading range resistance, it also shows how the Retail sector could be a harbinger of...
READ MORE
MEMBERS ONLY
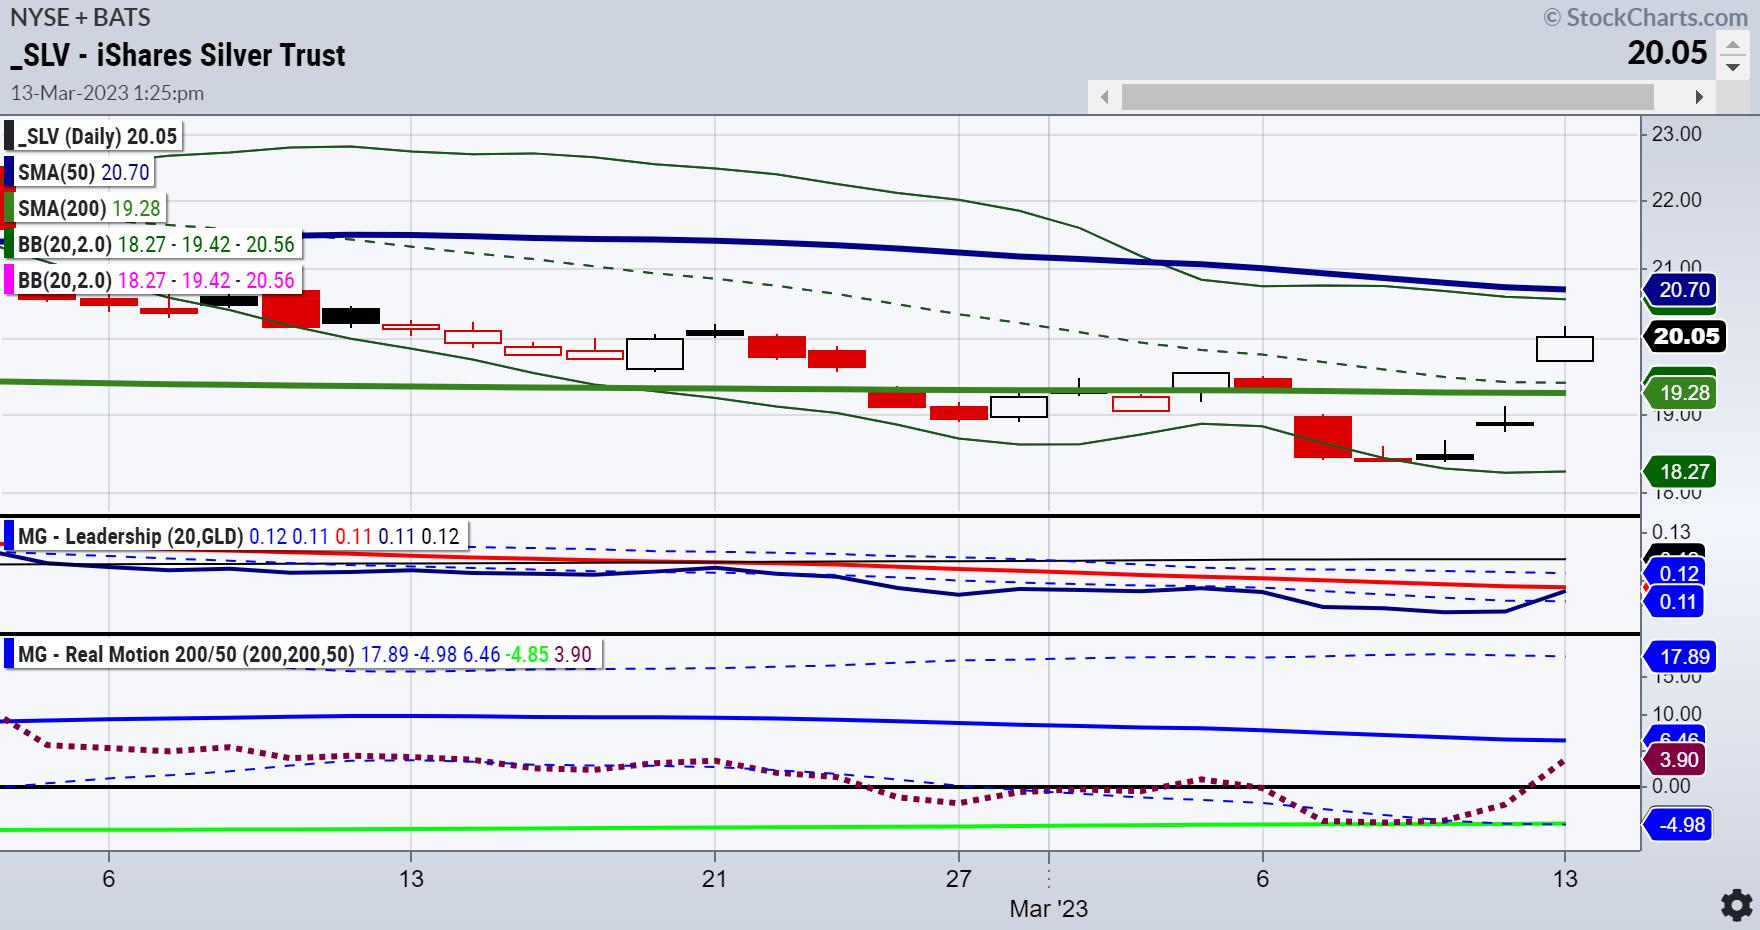
DP Trading Room: Reading the Silver Cross Index
by Erin Swenlin,
Vice President, DecisionPoint.com
by Carl Swenlin,
President and Founder, DecisionPoint.com
On this week's edition of The DecisionPoint Trading Room, Carl opens the show with a detailed discussion of how we measure participation using %Stocks > 20/50/200-day EMAs and the Silver Cross Index/Golden Cross Index. We can see where the strength lies and whether it is...
READ MORE
MEMBERS ONLY

The Halftime Show: Sectors Bullish Percent Index

by Pete Carmasino,
Chief Market Strategist, Chaikin Analytics
In this week's edition of StockCharts TV'sHalftime, Pete gives his rundown of the current market, before moving on to a discussion about combining trendlines and looking at the bullish percent on the big three indexes. He then takes a look at the bullish percent on some...
READ MORE
MEMBERS ONLY

Carley Garner: How I Survived in the Commodities World
by Jayanthi Gopalakrishnan,
Director of Site Content, StockCharts.com
Several recent surveys have shown that women tend to avoid investing in the stock market. That may be changing as women start realizing the importance of financial wellness. In honor of Women's History Month and International Women's Day, StockCharts is running a series of articles highlighting...
READ MORE
MEMBERS ONLY
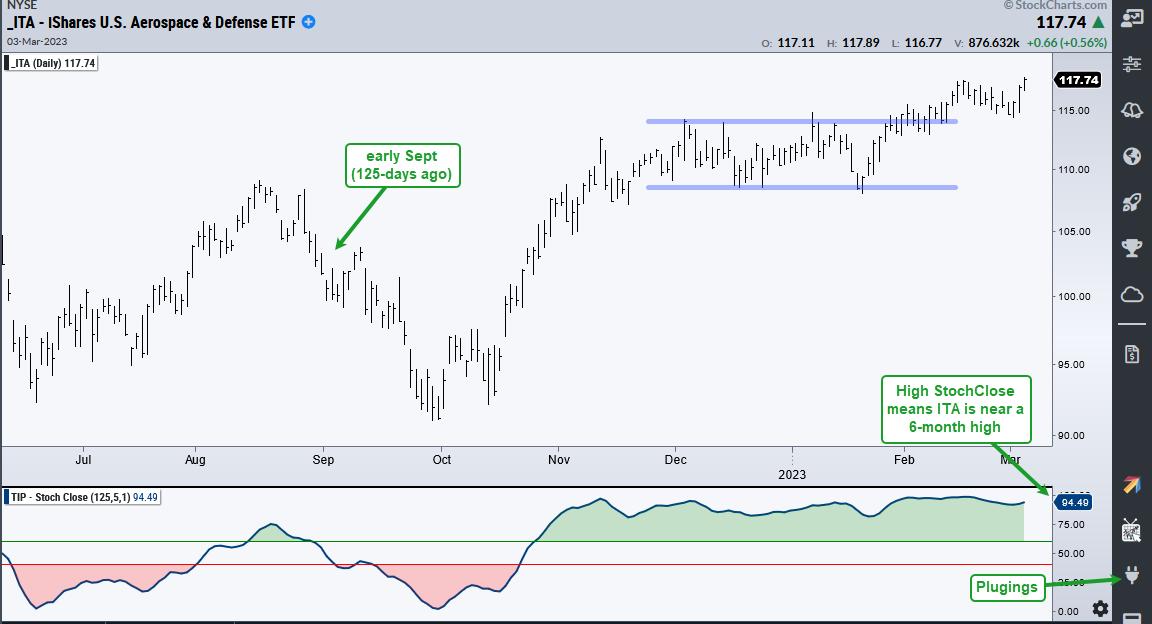
Find the Strongest Price Charts With the StochClose Rank
by Arthur Hill,
Chief Technical Strategist, TrendInvestorPro.com
Stocks and exchange-traded funds (ETFs) trading at or near new highs lead with clear uptrends. These are the names you'd want on your ChartLists or portfolio. You can find leaders by checking the list of 52-week highs or by using the StochClose indicator, which is part of the...
READ MORE
MEMBERS ONLY
Is the Economic Modern Family Ready to Howl?
This past week, our Daily content proved itself invaluable. We directed our readers to look at buying Natural Gas, Crude Oil, Steel, Aluminum, Corn, Sugar, and NASDAQ. Now, we would like to turn our attention to the Economic Modern Family.
On Tuesday, March 7, there will be perfect alignment of...
READ MORE
MEMBERS ONLY

Week Ahead: NIFTY Holds 50-Week MA; Low VIX Calls for Vigilant Approach at Higher Levels
by Milan Vaishnav,
Founder and Technical Analyst, EquityResearch.asia and ChartWizard.ae
It was largely a troubled week for the Indian equities, as the markets spent four out of five days struggling to keep their head above the crucial 200-DMA, which currently stands at 17404. Had it not been for Friday, which saw a sharp surge in the Indices, the week was...
READ MORE
MEMBERS ONLY
Many Stocks in This Industry Popped After Strong Earnings Results: This Similar Company Due to Report Next Week!
by Mary Ellen McGonagle,
President, MEM Investment Research
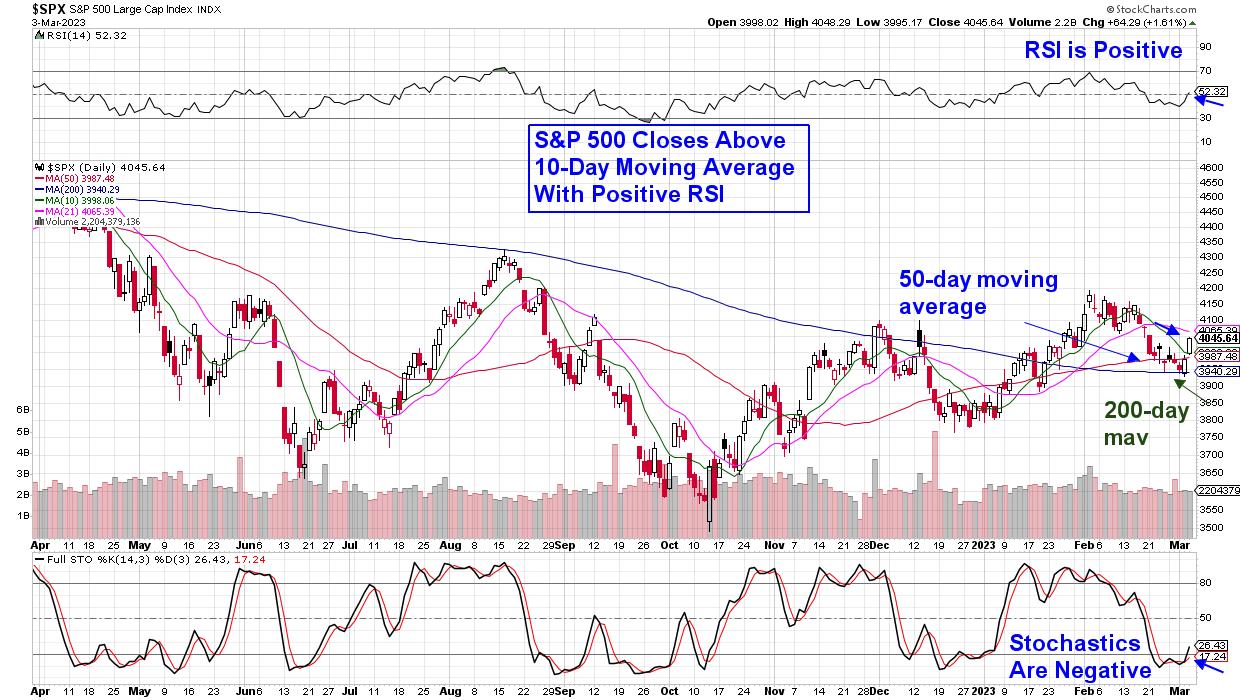
The markets closed the week on a strong note, with a rally that pushed the S&P 500 back above its 21-day moving average. With the relative strength index (RSI) now back in positive territory as well, the S&P 500 is back in an uptrend. The Nasdaq...
READ MORE
MEMBERS ONLY
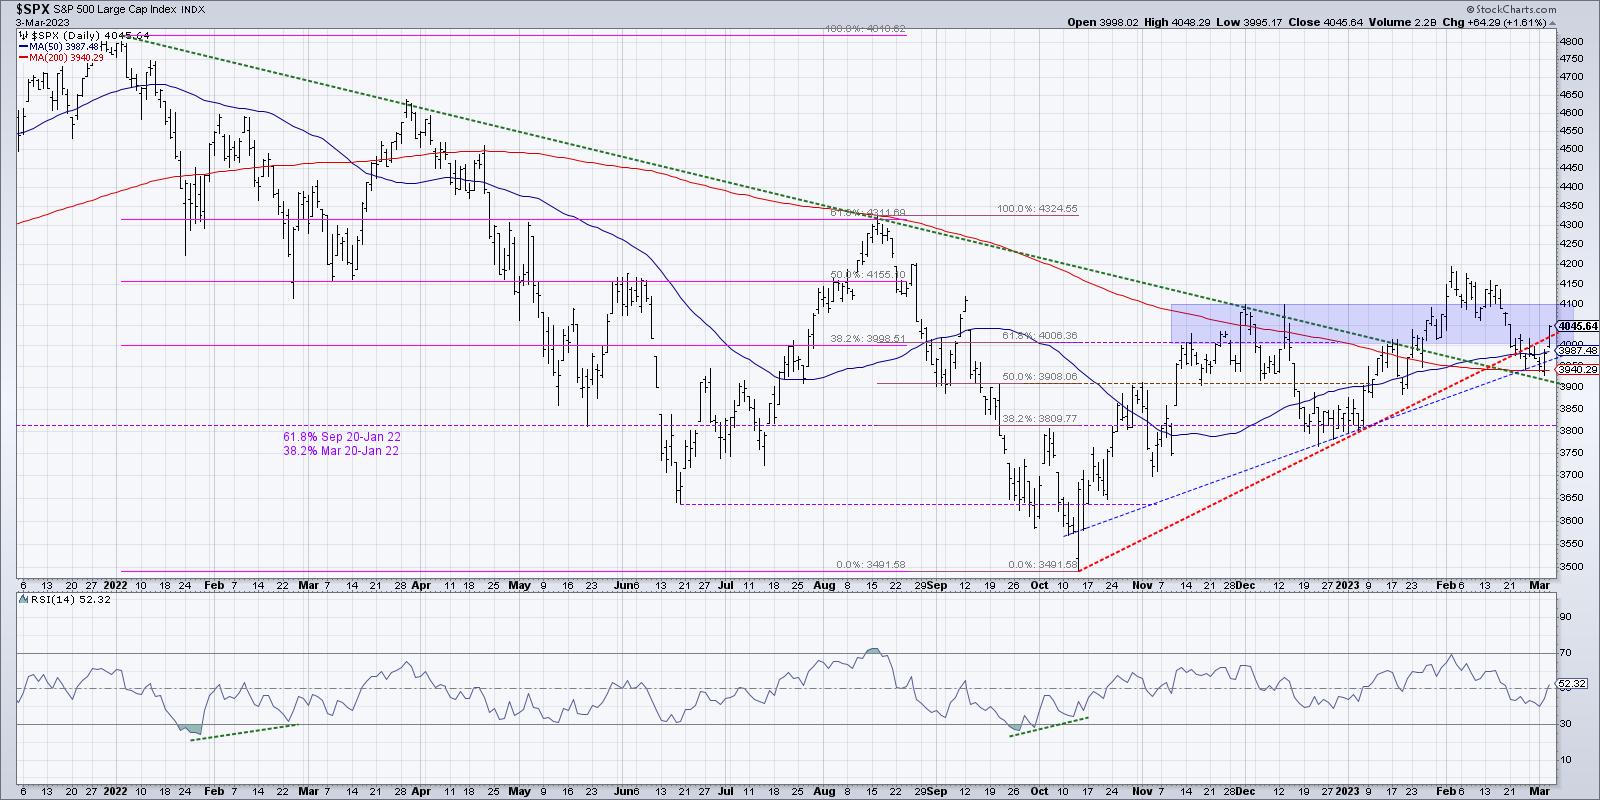
The Road to SPX 5000
by David Keller,
President and Chief Strategist, Sierra Alpha Research
My conversations with Chris Verrone, Adrian Zduńczyk, and Mary Ellen McGonagle this week on The Final Barleft me striving to simplify my analysis of the S&P 500.
It's been a confusing time for stocks and as a result, my main daily chart of the S&...
READ MORE
MEMBERS ONLY
Market in New Uptrend After Late-Week Rally
by Mary Ellen McGonagle,
President, MEM Investment Research
In this episode of StockCharts TV'sThe MEM Edge, Mary Ellen reviews the downtrend reversal in the markets and what areas came on the strongest last week. She also highlights best practices for putting new money to work.
This video was originally broadcast on March 3, 2023. Click on...
READ MORE
MEMBERS ONLY
Pullback Finding Support
by TG Watkins,
Director of Stocks, Simpler Trading
In this week's edition of Moxie Indicator Minutes, TG discusses how we are starting to see the market find support from its mid-February pullback. TG expects a small bounce, but it is not a confirmation of a long yet. The Hourly will still need to setup for that...
READ MORE
MEMBERS ONLY

This Semiconductor ETF is Hitting a Critical Juncture
by Karl Montevirgen,
The StockCharts Insider
In the next few days, SMH (VanEck Semiconductor ETF), along with other similar "chip index" funds, may see a strong bounce toward the upside.
What's going on? Technically speaking, the semiconductor index just broke out of a head and shoulders bottomon January 23, and now the...
READ MORE
MEMBERS ONLY

STOCK INDEXES HOLD 200-DAY LINES -- VIX INDEX RETREATS -- TWO-YEAR YIELD HITS 16 YEAR HIGH
by John Murphy,
Chief Technical Analyst, StockCharts.com
STOCK INDEXES HOLD 200-DAY LINES...After a weak month of February, major stock indexes are finally attracting some new buying. More importantly, this week's rebound is happening at some important moving average lines. Chart 1 shows the Dow Industrials bouncing off potential chart support along its late December...
READ MORE
MEMBERS ONLY
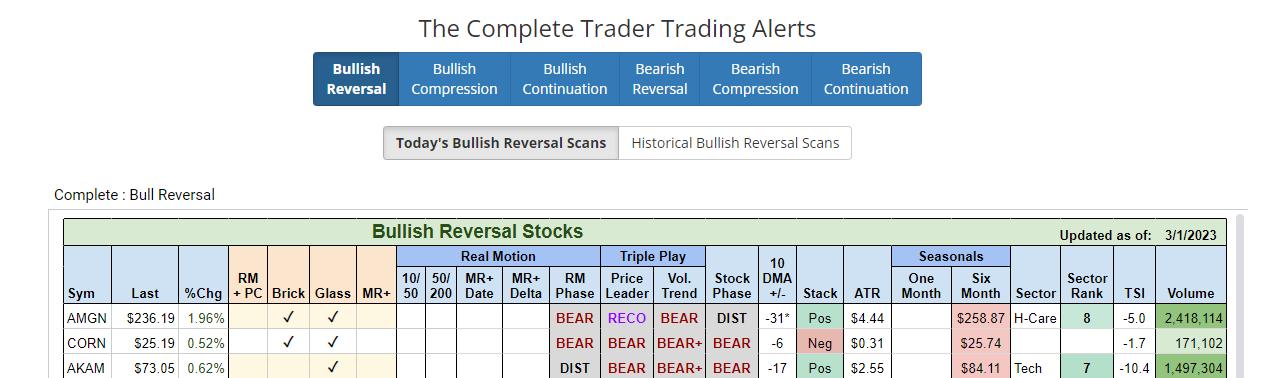
Bullish Reversals
Those of you who read our Daily are by now, learning about the value of our scanning tools, quants and the Complete Trader.What we are trying to accomplish is to show not only how best to use the product, but how to focus on key patterns, especially those that...
READ MORE
MEMBERS ONLY
GNG TV: Equities Turn "NoGo" as Weight of Macro Factors Takes Toll
by Alex Cole,
Co-founder, GoNoGo Charts®
In this week's edition of the GoNoGo Charts show, Alex takes a look at the major assets, noting that Equities have surrendered to a NoGo trend this week. Treasury rates rising, along with the dollar, could be acting as a headwind for stocks. Within the S&P...
READ MORE
