MEMBERS ONLY
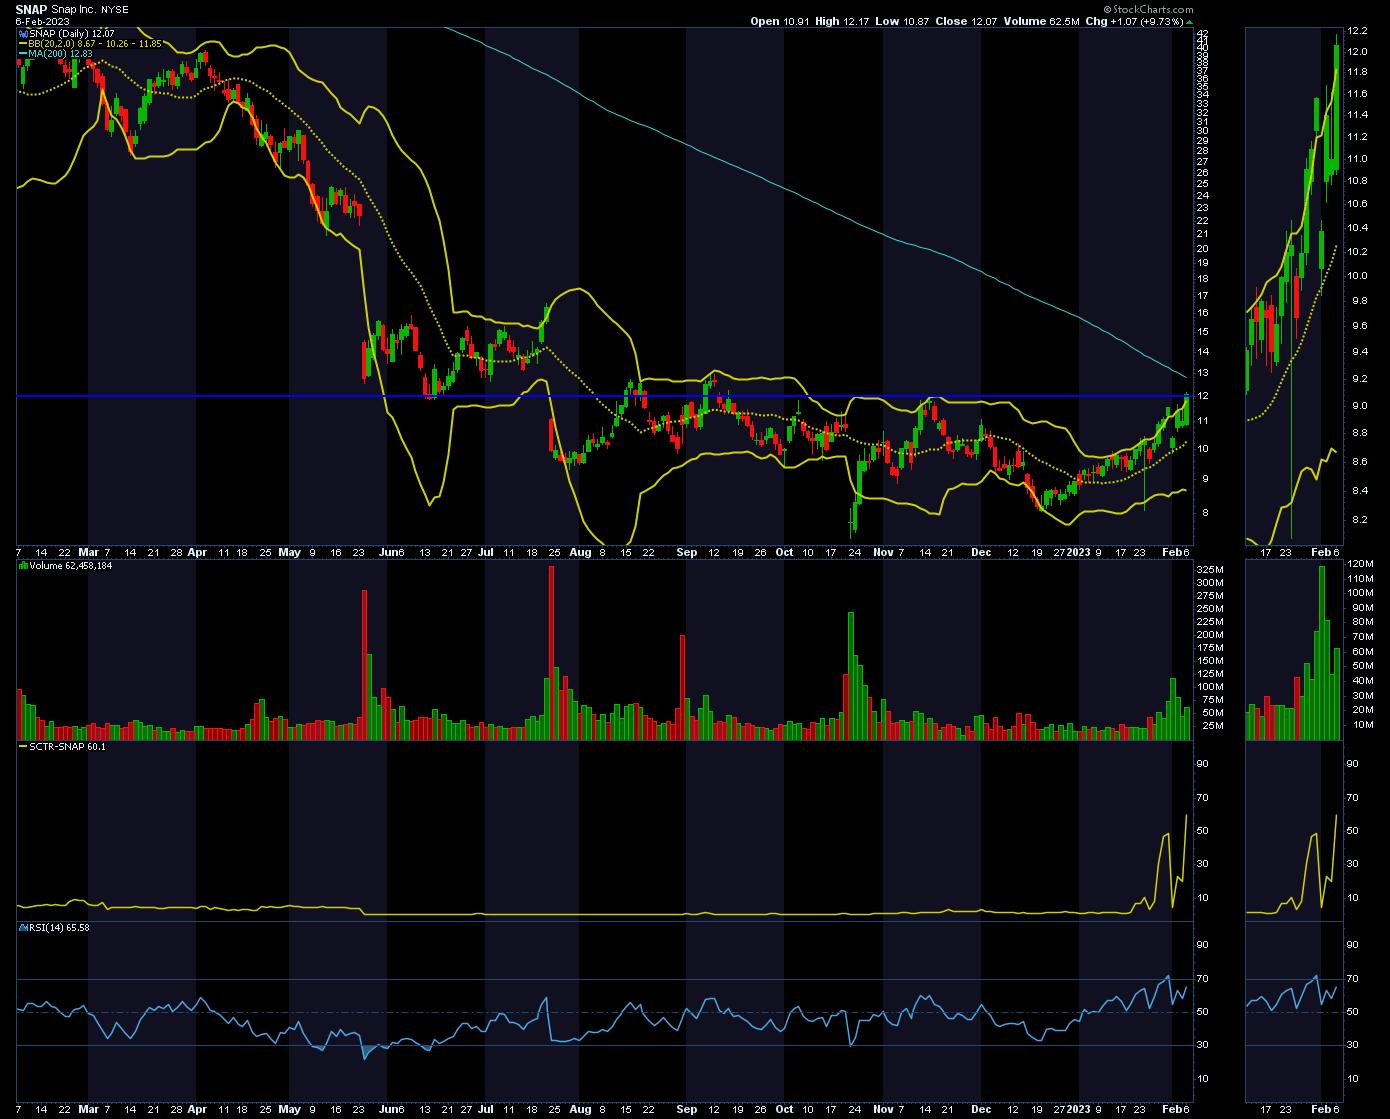
SNAP Stock: A Buy or Sell?

by Jayanthi Gopalakrishnan,
Director of Site Content, StockCharts.com
SNAP's got a new game plan up its sleeve and, depending on how well it fits, it may make or break the stock.
After flat or disappointing earnings reports for most of 2022, mainly due to weak social media ad revenues, SNAP stock has suffered. The stock'...
READ MORE
MEMBERS ONLY

Price Reversals from Recent Highs in Stocks
What if the trading range top at 4200 we have been calling for in the S&P 500 turns out to be... the top?
Certainly, we can make a case for it given higher yields, strong dollar, geopolitical stress, debt issues, government spending, and no real proof we have...
READ MORE
MEMBERS ONLY

DP Trading Room: Trusting the Technicals

by Erin Swenlin,
Vice President, DecisionPoint.com

by Carl Swenlin,
President and Founder, DecisionPoint.com
On this week's edition of The DecisionPoint Trading Room, Carl looks at the Big 10 capitalized stocks and determines whether a bull market right now will have legs. Do we use common sense or technicals regarding a new bull market? Carl and Erin discuss. Both of them deep...
READ MORE
MEMBERS ONLY

History Tells Us We're Going A LOT Higher

by Tom Bowley,
Chief Market Strategist, EarningsBeats.com
I'm a follower and believer of history when it comes to the stock market. After years of research, I understand that some aspects of U.S. equity performance are rather transparent and resulting technical signals generally can be relied upon. There were plenty of warning signals to open...
READ MORE
MEMBERS ONLY
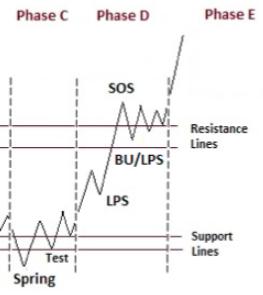
Is the S&P 500 In Late Stage Accumulation?

by Bruce Fraser,
Industry-leading "Wyckoffian"
Are the major stock indexes under Accumulation? If so, we Wyckoffians would expect an important Markup (uptrend) to follow. Accumulation is the process of large interests (known as Composite Operators) stealthily Absorbing shares of stocks they expect to appreciate during the subsequent Markup Phase. Accumulation can take an indeterminant period...
READ MORE
MEMBERS ONLY

Week Ahead: Markets Approaches Union Budget in Bruised State; Expect Volatility to Remain High

by Milan Vaishnav,
Founder and Technical Analyst, EquityResearch.asia and ChartWizard.ae
As the week came to an end, the equity markets left behind a very eventful week. Two important events were expected to infuse volatility into the markets. The first was the Union Budget, one of the most major external domestic events that the markets react to. The other was the...
READ MORE
MEMBERS ONLY
Growth Stocks Roar Into the New Year: This FAANMG Stock Is Poised to Go Higher

by Mary Ellen McGonagle,
President, MEM Investment Research
The Nasdaq just booked its fifth consecutive weekly gain, which is the longest winning streak in over a year. The rally occurred amid strong earnings reports from some major tech companies. Also driving the Nasdaq higher is bottom-fishing among investors looking for quality software and retail stocks that were crushed...
READ MORE
MEMBERS ONLY

New Dow Theory Declares Bullish Phase

by David Keller,
President and Chief Strategist, Sierra Alpha Research
While the technical analysis toolkit has certainly evolved over time, having benefitted from advances in computing and data analysis, in many ways, the tools of the modern technical analyst are not far from the original work of Charles Dow in the early 20th century. But an updated version of his...
READ MORE
MEMBERS ONLY
Stock Market Stuck with a Plethora of Mixed Signals
If you are having a hard time figuring out the market's next moves, start by thinking about trading range. The 2023 Outlook spells out reasons for a 1000-point trading range potential in the SPY from 3200-4200. We are adding that the NASDAQ 100, through QQQ, can head to...
READ MORE
MEMBERS ONLY

MEM TV: Major Market Shift After Fed Comments
by Mary Ellen McGonagle,
President, MEM Investment Research
In this episode of StockCharts TV'sThe MEM Edge, the markets closed above key resistance in the S&P 500, which Mary Ellen reviews along with its impact. She also highlights rotation taking shape and what's driving the moves.
This video was originally broadcast on February...
READ MORE
MEMBERS ONLY

New Industry Group Golden Cross Indexes and Silver Cross Indexes
by Erin Swenlin,
Vice President, DecisionPoint.com
We have begun collecting Silver Cross Index and Golden Cross Index data for four new industry groups, and StockCharts.com back-calculated data for two years: Biotechnology (IBB), Regional Banking (KRE), Retail (XRT), and Semiconductors (SMH).
First let's cover what the Golden/Silver Cross Indexes are:
* The Golden Cross...
READ MORE
MEMBERS ONLY

How to Find the Market's Strongest Stocks in Just Four Clicks!

by Grayson Roze,
Chief Strategist, StockCharts.com
On this week's edition of StockCharts TV'sStockCharts in Focus, Grayson shows how to combine the Sector Summary tool with SCTRs (StockCharts Technical Rank) to find the market's strongest stocks in just four clicks. By drilling into the strongest sectors and then the strongest industry...
READ MORE
MEMBERS ONLY

SMALL CAP LEADERSHIP IS AN ENCOURAGING SIGN -- STOCK INDEXES CLEAR DECEMBER HIGH -- KEEPING AN EYE ON BOND YIELDS

by John Murphy,
Chief Technical Analyst, StockCharts.com
SMALL CAP LEADERSHIP... The last couple of messages have shown improvement in market breadth. That improvement was reflected in rising advance-declines lines and percent of stocks over moving average lines. Here's another example of improving breadth in the form of small cap leadership. The daily bars in Chart...
READ MORE
MEMBERS ONLY

The Market Liked FOMC

by TG Watkins,
Director of Stocks, Simpler Trading
Whether its a short squeeze or more buying, the market went up a few minutes after Jerome Powell started speaking today. Yes, there might be really negative economic data coming sometime in the future. But we don't know how much of that the market has already priced in,...
READ MORE
MEMBERS ONLY

Earnings Analysis: GOOGL, AMZN, AAPL

by Karl Montevirgen,
The StockCharts Insider
by Jayanthi Gopalakrishnan,
Director of Site Content, StockCharts.com
Three big bellwether stocks announced earnings on the same day, after the close, and they all missed estimates. Does this mean the Technology sector or the broader market will head lower?
Not necessarily. From a technical perspective, ahead of earnings, the charts of Alphabet (GOOGL), Amazon (AMZN), and Apple (AAPL)...
READ MORE
MEMBERS ONLY
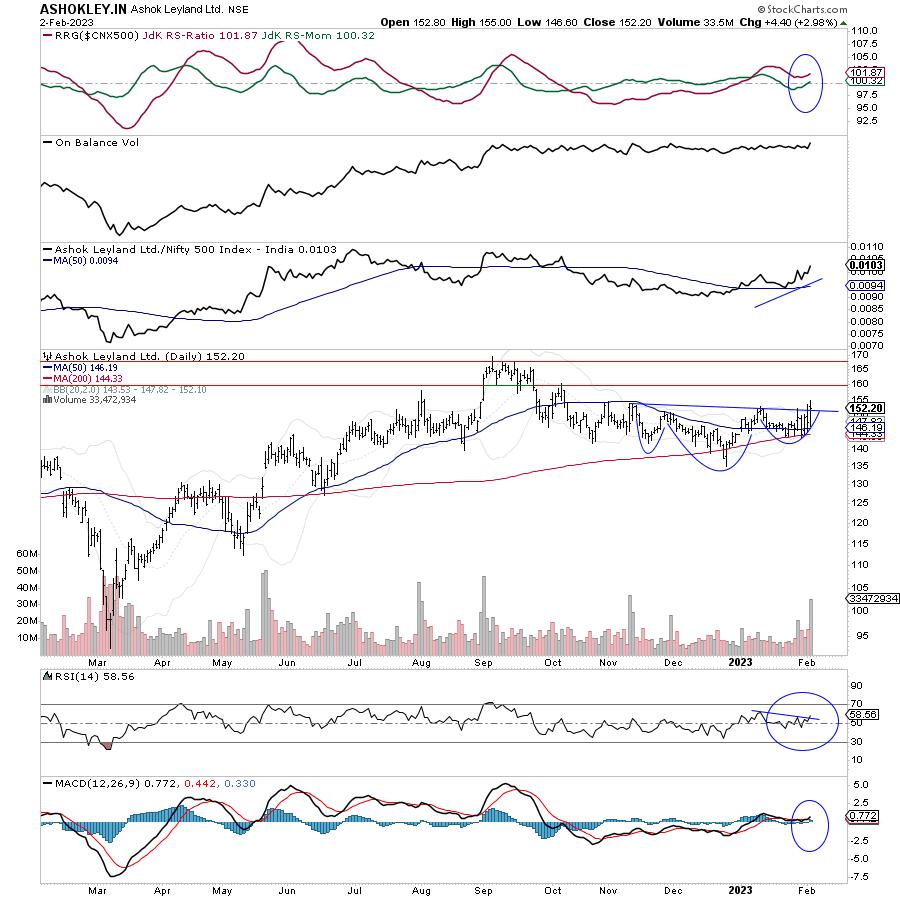
Buoyant Technical Setup in this CV Stock
by Milan Vaishnav,
Founder and Technical Analyst, EquityResearch.asia and ChartWizard.ae
Today is Friday; however, when the market drew to a close on Thursday, it left both major events behind itself while it also navigated the weekly options expiry. The market is having an immensely volatile week; with the last trading day of the week yet to unfold, the weekly bar...
READ MORE
MEMBERS ONLY

GNG TV: Big Moves as Bulls See Risk-On Environment

by Alex Cole,
Co-founder, GoNoGo Charts®

by Tyler Wood,
Co-founder, GoNoGo Charts®
In this week's edition of the GoNoGo Charts show, Alex and Tyler take a macro top-down approach to understanding what technical analysis is telling us about market moves. Starting with an Asset Map and moving through treasury rates, gold, the dollar, and the S&P 500, they...
READ MORE
MEMBERS ONLY

These Five Long-Term Indicators Are Signaling a Bull Market

by Martin Pring,
President, Pring Research
I have been negative on the market for some time. I believe that it's a wiser policy to wait for the long-term indicators to turn bullish, rather than trying to capture every twist and turn of those bear market rallies, pregnant as they are, with false breakouts and...
READ MORE
MEMBERS ONLY

Joe's Best-Looking Sectors

by Joe Rabil,
President, Rabil Stock Research
On this week's edition of Stock Talk with Joe Rabil, Joe shows off a different pattern that was not included in his book. Using MACD and Price/MA together, we can identify a potential turning point. This pattern is a different form of momentum divergence and just took...
READ MORE
MEMBERS ONLY
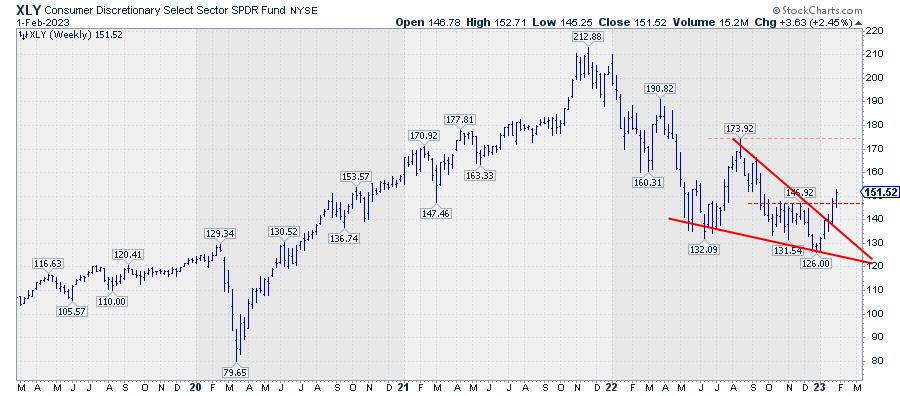
You Gotta Love a Good Wedgie

by Julius de Kempenaer,
Senior Technical Analyst, StockCharts.com
In the second half of 2022, the price chart for XLY started to form a falling wedge pattern.
This pattern or formation is characterized by two converging trendlines, BOTH moving lower. The falling wedge variant comes in two variations. It can be either a continuation within an established uptrend or...
READ MORE
MEMBERS ONLY
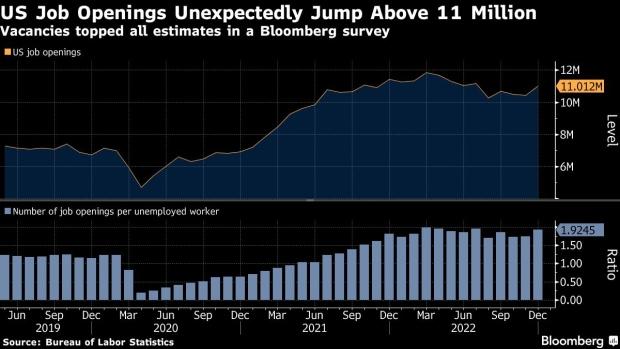
The Labor Market and the Stock Market
By the time you read this, the buzz of what the Fed did and Powell's presser will be over... at least for the day.
We will not repeat the obvious.
What we are way more focused on is the underlying reasons that the Fed, unless they are willing...
READ MORE
MEMBERS ONLY

The Fed's Interest Rate Decision: How To Play Your Trades
by Jayanthi Gopalakrishnan,
Director of Site Content, StockCharts.com
Gain insight into the Fed's interest rate decision and explore how you can strategize your trades in the future.
CHARTWATCHERS KEY POINTS
* The Fed raises interest rates by 25 basis points (0.25 percentage points).
* Stock markets closed higher after hearing Chairman Powell's comments.
* Monitoring sector...
READ MORE
MEMBERS ONLY

How Markets Really Work

by Dave Landry,
Founder, Sentive Trading, LLC
In this week's edition of Trading Simplified, Dave jumps right into his "Mind The Trade" segment with a discussion on how markets really work. He then explains how embracing your own emotional nature can help you to wrap your head around the emotional nature of the...
READ MORE
MEMBERS ONLY

January's Performance: A Good Start for 2023?
by Jayanthi Gopalakrishnan,
Director of Site Content, StockCharts.com
"As the S&P 500 goes in January, so goes the year." If you're a Stock Trader's Almanac reader, you'll be familiar with this adage. According to the Almanac, since 1950, this seasonal indicator has registered 12 major errors. That'...
READ MORE
MEMBERS ONLY

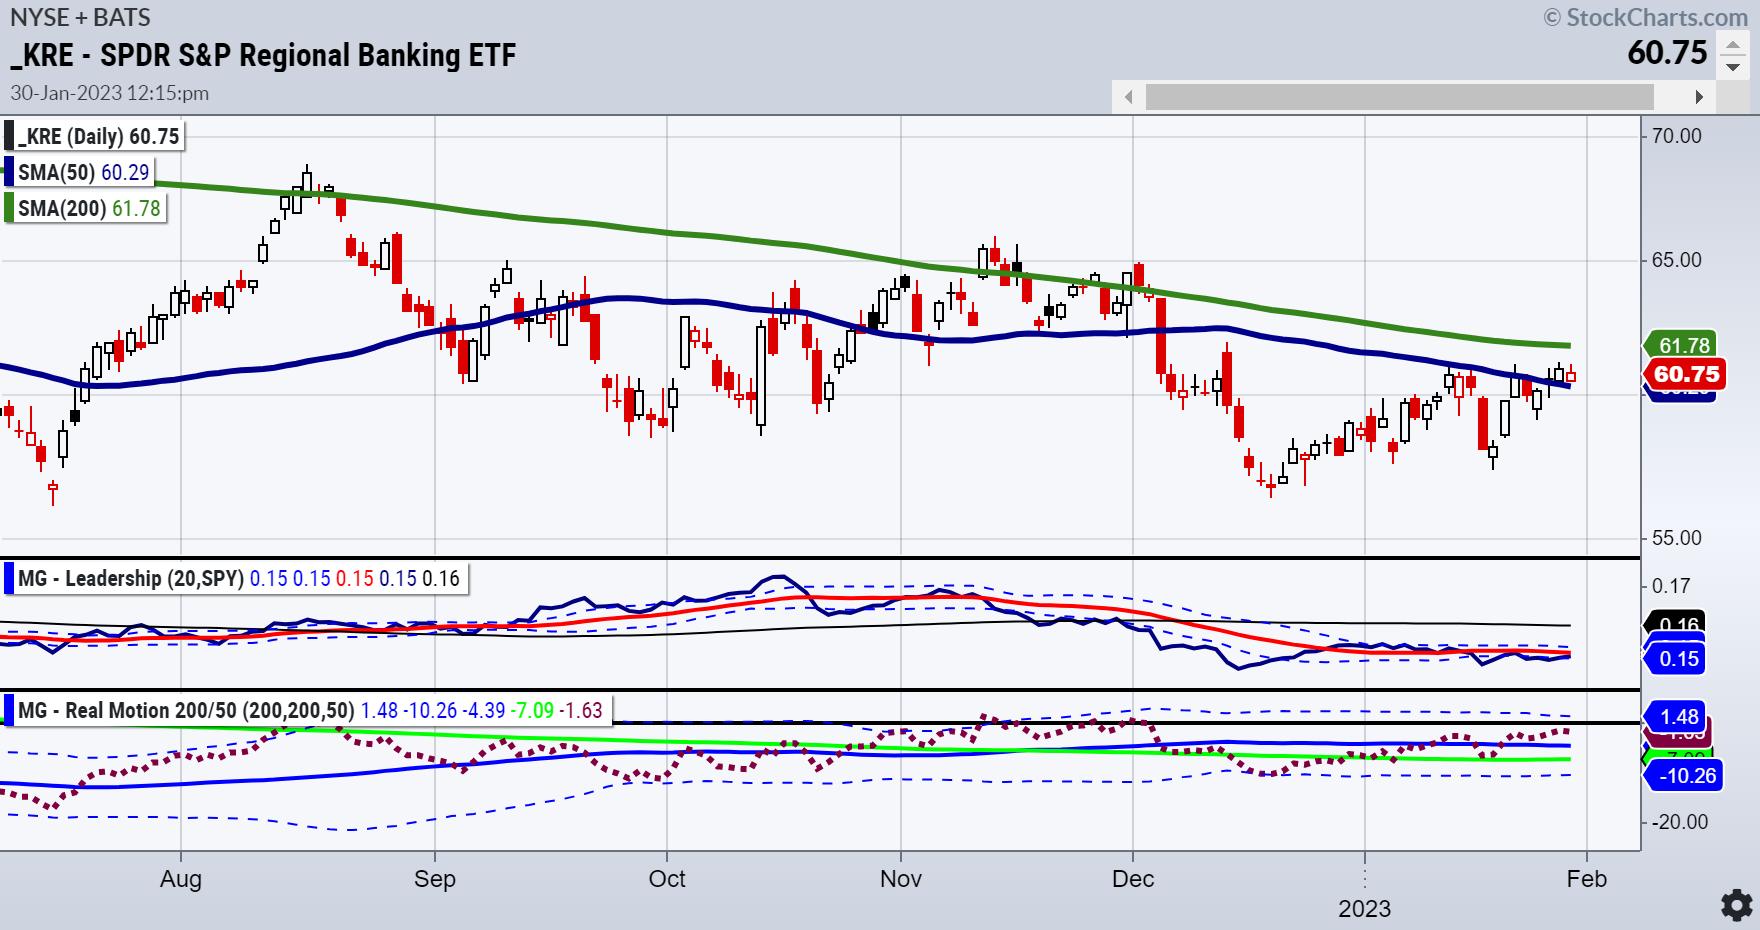
What Are the Equity Market's Positive Signs?
On Monday, the Daily covered some of the warning signs, particularly in the Regional Banks and Transportation sectors. We ended the Daily by writing this: "Transportation and Regional Banks make up nearly 1/3 of the Economic Modern Family."
On their weakness: "Of course, the week is...
READ MORE
MEMBERS ONLY

Sector Spotlight: Sector Rotation Out of Defense
by Julius de Kempenaer,
Senior Technical Analyst, StockCharts.com
In this episode of StockCharts TV's Sector Spotlight, I address the current state of asset class rotation, then move on to sector rotation. I divide the market in three groups -- Offensive, Defensive and Sensitive -- and find an interesting alignment that should be taken seriously as an...
READ MORE
MEMBERS ONLY
What Are the Equity Market's Warning Signs?
Nearly every member of Mish's Modern Familyimproved last week, with the Russell 2000 (IWM), Transportation (IYT), Semiconductors (SMH), and Retail (XRT) all putting in Golden Crosses on their daily charts.
Except for Regional Banks (KRE).
Risk off or on during this data-heavy week? Clearly, the performance of MarketGauge&...
READ MORE
MEMBERS ONLY
DP Trading Room: New Golden & Silver Cross Indexes
by Erin Swenlin,
Vice President, DecisionPoint.com
by Carl Swenlin,
President and Founder, DecisionPoint.com
On this week's edition of The DecisionPoint Trading Room, Carl opens with an introduction to new data sets for Regional Banks (KRE), Semiconductors (SMH), Biotechs (IBB), and Retail (XRT). The new Golden Cross and Silver Cross Indexes and additional breadth data tell a different story than relative strength...
READ MORE
MEMBERS ONLY

The Halftime Show: Sharing "Secret" Chaikin Lists

by Pete Carmasino,
Chief Market Strategist, Chaikin Analytics
In this week's edition of StockCharts TV'sHalftime,using a different perspective than last week, Pete reviews some sectors today that include names with bullish changes over the last week. He also shares some "secret" lists from the Chaikin platform. This week's upcoming...
READ MORE
MEMBERS ONLY
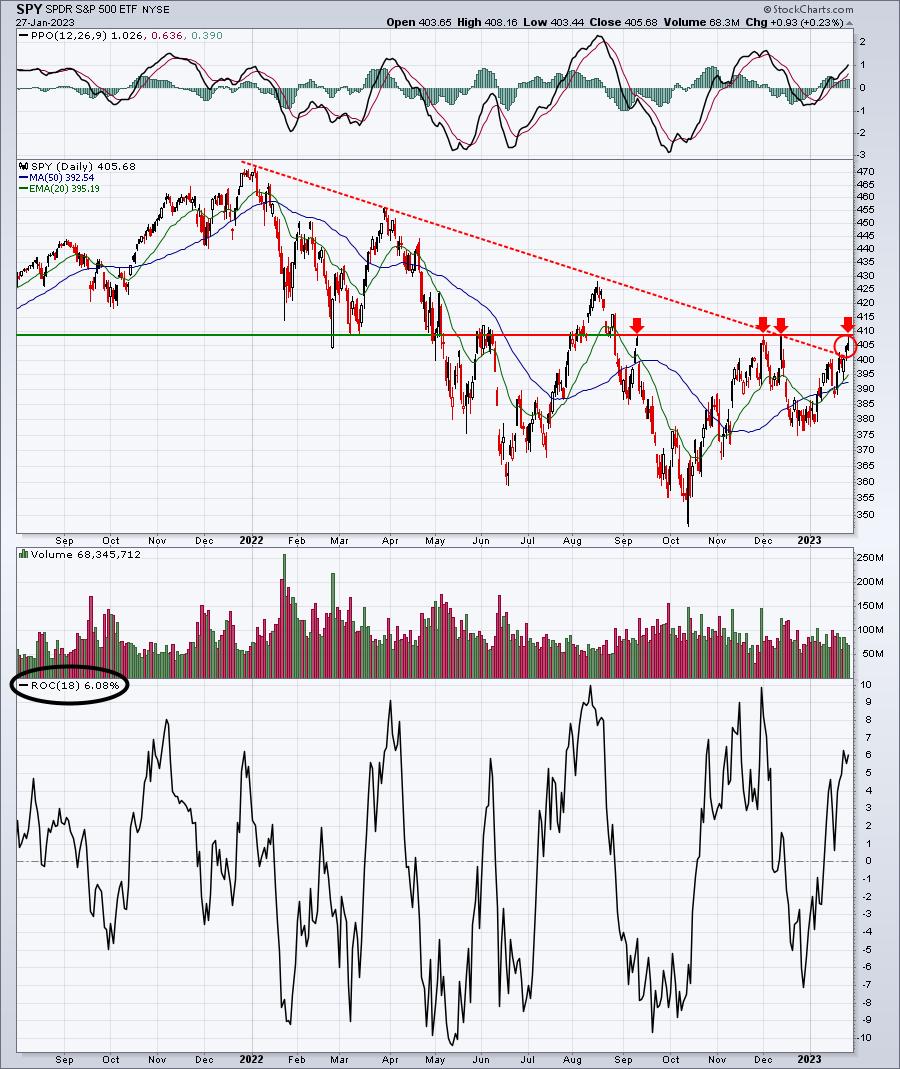
SPY Knocks on the Door of Resistance
by Tom Bowley,
Chief Market Strategist, EarningsBeats.com
2022 was a year that required a ton of patience, waiting out the cyclical bear market that unfolded, especially during the first five to six months of the year. But we saw significant strength in many areas during Q4, and growth stocks have powered the market forward in January 2023....
READ MORE
MEMBERS ONLY

Some Classical Technical Developments Shaping Up As Volatile Markets Gets Selective
by Milan Vaishnav,
Founder and Technical Analyst, EquityResearch.asia and ChartWizard.ae
The ghost of the Hindenburg Report continues to haunt the Indian stock markets; the markets have witnessed a sharp selloff over the past two sessions after the activist short-seller leveled some serious allegations against the Adani Group. While Hindenburg Research specializes in "forensic financial research", they have accused...
READ MORE
MEMBERS ONLY

Ready, Set, COVER! Breakouts Are A Short Seller's Worst Enemy
by Tom Bowley,
Chief Market Strategist, EarningsBeats.com
It was one week ago that I wrote about Wayfair's (W) big breakout in the Don't Ignore This Chart blog. It had just broken above key resistance and volume accelerated to its highest level EVER! And EVER is a very long time! 22 million shares traded...
READ MORE
MEMBERS ONLY
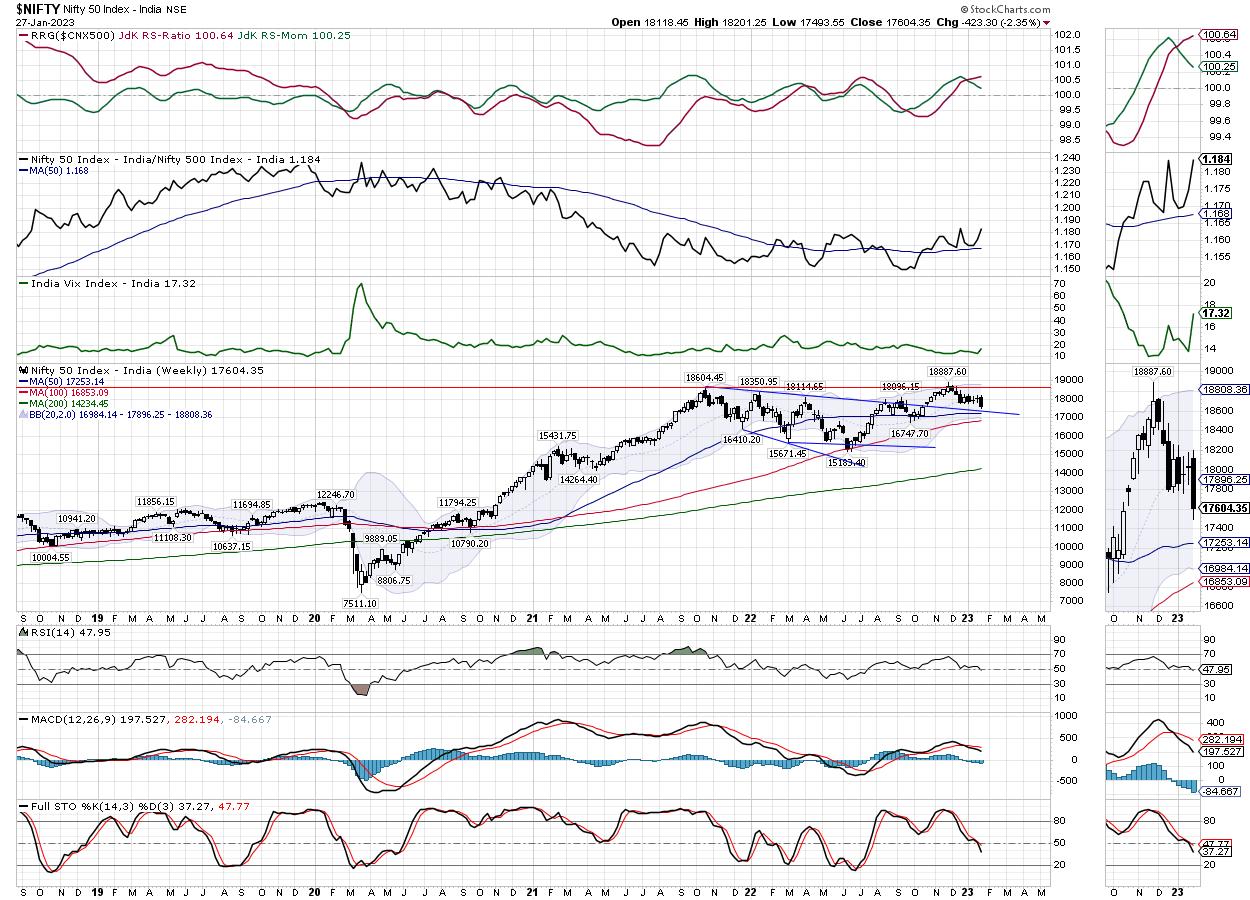
Week Ahead: Market Approaches Union Budget in Bruised State; Expect Volatility to Remain High
by Milan Vaishnav,
Founder and Technical Analyst, EquityResearch.asia and ChartWizard.ae
It was an immensely volatile and eventful week for the markets as they headed towards the last weekly close before the Union Budget. The last three sessions, more particularly the last two sessions, remained marred by the severely bearish reactions to Hindenburg Research's report on the Adani Group...
READ MORE
MEMBERS ONLY
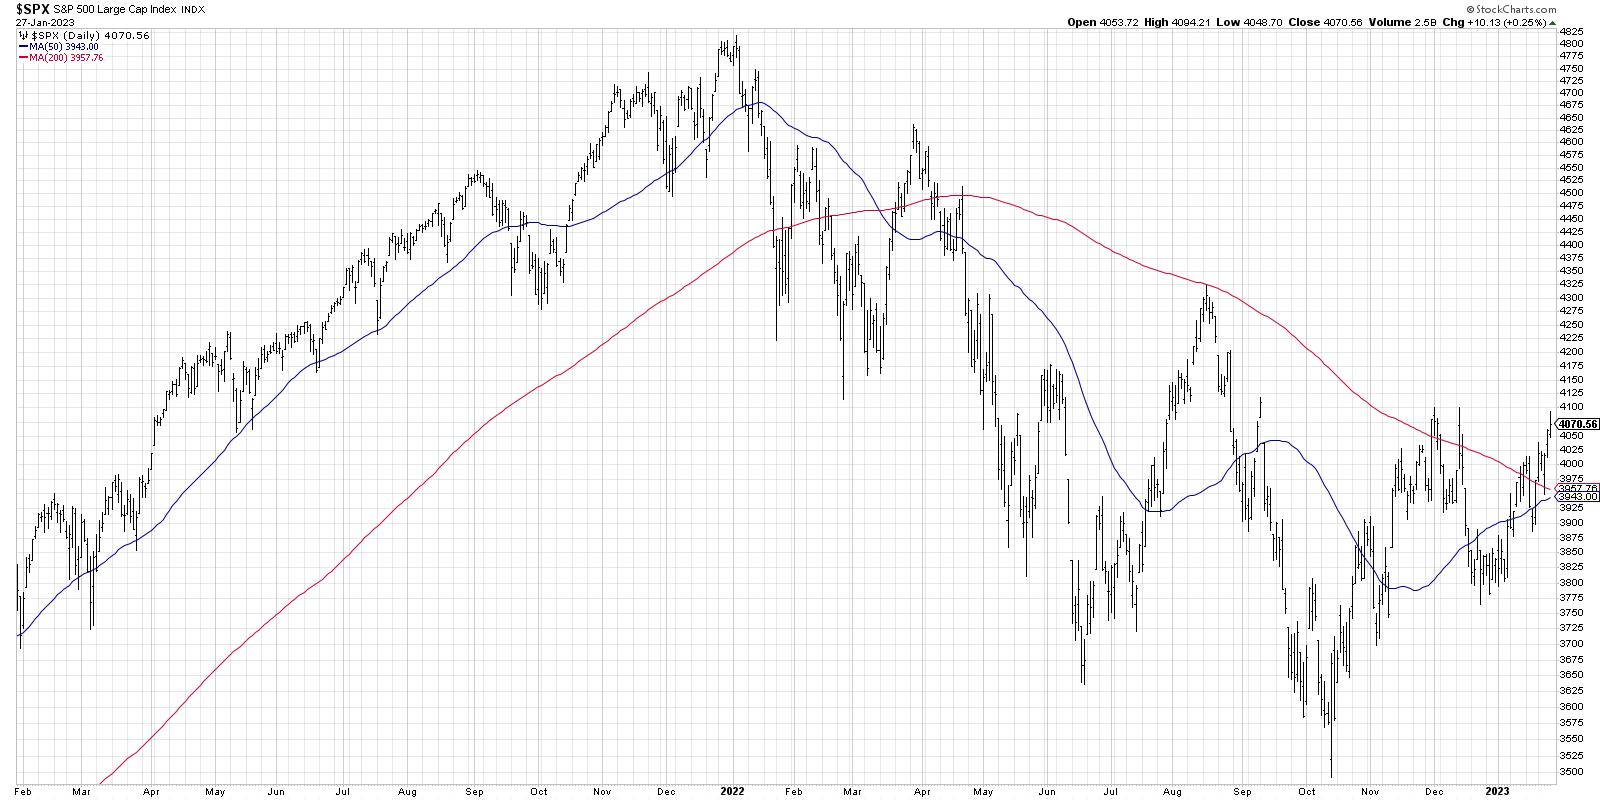
The S&P 500 Leaves the 200-Day Behind
by David Keller,
President and Chief Strategist, Sierra Alpha Research
How much weight should we put on the fact that the S&P 500 index powered above its 200-day moving average (MA) this week? If history is any indication, then this is actually a fairly momentous occasion. Unless it's a repeat of March 2022, in which case...
READ MORE
MEMBERS ONLY

Inflation, What Inflation?
We typically have a song or two in our heads. After all, watching ticks is musical and has a lot of different beats.
And typically, those songs turn into parodies.
For this past week, the first song was sealed in our brains after Tesla's extraordinary run. And then...
READ MORE
MEMBERS ONLY
Many Stocks are Basing/Lifting
by TG Watkins,
Director of Stocks, Simpler Trading
In this week's edition of Moxie Indicator Minutes, TG notes that there is a lot of negativity out there and concern about the effects the economy will have on the market. Yet GDP has come in strong, and many names have been basing, and some other names have...
READ MORE
MEMBERS ONLY
MEM TV: Growth Stocks Push Market Above Resistance
by Mary Ellen McGonagle,
President, MEM Investment Research
In this episode of StockCharts TV'sThe MEM Edge, Mary Ellen reviews the outperformance in Growth stocks and which areas are poised to trade higher. She also highlights the key driver of these and other stocks which are on the move.
This video was originally broadcast on January 27,...
READ MORE
MEMBERS ONLY

Stay Ahead of GDP: 3 Charts to Become a Smarter Trader
by Jayanthi Gopalakrishnan,
Director of Site Content, StockCharts.com
When concerns of a recession are front and center, investors tend to pay more attention to the Gross Domestic Product (GDP) report. The Q4 2022 GDP report showed the U.S. economy grew by 2.9% in the quarter, and Wall Street wasn't disappointed. The day the report...
READ MORE
MEMBERS ONLY

Will This Be THE Break?
by Julius de Kempenaer,
Senior Technical Analyst, StockCharts.com
In this week's episode of Sector Spotlight, I looked at market breadth using two different variations of Relative Rotation Graphs. Following that show, I received an email from a user reminding me of another set of market breadth indices that we keep for sectors: the BullishPercent indices.
You...
READ MORE
MEMBERS ONLY

S&P 500 NEARS TEST OF DECEMBER HIGH AFTER CLEARING 200-DAY LINE -- BREADTH INDICATORS REMAIN SUPPORTIVE -- SECTOR BREADTH IS ALSO POSITIVE
by John Murphy,
Chief Technical Analyst, StockCharts.com
NEXT TEST IS DECEMBER HIGH... The technical condition of the stock market continues to improve. Chart 1 shows the S&P 500 clearing its 200-day moving average. Although not shown here, it also cleared a falling trendline extending back a year. Both are positive signs. The next test will...
READ MORE
