MEMBERS ONLY

Special Presentation: Beat the Benchmark!

by Alex Cole,
Co-founder, GoNoGo Charts®

by Tyler Wood,
Co-founder, GoNoGo Charts®
In this special one-hour workshop, viewers will gain a thorough understanding of critical concepts in technical analysis and how to apply them to their own investment process. Specifically, Alex and Tyler will address allocation and security selection to improve performance results, no matter what investment products, time period, or trading...
READ MORE
MEMBERS ONLY
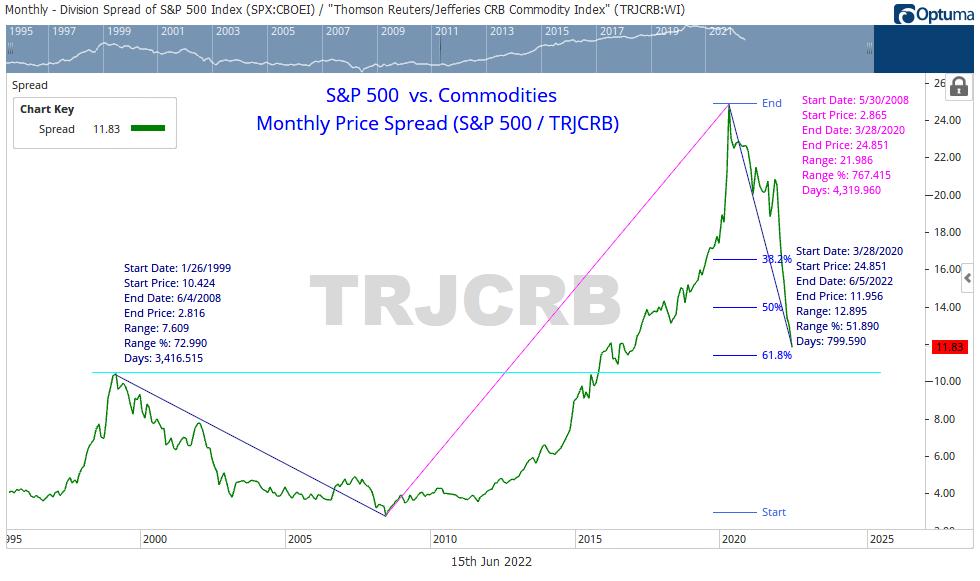
Mish's Daily: Can the Fed Control Inflation with Higher Rates?
So, the whole U.S. watched the Fed raise rates by .75 bps today. And, with all the news coverage and analysis, yours truly has tried to warn you all that, whether the Fed raised by 50 or 75 bps, it does not matter.
Equities underperformed commodities from 1999 to...
READ MORE
MEMBERS ONLY

Four Charts that are Acting in an Unintuitive Way

by Martin Pring,
President, Pring Research
Prices often move in the opposite direction to the expectations of most investors and traders. In many cases, that happens because the latest news has already been factored into prices and market participants have already begun to anticipate the next development. For example, a group of institutions might like the...
READ MORE
MEMBERS ONLY
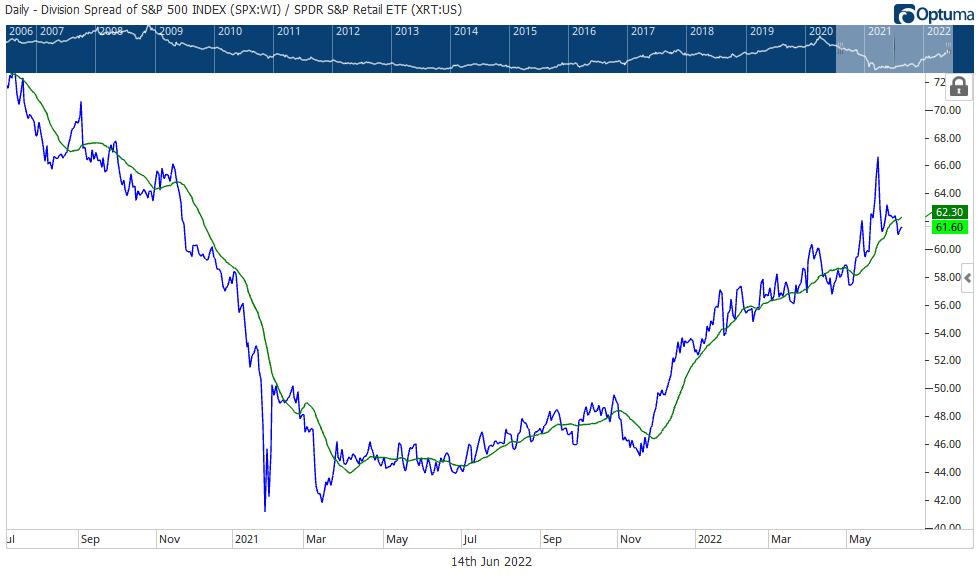
Mish's Daily: For Signs of a Relief Rally, Watch the S&P 500 v. Retail
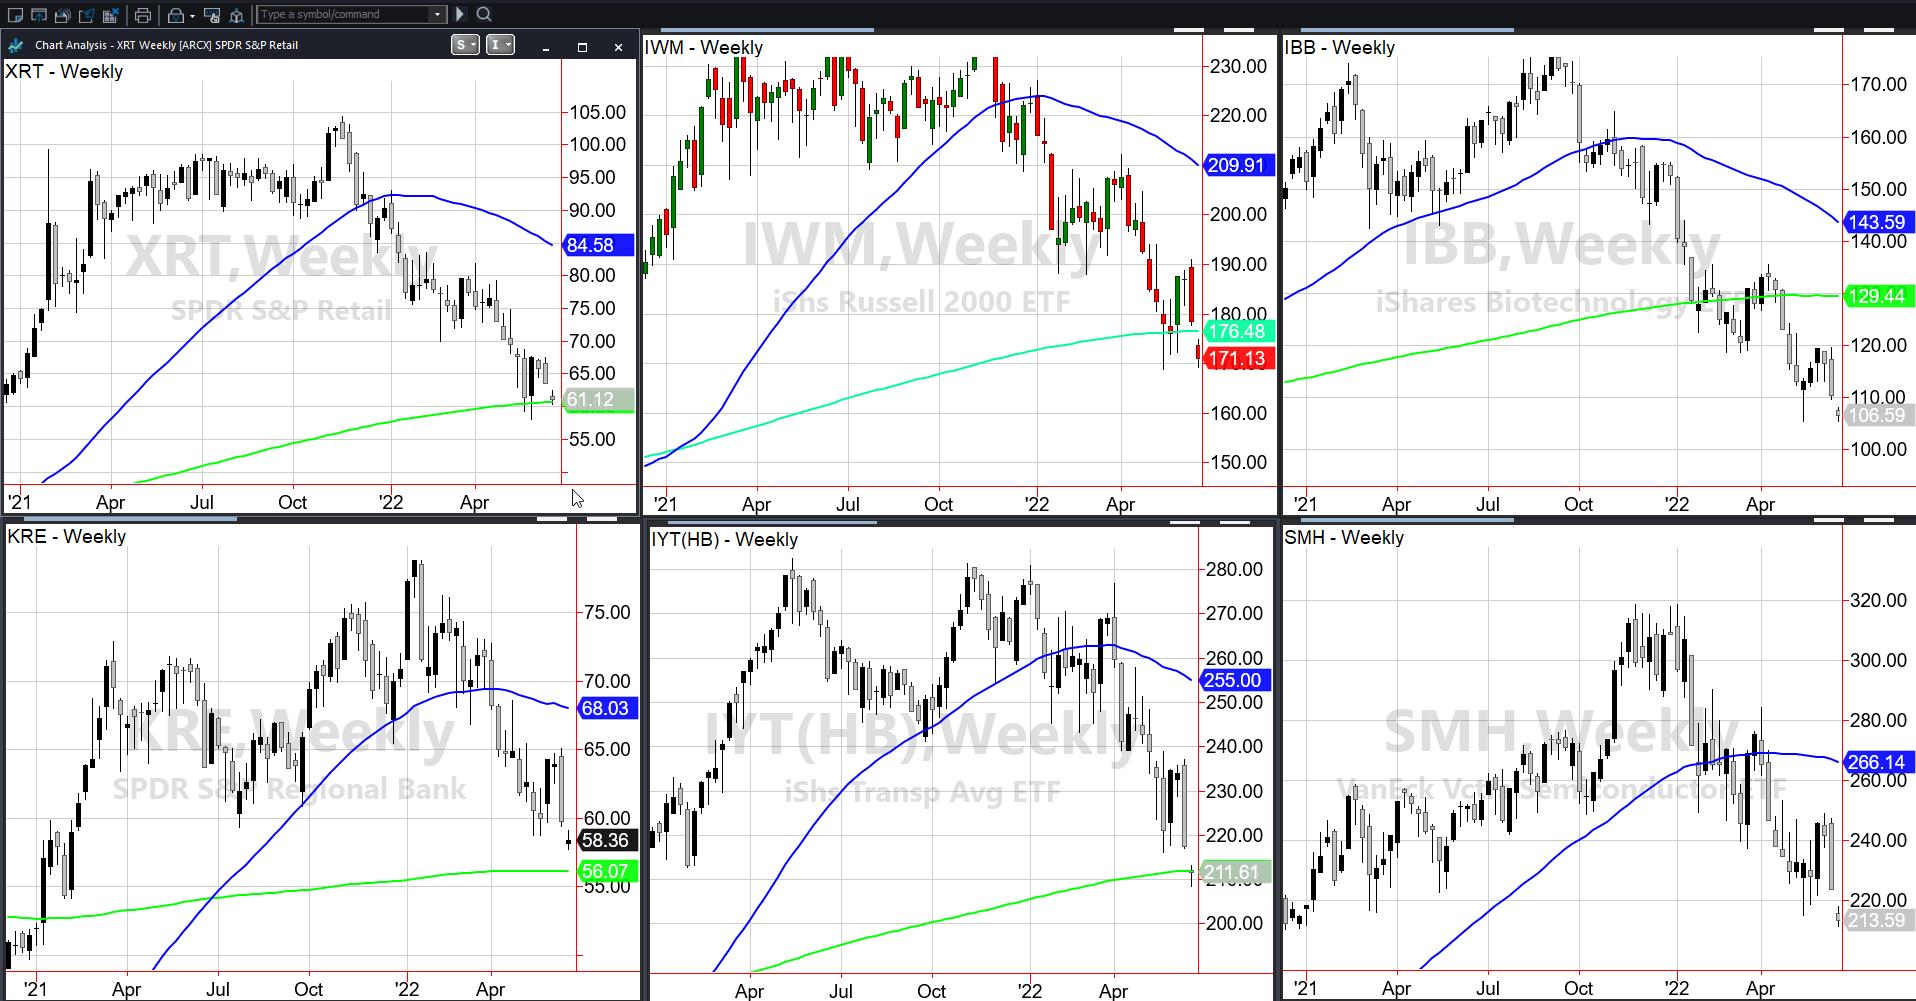
Pretty much everyone has turned into a bear. And no surprise, really. Personally, I think the bears are a bit late to the party. Nonetheless, the inflation concerns are real. The QT concerns are real. Yet the worries about recession, although real, may not necessarily come to pass as most...
READ MORE
MEMBERS ONLY
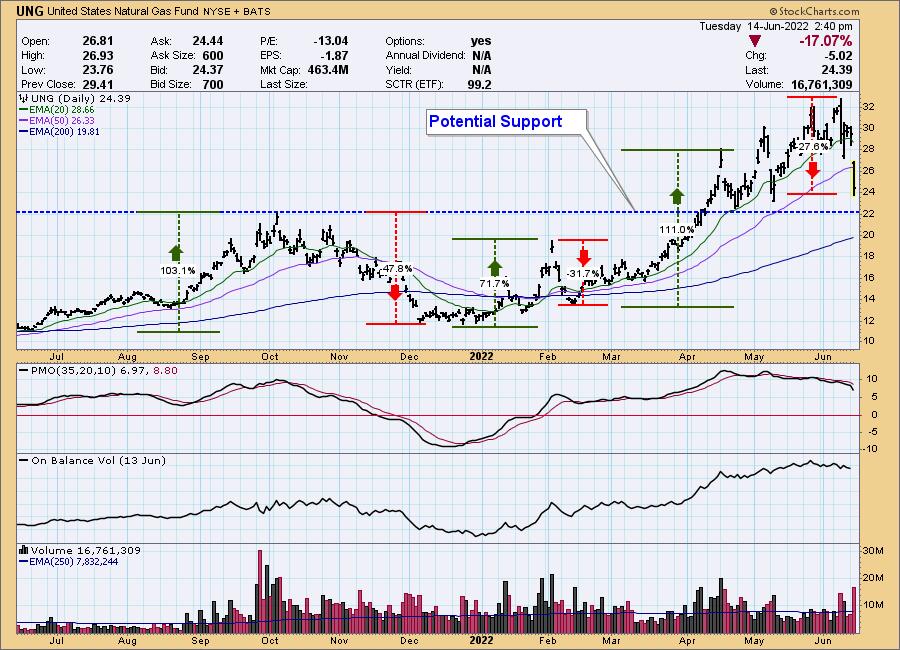
A Bad Day for Natural Gas (UNG)

by Carl Swenlin,
President and Founder, DecisionPoint.com
"The best laid schemes o' mice an' men. Gang aft a-gley".
--Robert Burns
Or as a Yiddish saying goes: "Man plans, God laughs." There is no better example of this than what has happened with natural gas this month. With energy supplies being challenged...
READ MORE
MEMBERS ONLY

Sector Spotlight: Tracking the Stock Market Slide on RRG

by Julius de Kempenaer,
Senior Technical Analyst, StockCharts.com
In this edition of StockCharts TV's Sector Spotlight, I jump right into the rotations for asset classes and sectors. At asset class level, the only things that go up in price are commodities; the USD has made a strong move and is back on track. Meanwhile, both stocks...
READ MORE
MEMBERS ONLY
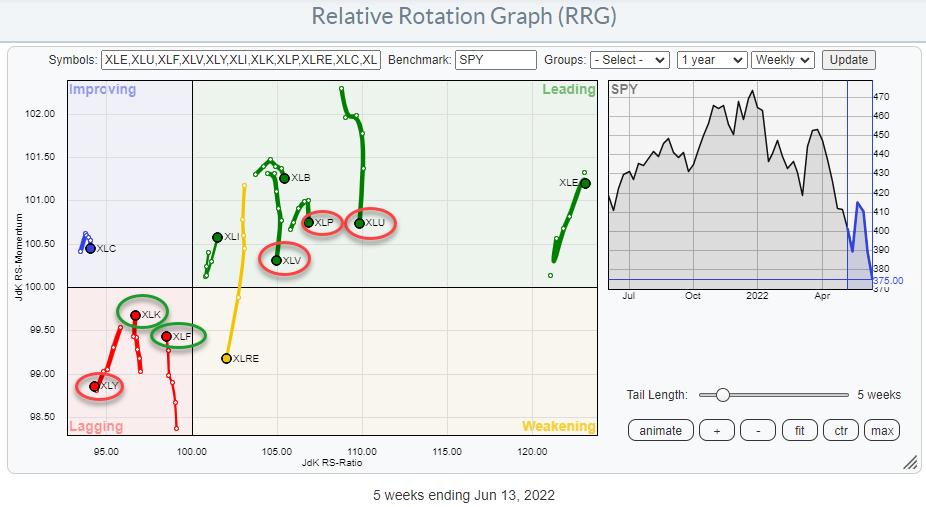
Sector Rotation At Cross Roads, Defense Likely To Take Back The Lead.
by Julius de Kempenaer,
Senior Technical Analyst, StockCharts.com
Weekly
The Relative Rotation Graph for US sectors is arriving at an important juncture.
For months the defensive sectors have been the leading segment in the S&P, even before the peak was reached Utilities, Staples, and Healthcare started leading the market from a relative perspective. These sectors were...
READ MORE
MEMBERS ONLY
Sentiment Is Playing Out Beautifully; THE Bottom Could Print At Any Time

by Tom Bowley,
Chief Market Strategist, EarningsBeats.com
At the beginning of 2022, I suggested that one of the biggest issues needing to be resolved was sentiment. The S&P 500 had climbed too far too fast and so many new traders post-pandemic didn't understand what might happen during a cyclical bear market. We honestly...
READ MORE
MEMBERS ONLY
Mish's Daily: Can the Consumer Save the Economy?
Last week, I did a part-educational, part-actionable webinar for the virtual money show (link below). My theme was and always is, the Economic Modern Family.
On the weekly charts, some of the members have broken down under their 200-week moving average, while others tested and held it and others have...
READ MORE
MEMBERS ONLY

DP TV: Bitcoin Crash, SPY in Ruins - Now What?

by Erin Swenlin,
Vice President, DecisionPoint.com
by Carl Swenlin,
President and Founder, DecisionPoint.com
In this episode of DecisionPoint, Carl and Erin spend time discussing not only the current market chaos, but also looking at history as a guide. They give their perspectives on two prior bear markets and what it could mean for the markets now. Carl talks about the possible end of...
READ MORE
MEMBERS ONLY
Do Your Homework and Get Better Grades Trading PLUS 3 Trade Setups
by Tom Bowley,
Chief Market Strategist, EarningsBeats.com
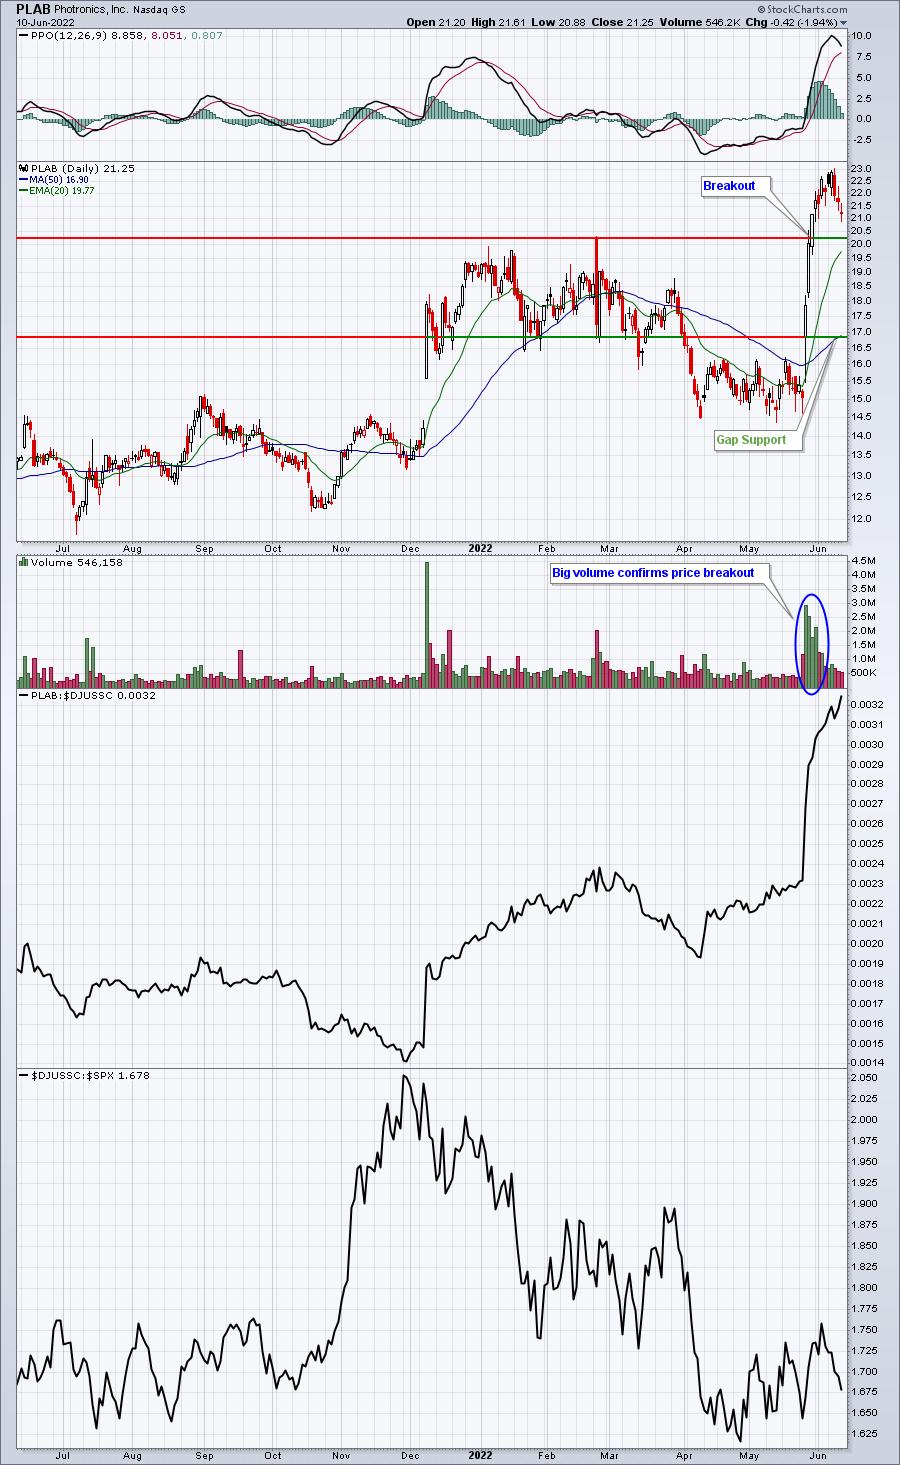
I remember many years ago, I was fascinated by the fast-moving, low-dollar stocks. It just seemed like easy money. Let me give you one piece of advice. When you think something is "easy money", run for the hills. To give you a business analogy, those volatile low-dollar stocks...
READ MORE
MEMBERS ONLY
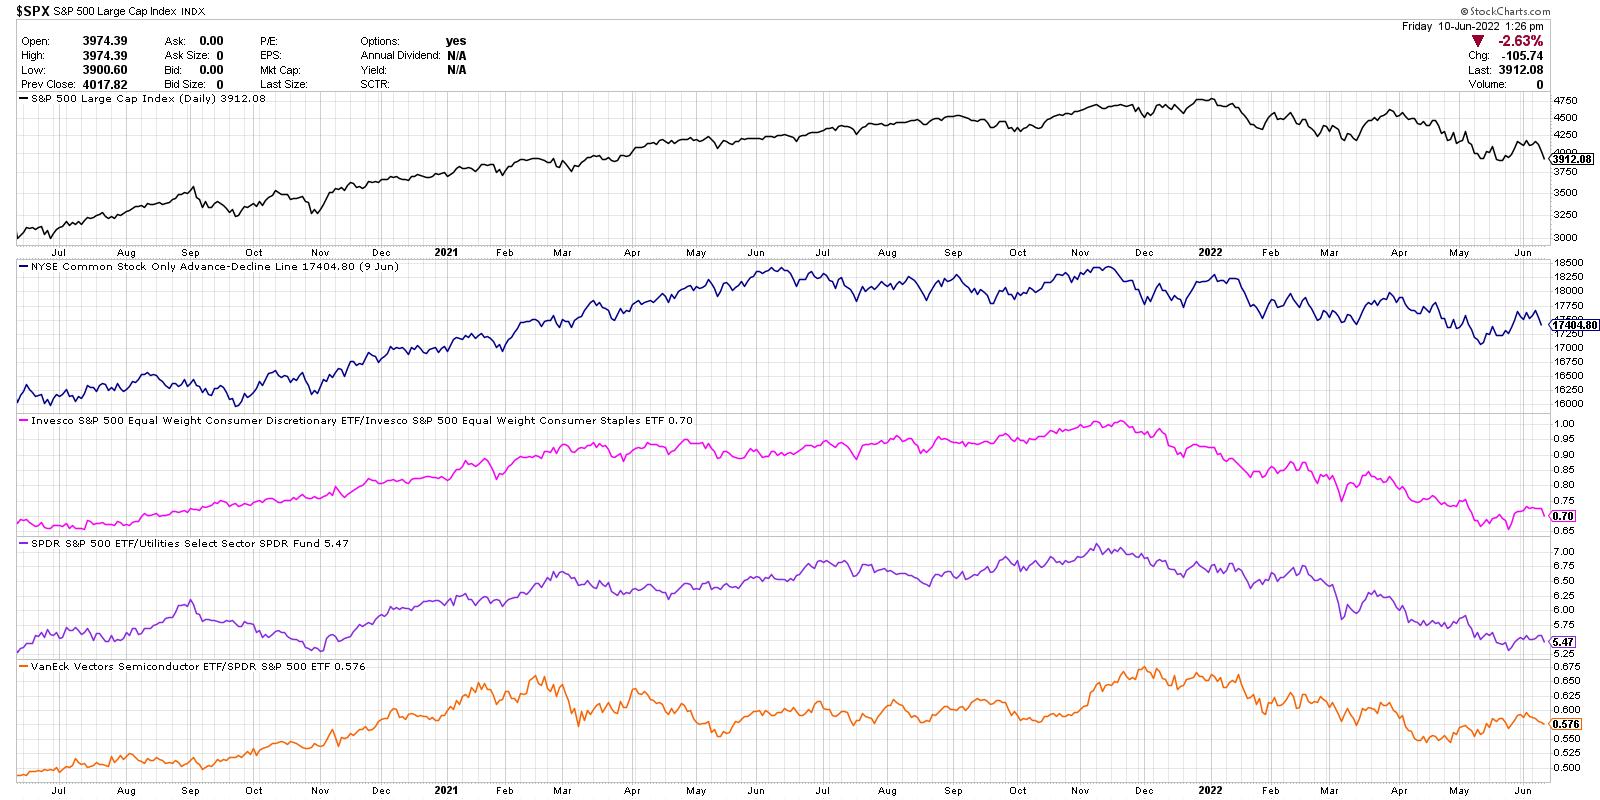
Sectors Investors Need to Focus on After Friday's Large Breakdown
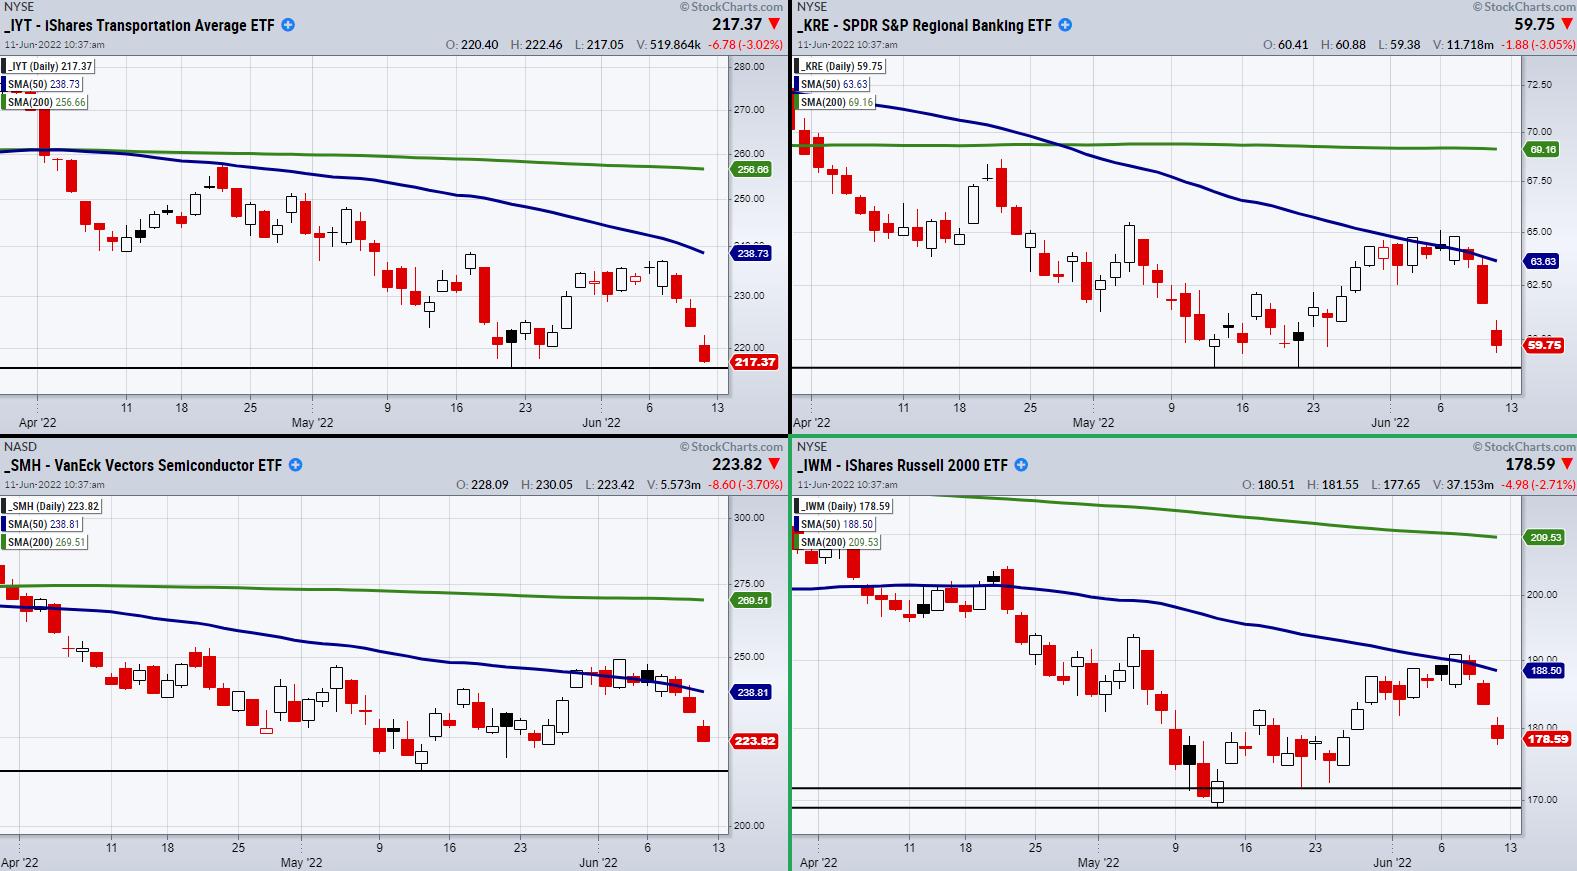
On Friday, the CPI numbers were reported, showing that, while the Fed has continued to increase rates, inflation has again pushed higher. This worsens investor sentiment and increases fears that a recession is inbound. This was reflected in the stock market as the major indices broke down.
However, increased inflation,...
READ MORE
MEMBERS ONLY

FOUR DECADE HIGH IN INFLATION PUSHES STOCK AND BOND PRICES SHARPLY LOWER -- BOND YIELD NEARING MAJOR UPSIDE BREAKOUT -- NO SIGN OF A TOP IN OIL

by John Murphy,
Chief Technical Analyst, StockCharts.com
HOT CPI REPORT SIGNALS LOWER STOCK PRICES... Friday's report that the May Consumer Price Index gained 8.6% from the previous year was the highest inflation rate in more than forty years and pushed stock prices sharply lower for the day and week. Going into the report, expectations...
READ MORE
MEMBERS ONLY
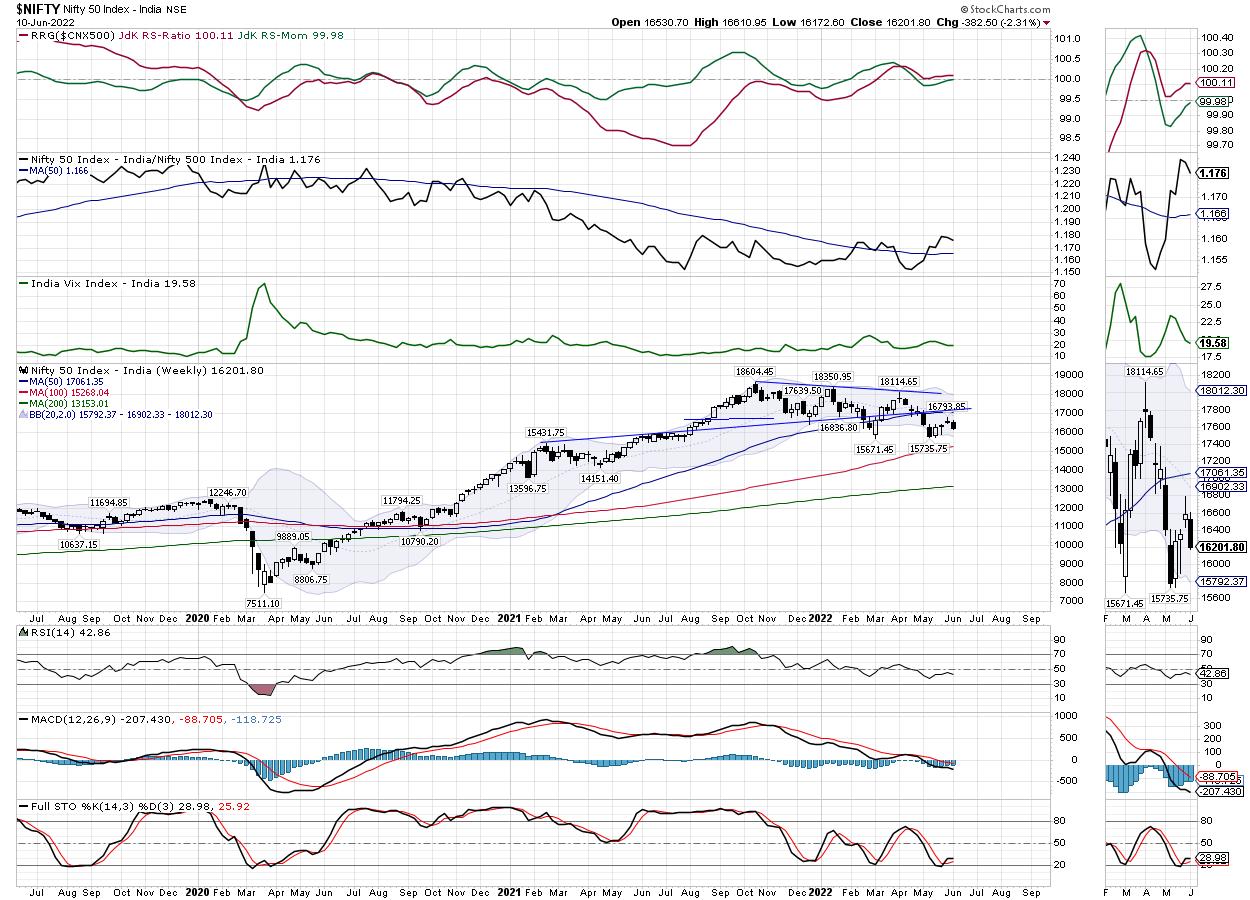
Week Ahead: NIFTY in a Broad Trading Range; Mix of Low & High Beta Pockets May Show Relative Outperformance

by Milan Vaishnav,
Founder and Technical Analyst, EquityResearch.asia and ChartWizard.ae
During a week that remained largely bearish, the Indian equity markets retraced and ended on a negative note. Unlike the previous week, this time, over the past five sessions, the NIFTY did not oscillate in either direction. Instead, it just remained unilaterally bearish for the major part of the week....
READ MORE
MEMBERS ONLY

Trend Signals for the Big Sectors Tell the Story

by Arthur Hill,
Chief Technical Strategist, TrendInvestorPro.com
Last week I wrote about the downtrend in SPY and showed a resistance/reversal zone based on broken supports and the 50% retracement line. SPY failed at this zone and moved sharply lower this past week. This is hardly surprising because the Market Regime is bearish and bearish outcomes are...
READ MORE
MEMBERS ONLY

This Sector Bucked Last Friday's Decline and Could Be Ready to Take Off
by Martin Pring,
President, Pring Research
A couple of weeks ago, I wrote about the fact that the technical position of gold was extremely finely balanced, and that it was "Either in a Hard Place or a Sweet Spot". My conclusion was that its short-term position was improving and that the sweet spot scenario...
READ MORE
MEMBERS ONLY
One Chart to Rule Them All

by David Keller,
President and Chief Strategist, Sierra Alpha Research
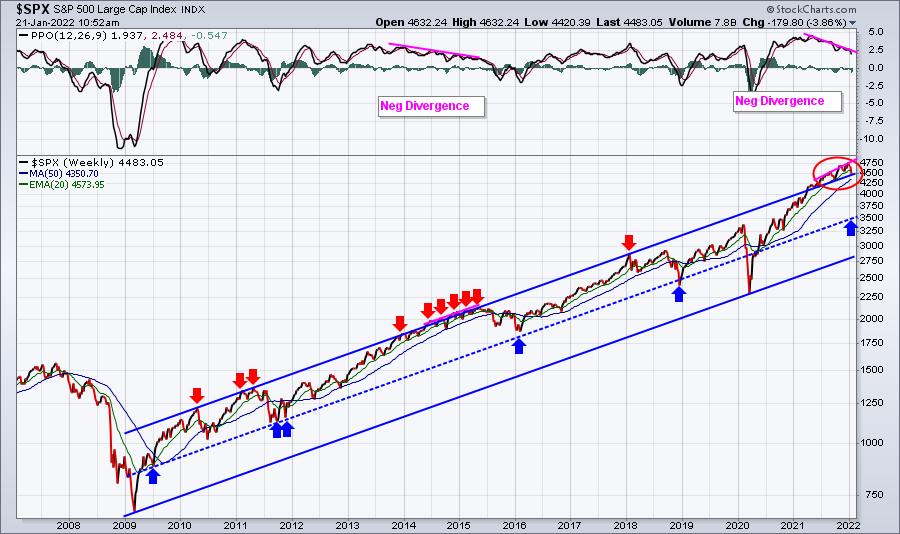
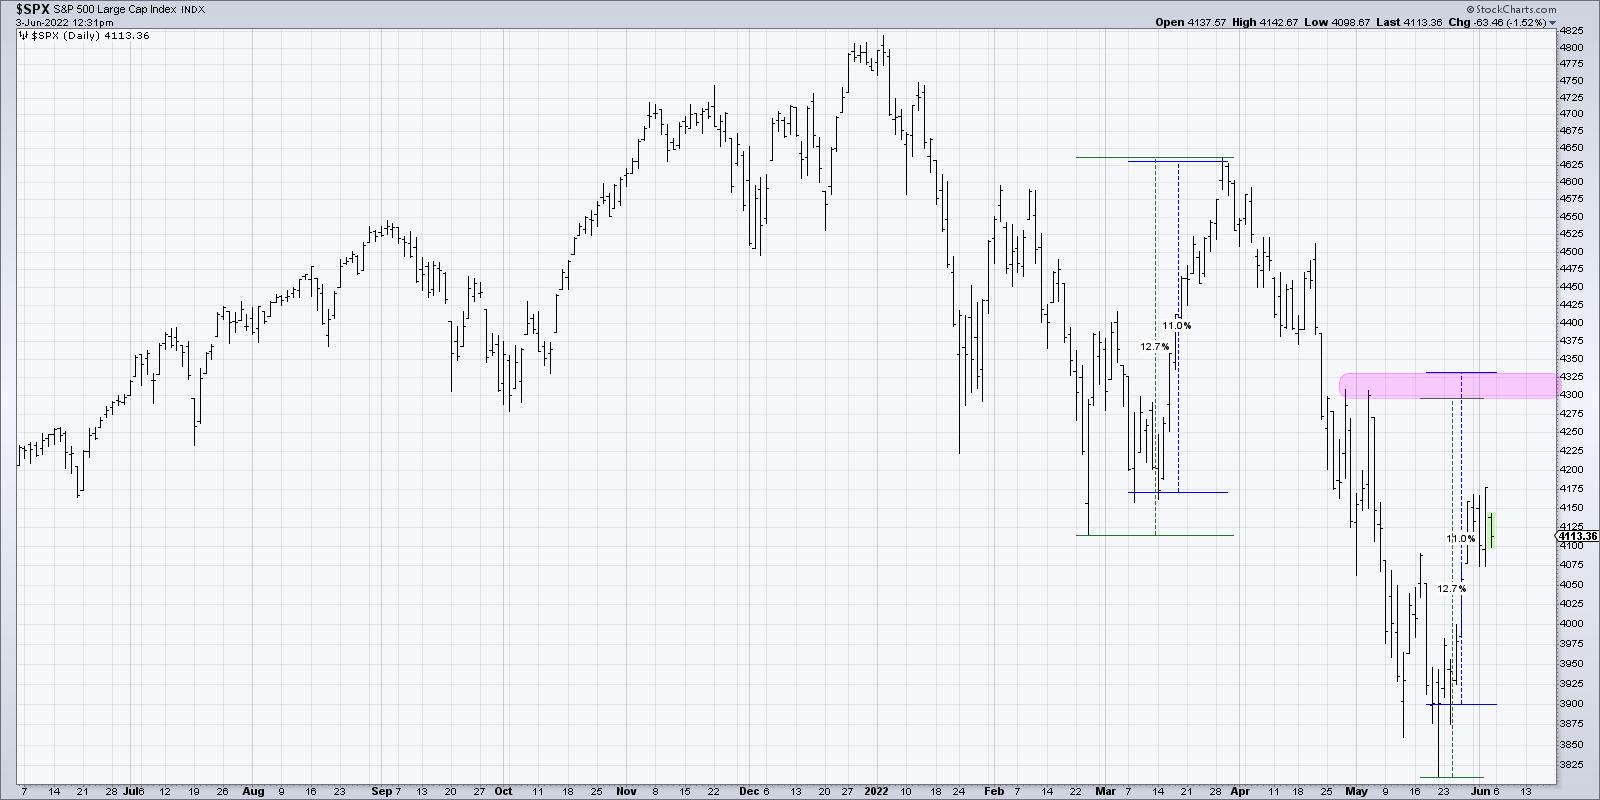
One of my early mentors, Ralph Acampora, suggested that, if you want to understand the trend in the S&P 500, you simply need to look at the chart of the S&P 500.What is the trend? Are we seeing higher highs or lower lows? Where are...
READ MORE
MEMBERS ONLY

Markets Moved Down Ahead of CPI

by TG Watkins,
Director of Stocks, Simpler Trading
Previously, TG has said that we should be prepared for the markets to resolve lower instead of higher, as many were thinking. In this week's edition of Moxie Indicator Minutes, now that the move down has occurred, he explains that it will probably be based on the CPI...
READ MORE
MEMBERS ONLY

GNG TV: Relief Rally Fails + Upcoming Special
by Alex Cole,
Co-founder, GoNoGo Charts®
On this week's edition of the GoNoGo Charts show, Alex takes a look at how equities have failed to move higher this week, making it more likely that last week's rally in equities was a relief rally, not the start of something more constructive. Starting from...
READ MORE
MEMBERS ONLY

Price is King

by Joe Rabil,
President, Rabil Stock Research
On this week's edition of Stock Talk with Joe Rabil, Joe explains why price is so important to market/stock analysis. He shows the ZigZag indicator and why it can be helpful in getting price structure straight in multiple time frames, then discusses how price structure unfolds differently...
READ MORE
MEMBERS ONLY
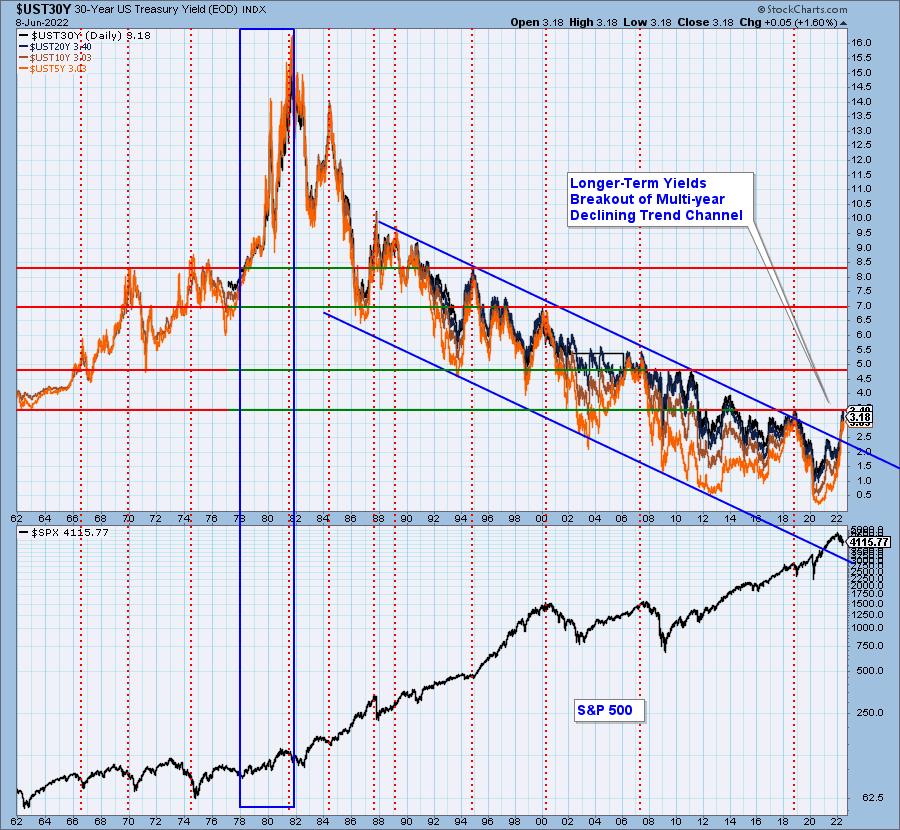
Are Yields Finally Ready to Top? History Suggests Not
by Erin Swenlin,
Vice President, DecisionPoint.com
It's been trending on social media that it is time for yields to top. One of the charts in the DPA ChartList (available to subscribers of DecisionPoint.com Blogs) is a long-term yield chart. The chart in the ChartList includes 1-yr yield on up to the 30-year yield,...
READ MORE
MEMBERS ONLY
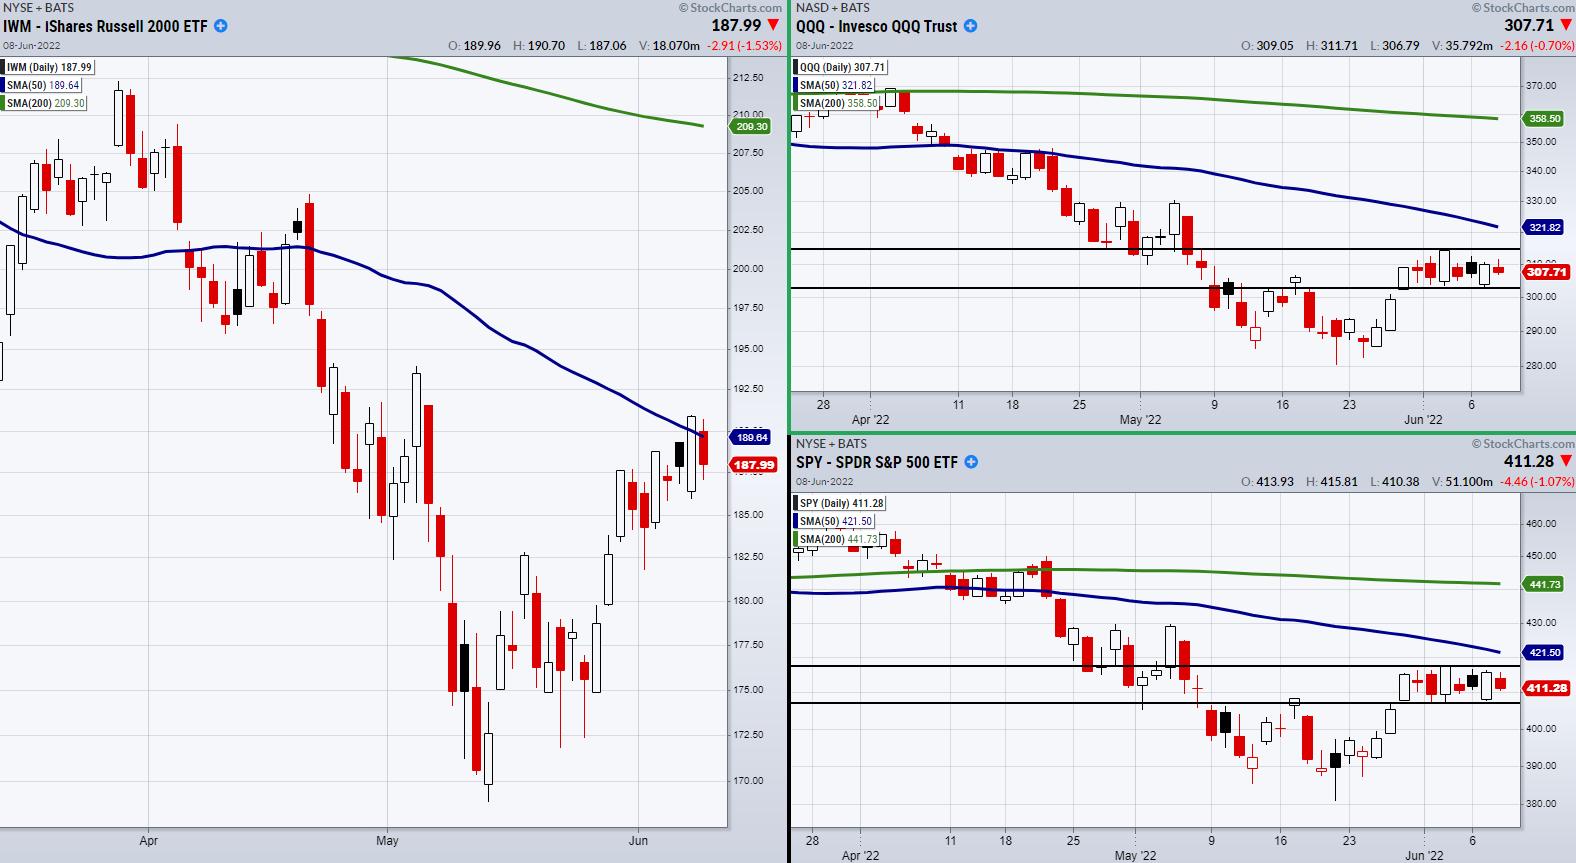
Watch for The Nasdaq 100 and S&P 500 to Clear Their Mini-Ranges
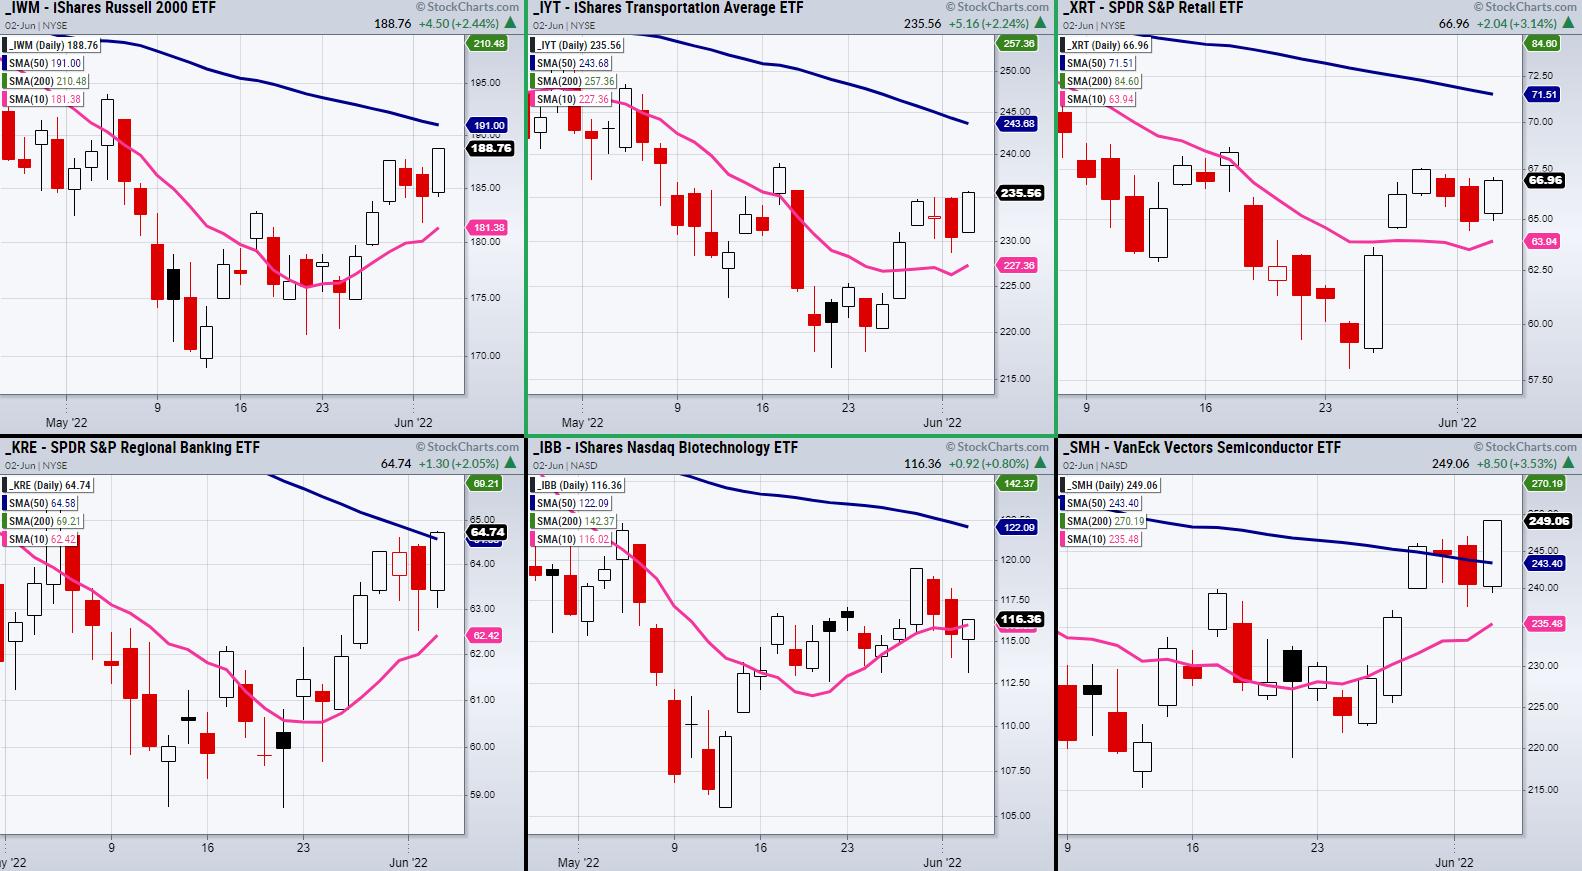
On Wednesday, the Russell 2000 (IWM) failed to make a second close over its 50-day moving average.
As the current leader of the major indices, IWM has been playing a very important role in the overall market direction. While Tuesday's strength in IWM hasn't carried over,...
READ MORE
MEMBERS ONLY

The Good, The Bad and The Ugly Trades

by Dave Landry,
Founder, Sentive Trading, LLC
On this week's edition of Trading Simplified, Dave shows you his last four of the next 100 trades, warts and all. He then covers where we are with the S&P 500, based on the "buy line" and the TFM 10% System.
This video was...
READ MORE
MEMBERS ONLY

What Happens When Bonds Start to Outperform Stocks?
by Martin Pring,
President, Pring Research
It is possible for prices of individual asset classes to move in a linear up or down trend for an extended period. However, this rarely happens with inter-asset relationships, which rotate around the business cycle. As a result, it is helpful to monitor inter-asset relationships and their momentum to see...
READ MORE
MEMBERS ONLY
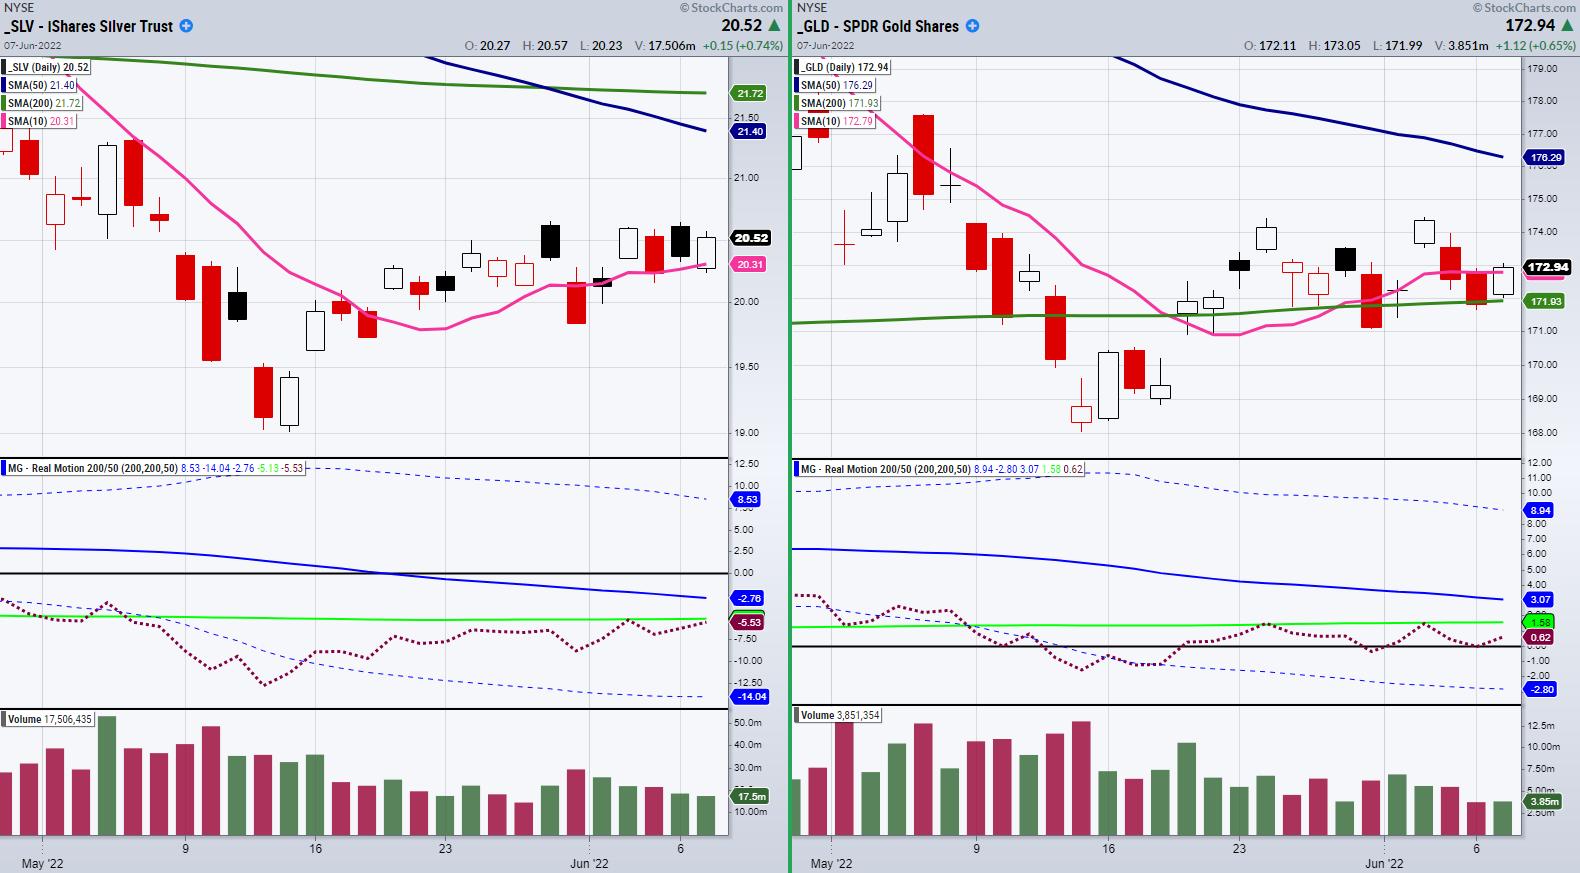
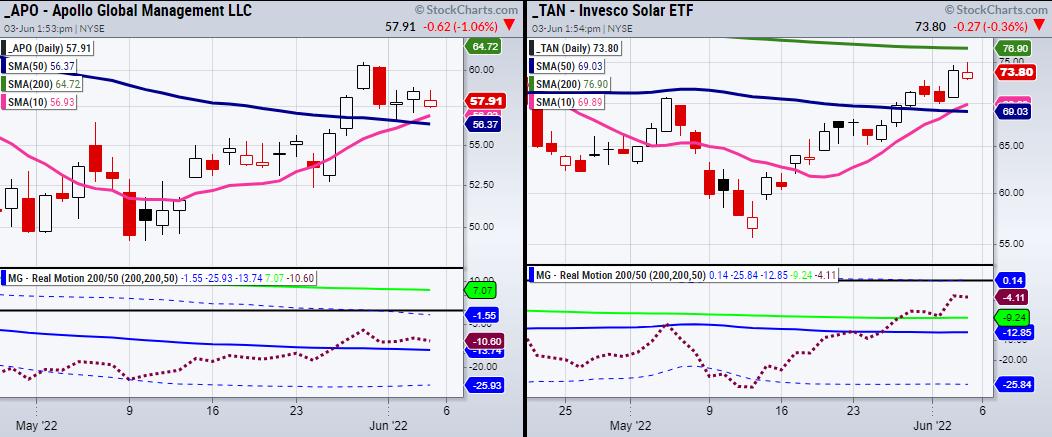
Are Gold and Silver Ready for a Momentum Breakout?
Although we are watching for another step up in the major indices, we are also looking at safety plays in commodities. Specifically, analyzing precious metals such as gold (GLD) and Silver (SLV), one thing stands out when using our Real Motion indicator. While both symbols have similar price action, one...
READ MORE
MEMBERS ONLY
Sector Spotlight: Real Estate Has Peaked
by Julius de Kempenaer,
Senior Technical Analyst, StockCharts.com
In this edition of StockCharts TV's Sector Spotlight, after addressing seasonality and monthly charts in last week's episode, I go back to talking you through the current rotations in Asset Classes and Sectors. The big picture is still for stocks going through a temporary recovery within...
READ MORE
MEMBERS ONLY
DP TV: Digestion... or Indigestion?
by Erin Swenlin,
Vice President, DecisionPoint.com
by Carl Swenlin,
President and Founder, DecisionPoint.com
In this episode of DecisionPoint, Carl and Erin discuss their short-term bullish expectations and whether they are still valid under current market conditions. Carl covers "breadth with depth" indicators for Nasdaq, NYSE and Mid- and Small-caps. Erin dives into two sectors "under the hood" to find...
READ MORE
MEMBERS ONLY
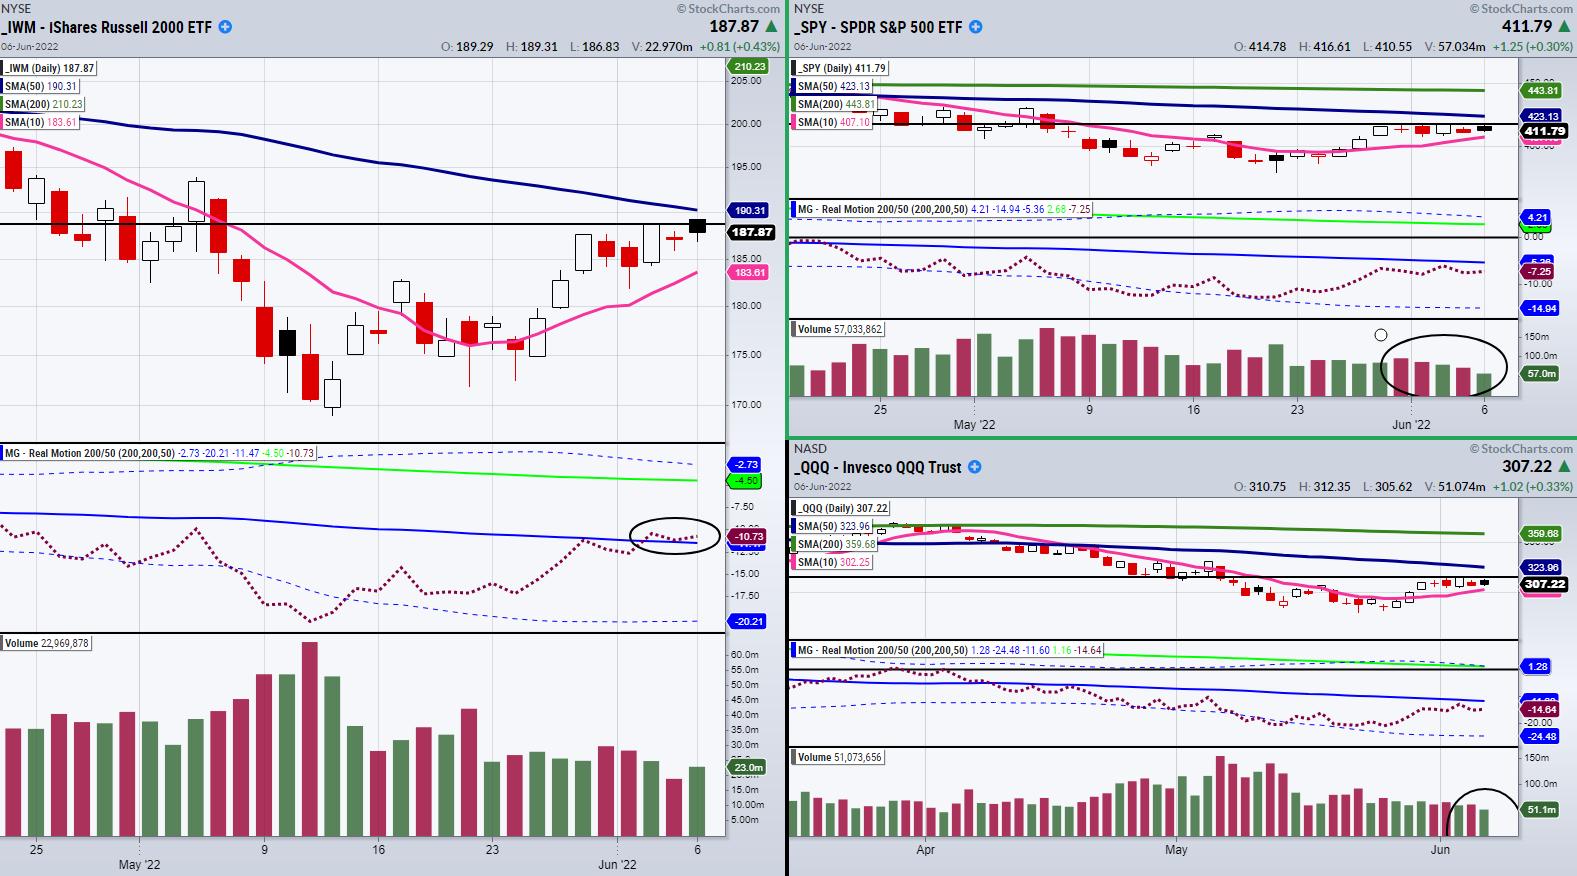
3 Things Need to Align for The Next Big Market Move
Currently, the small-cap index Russell 2000 (IWM) is leading in momentum compared to the S&P 500 (SPY) and the Nasdaq 100 (QQQ). Looking at our Real Motion momentum (RM) indicator found in the above charts, we can see that RM is barely leading over the 50-DMA, while the...
READ MORE
MEMBERS ONLY

MEM TV: High Volume Gainers in a Tough Market

by Mary Ellen McGonagle,
President, MEM Investment Research
On this episode of StockCharts TV'sThe MEM Edge, Mary Ellen reviews pockets of strength in this dire market and why select stocks are poised to trade higher. She also reviews key factors that will continue to drive price action in the broader markets.
This video was originally broadcast...
READ MORE
MEMBERS ONLY

Bearish Market Regime and Downtrend Weigh on SPY
by Arthur Hill,
Chief Technical Strategist, TrendInvestorPro.com
The S&P 500 SPDR (SPY) is in a long-term downtrend and the Composite Breadth Model at TrendInvestorPro is bearish. A bearish Market Regime is a dangerous combination for stocks. The S&P 500 is the most important benchmark for US stocks, while the Composite Breadth Model measures...
READ MORE
MEMBERS ONLY
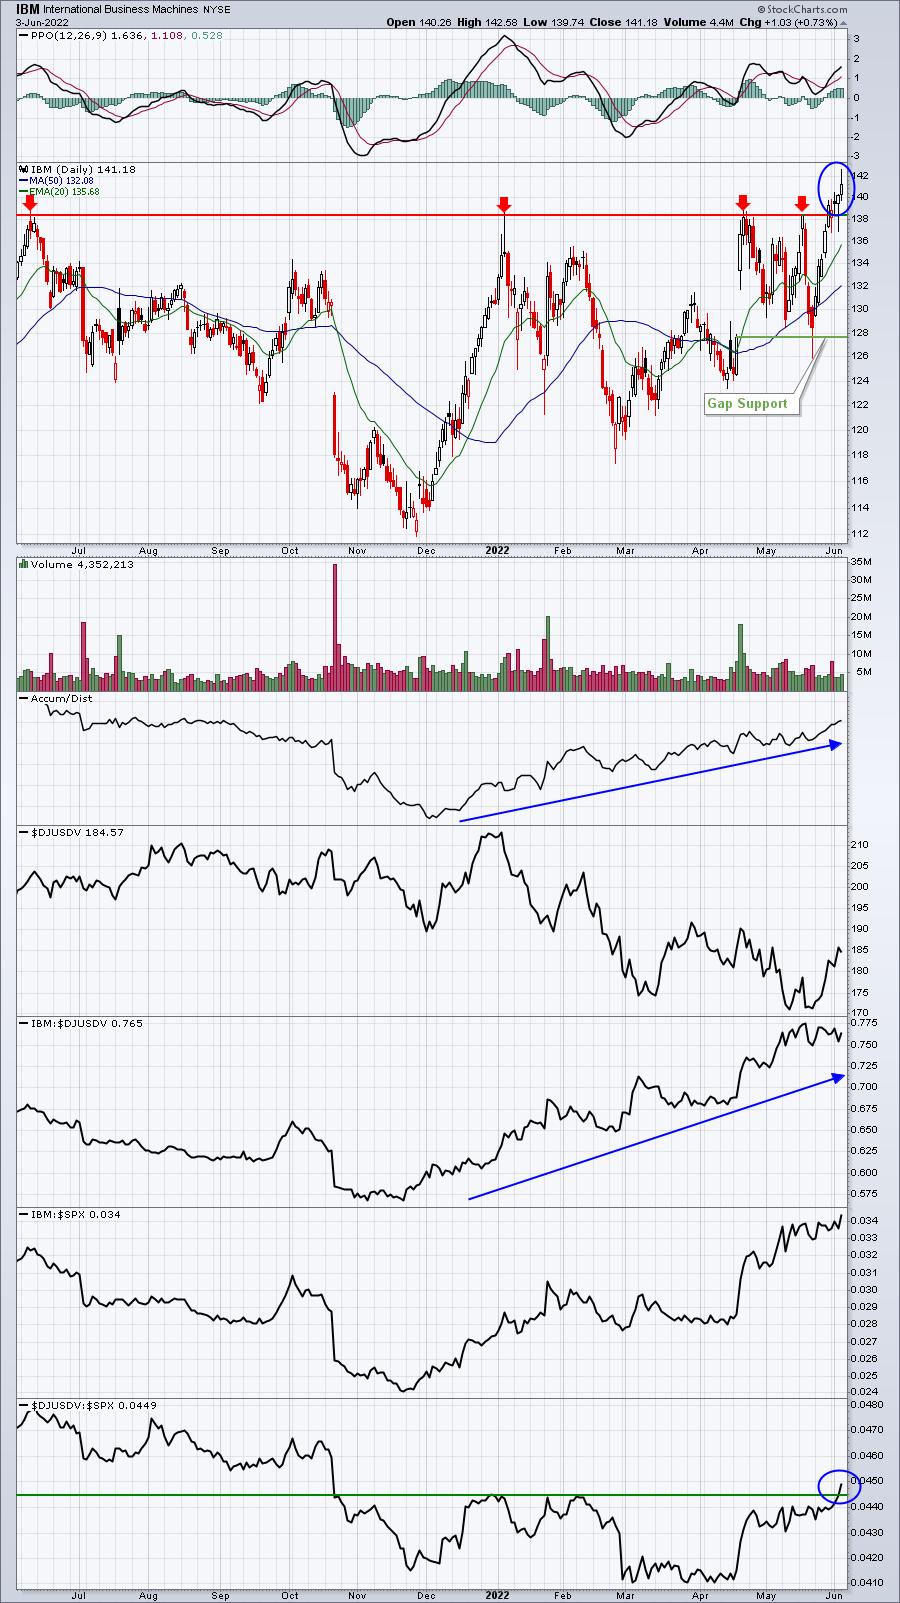
The 2 Most Surprising Charts RIGHT NOW
by Tom Bowley,
Chief Market Strategist, EarningsBeats.com
I don't think I could possibly write an article like this one without acknowledging the simply amazing 2022 performance of "Big Blue", International Business Machines (IBM). First, I want to tell it like it is. IBM has been one of the worst performing Dow components over...
READ MORE
MEMBERS ONLY
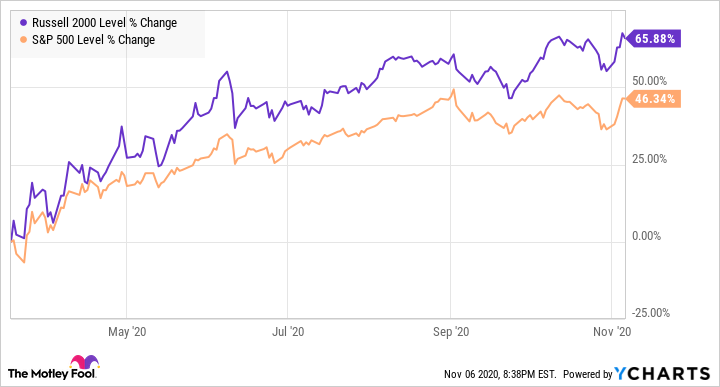
Small-Cap Stocks Held Up The Best Last Week. Here's Why You Need to Pay Attention
by Mary Ellen McGonagle,
President, MEM Investment Research
The Russell 2000 Small Cap Index peaked in price late last year. With inflation rates not seen in 40 years and interest rates headed higher, this Index has taken a beating, with a 23.5% decline that puts it in bear market territory.
Small-cap stocks have had plenty of hurdles...
READ MORE
MEMBERS ONLY
Trading with Quick Exits
by TG Watkins,
Director of Stocks, Simpler Trading
In this week's edition of Moxie Indicator Minutes, TG takes a look at the market's overall sentiment by examining the SPY price action. He then points out patterns that he is seeing, including short squeezes and double bottoms.
This video was originally broadcast on June 3,...
READ MORE
MEMBERS ONLY
Why We are Focusing on Alternative Energy Symbols
It has been a tough year to pick winning stocks, and, with more uncertainty ahead, now is not the time to be heavily invested in tech and big names that have broken down in price over the recent months. Currently, oil and energy-related plays have been outperforming, and, with that,...
READ MORE
MEMBERS ONLY

SHORT-TERM STOCK REBOUND NOT THAT IMPRESSIVE
by John Murphy,
Chief Technical Analyst, StockCharts.com
NOT MUCH OF REBOUND...This time last week it seemed clear that stocks had put in a short-term bottom marking the start of a potential bear market rally. So far at least, that rally hasn't gone very far. The three charts shown below show the same overhead resistance...
READ MORE
MEMBERS ONLY
Defense Still Leads With a Pocket Of Strength in Commodity Chemicals
by Julius de Kempenaer,
Senior Technical Analyst, StockCharts.com
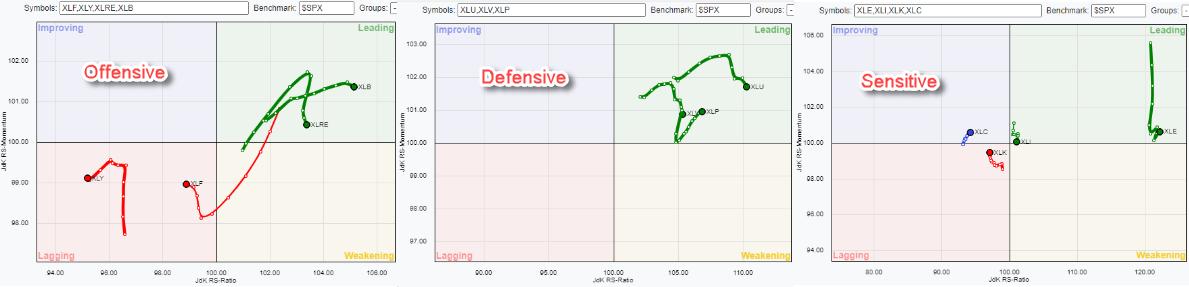
Breaking down the US sector universe into three groups (as opposed to two) -- Offensive/Cyclical, Defensive and Sensitive -- shows the current rotations as seen in the Relative Rotation Graphs above.
It is pretty clear, IMHO, that the defensive group (still) stands out. All three sectors -- Consumer Staples,...
READ MORE
MEMBERS ONLY
Lighter Volume Screams Market Top
by David Keller,
President and Chief Strategist, Sierra Alpha Research
I've written that bear market rallies can be sudden, severe and seductive. The move off the lows in May certainly seems to check all three boxes!Using analysis of price action, breadth indicators and volume techniques, I'll show how the similarities between the current market upswing...
READ MORE
MEMBERS ONLY
Is The Stock Market Looking for Temporary Relief?
The Russell 2000 (IWM) closed over its previous 3 trading days, making a small breakout from a consolidation area that has also held over its 10-Day moving average at $181.38. Additionally, many of Mish's Economic Modern Family members are following the same pattern as seen in the...
READ MORE
MEMBERS ONLY
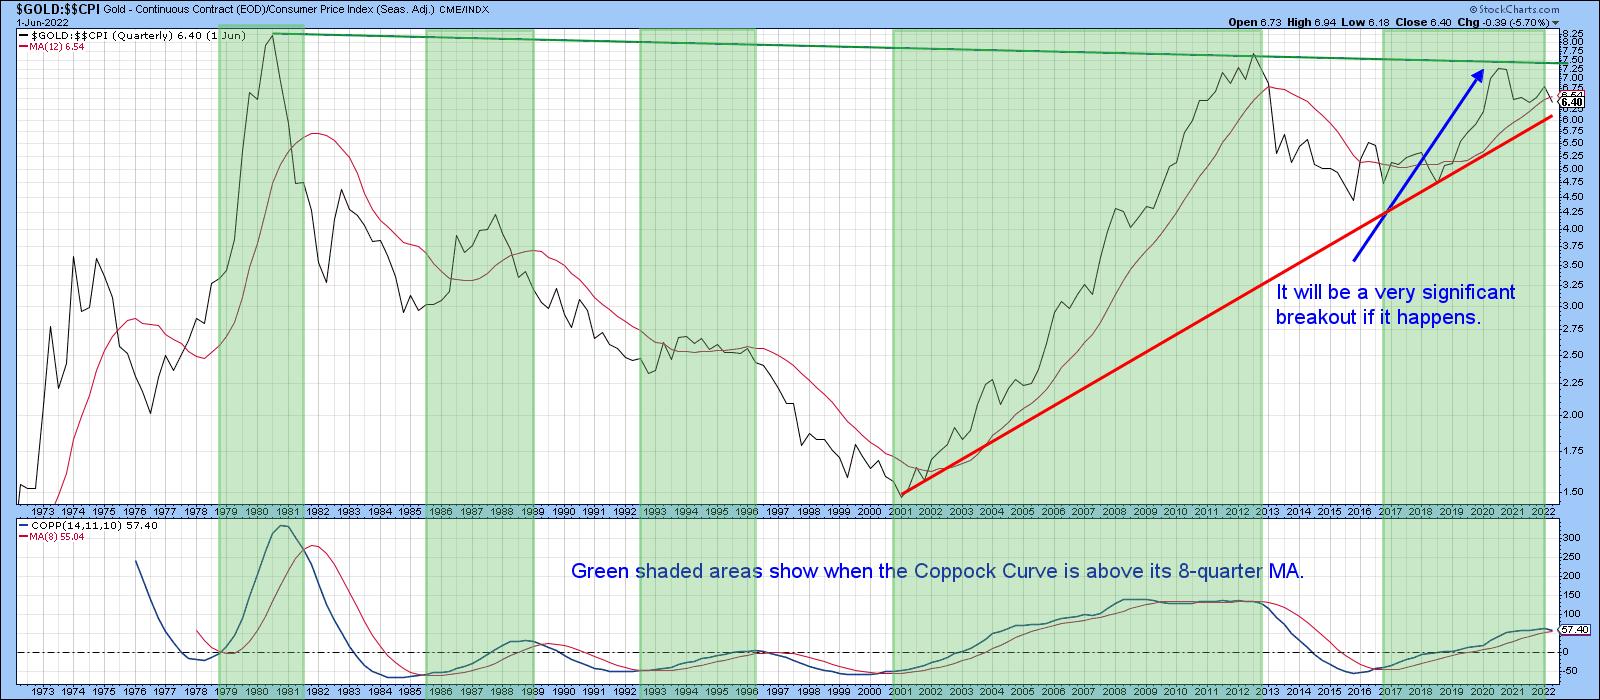
Gold: Either in a Hard Place or a Sweet Spot
by Martin Pring,
President, Pring Research
The long-term technical position of gold is extremely finely balanced and could easily tip into a full-fledged bear market, or start a new secular up leg to the bull trend that began in the opening years of this century.
Chart 1 really says it all. First, it expresses gold adjusted...
READ MORE
MEMBERS ONLY

Where Do We Go From Here? And Will This Rally Last?

by Larry Williams,
Veteran Investor and Author
Larry is back and ready to weigh in with his forecast of where stocks—and the economy—are headed in this new StockCharts TV special. He takes a look at some of the "Fallen Angels" of the market and discusses the ongoing situation with inflation. Afterwards, he focuses...
READ MORE
